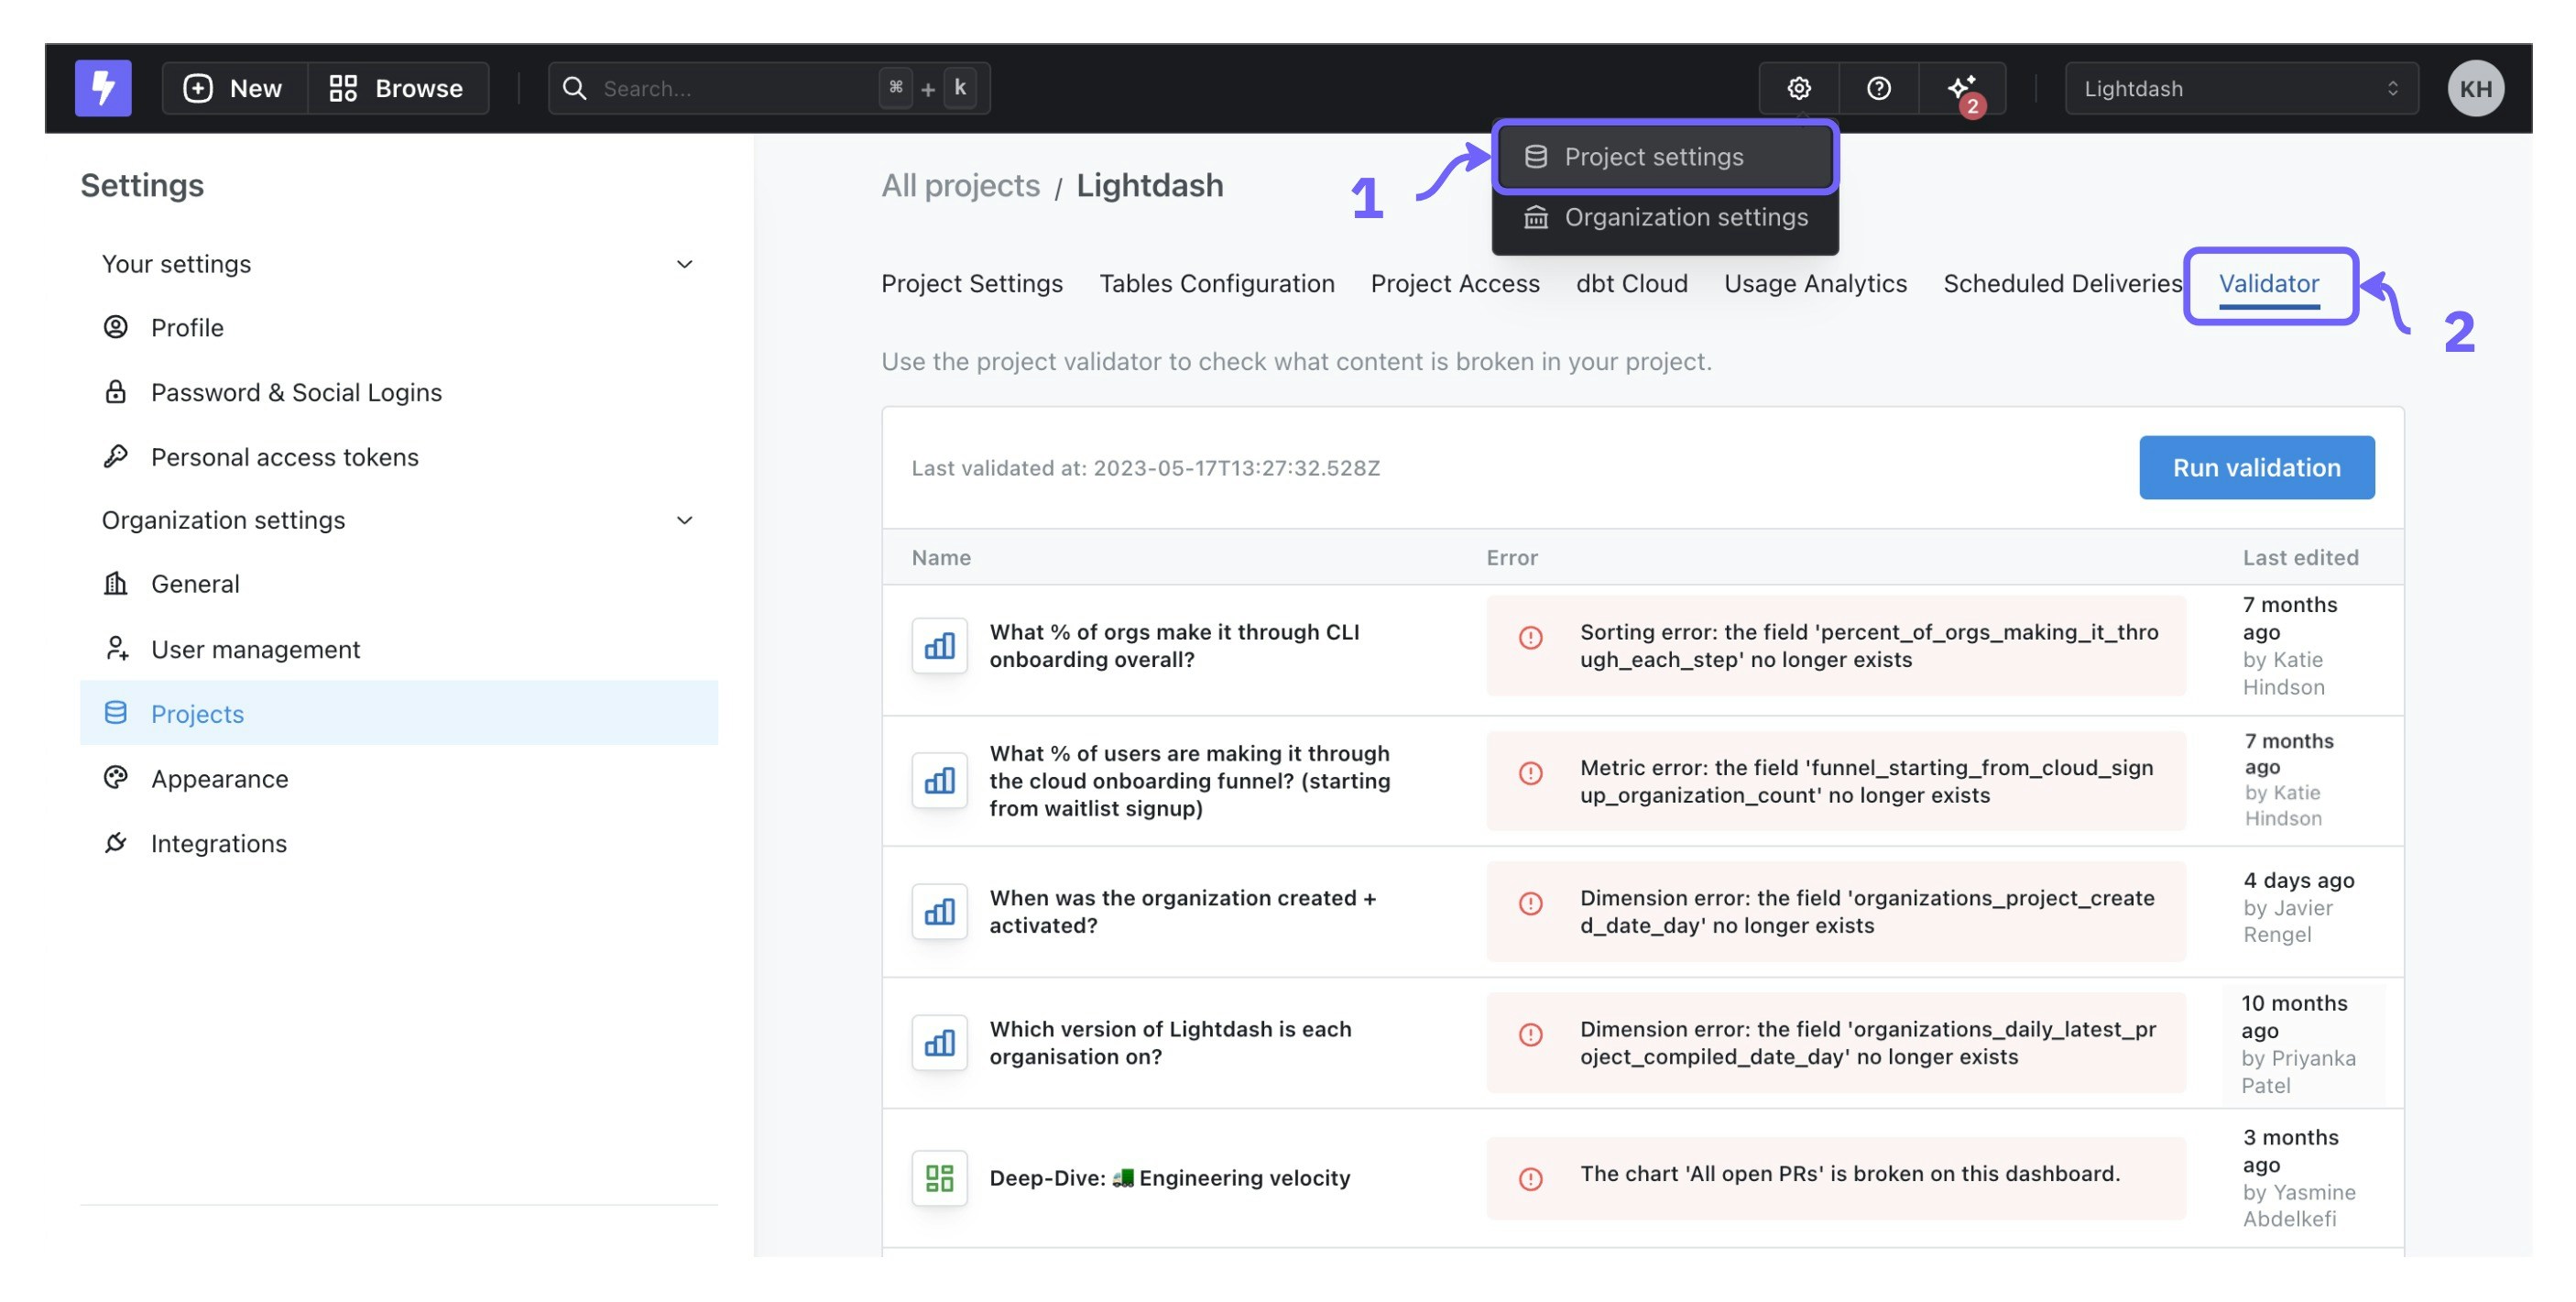
How can I validate my content?
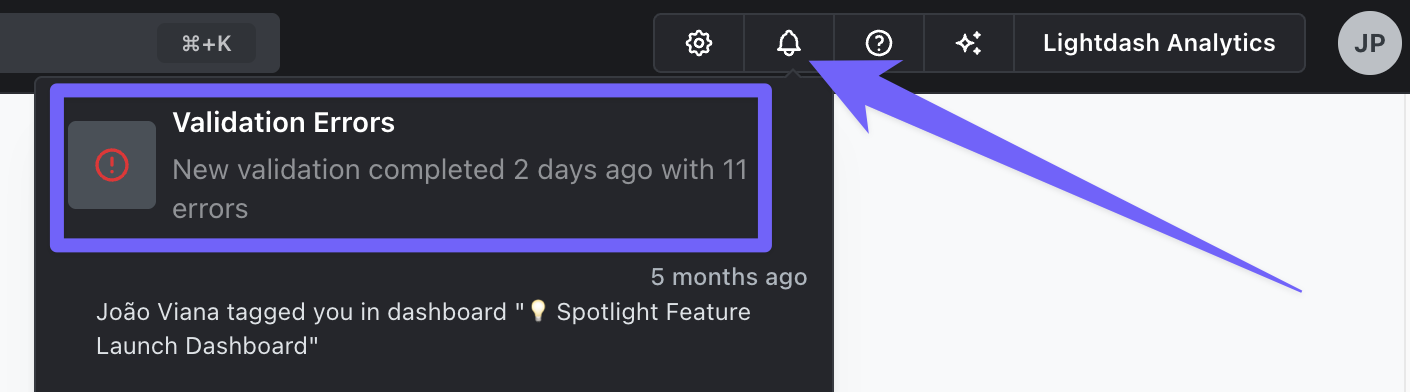
Your project is validated any time the content validator is run. The content validator will run when:- a user hits
Refresh dbtin the app - the command
lightdash deployis run on the Lightdash CLI (you can read more about automatically deploying your changes using GitHub actions here) - you update your project settings and hit
Test and compile. - you hit
Run validationdirectly inside the content validator dashboard - you run
lightdash validatefrom the CLI
What content is included in the validation?
The validator will show you any errors caused by metrics or dimensions which no longer exist, have been renamed, or have invalid definitions. The validator does not show errors caused by invalid SQL at run time (e.g. invalid SQL syntax, division by 0, trying to perform numeric calculations on a string value type). Here are some examples of errors that would appear in your content validator:- Renaming a metric from
total_revenuetosum_revenue. The old metric name is used in a chart, so it breaks the chart. - Deleting a dimension
is_premium_userwhich is referenced in a metric’s custom SQL definition. - Deleting a dimension
is_premium_userwhich is used as a filter on a dashboard.
- Tables: errors in tables are caused when dimensions or metrics that have been deleted or renamed but are still referenced in other places in the table.
- Charts: errors in charts are caused when the results table or filters reference a metric or dimension which no longer exists.
- Dashboards: errors in dashboards are caused when a chart is broken in the dashboard or a filter references a metric or dimension which no longer exists.
How to fix errors
There are a few ways to fix errors that appear in the validator: Table errors require you to check your YAML and fix orphaned references. This can be done with find and replace in your code editor. Chart and dashboard errors can be resolved by opening the content in Lightdash and updating the field references, but this usually means you have to rebuild your chart(s). The preferred method to resolve errors is to rename fields in the app or uselightdash rename in the CLI. You can also find and replace references in charts and dasboards using dashboards as code.
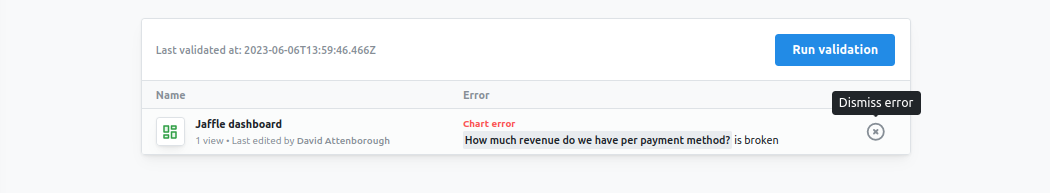
How to dismiss errors
You can dismiss errors from validation by clicking on the “x” button that appears when you hover over a row on the validation table.