- used to power a single saved chart
- turned into a virtual view so it becomes a reusable table
- written back to dbt as a model
developer or admin access can use the SQL runner.
Getting started with the SQL Runner
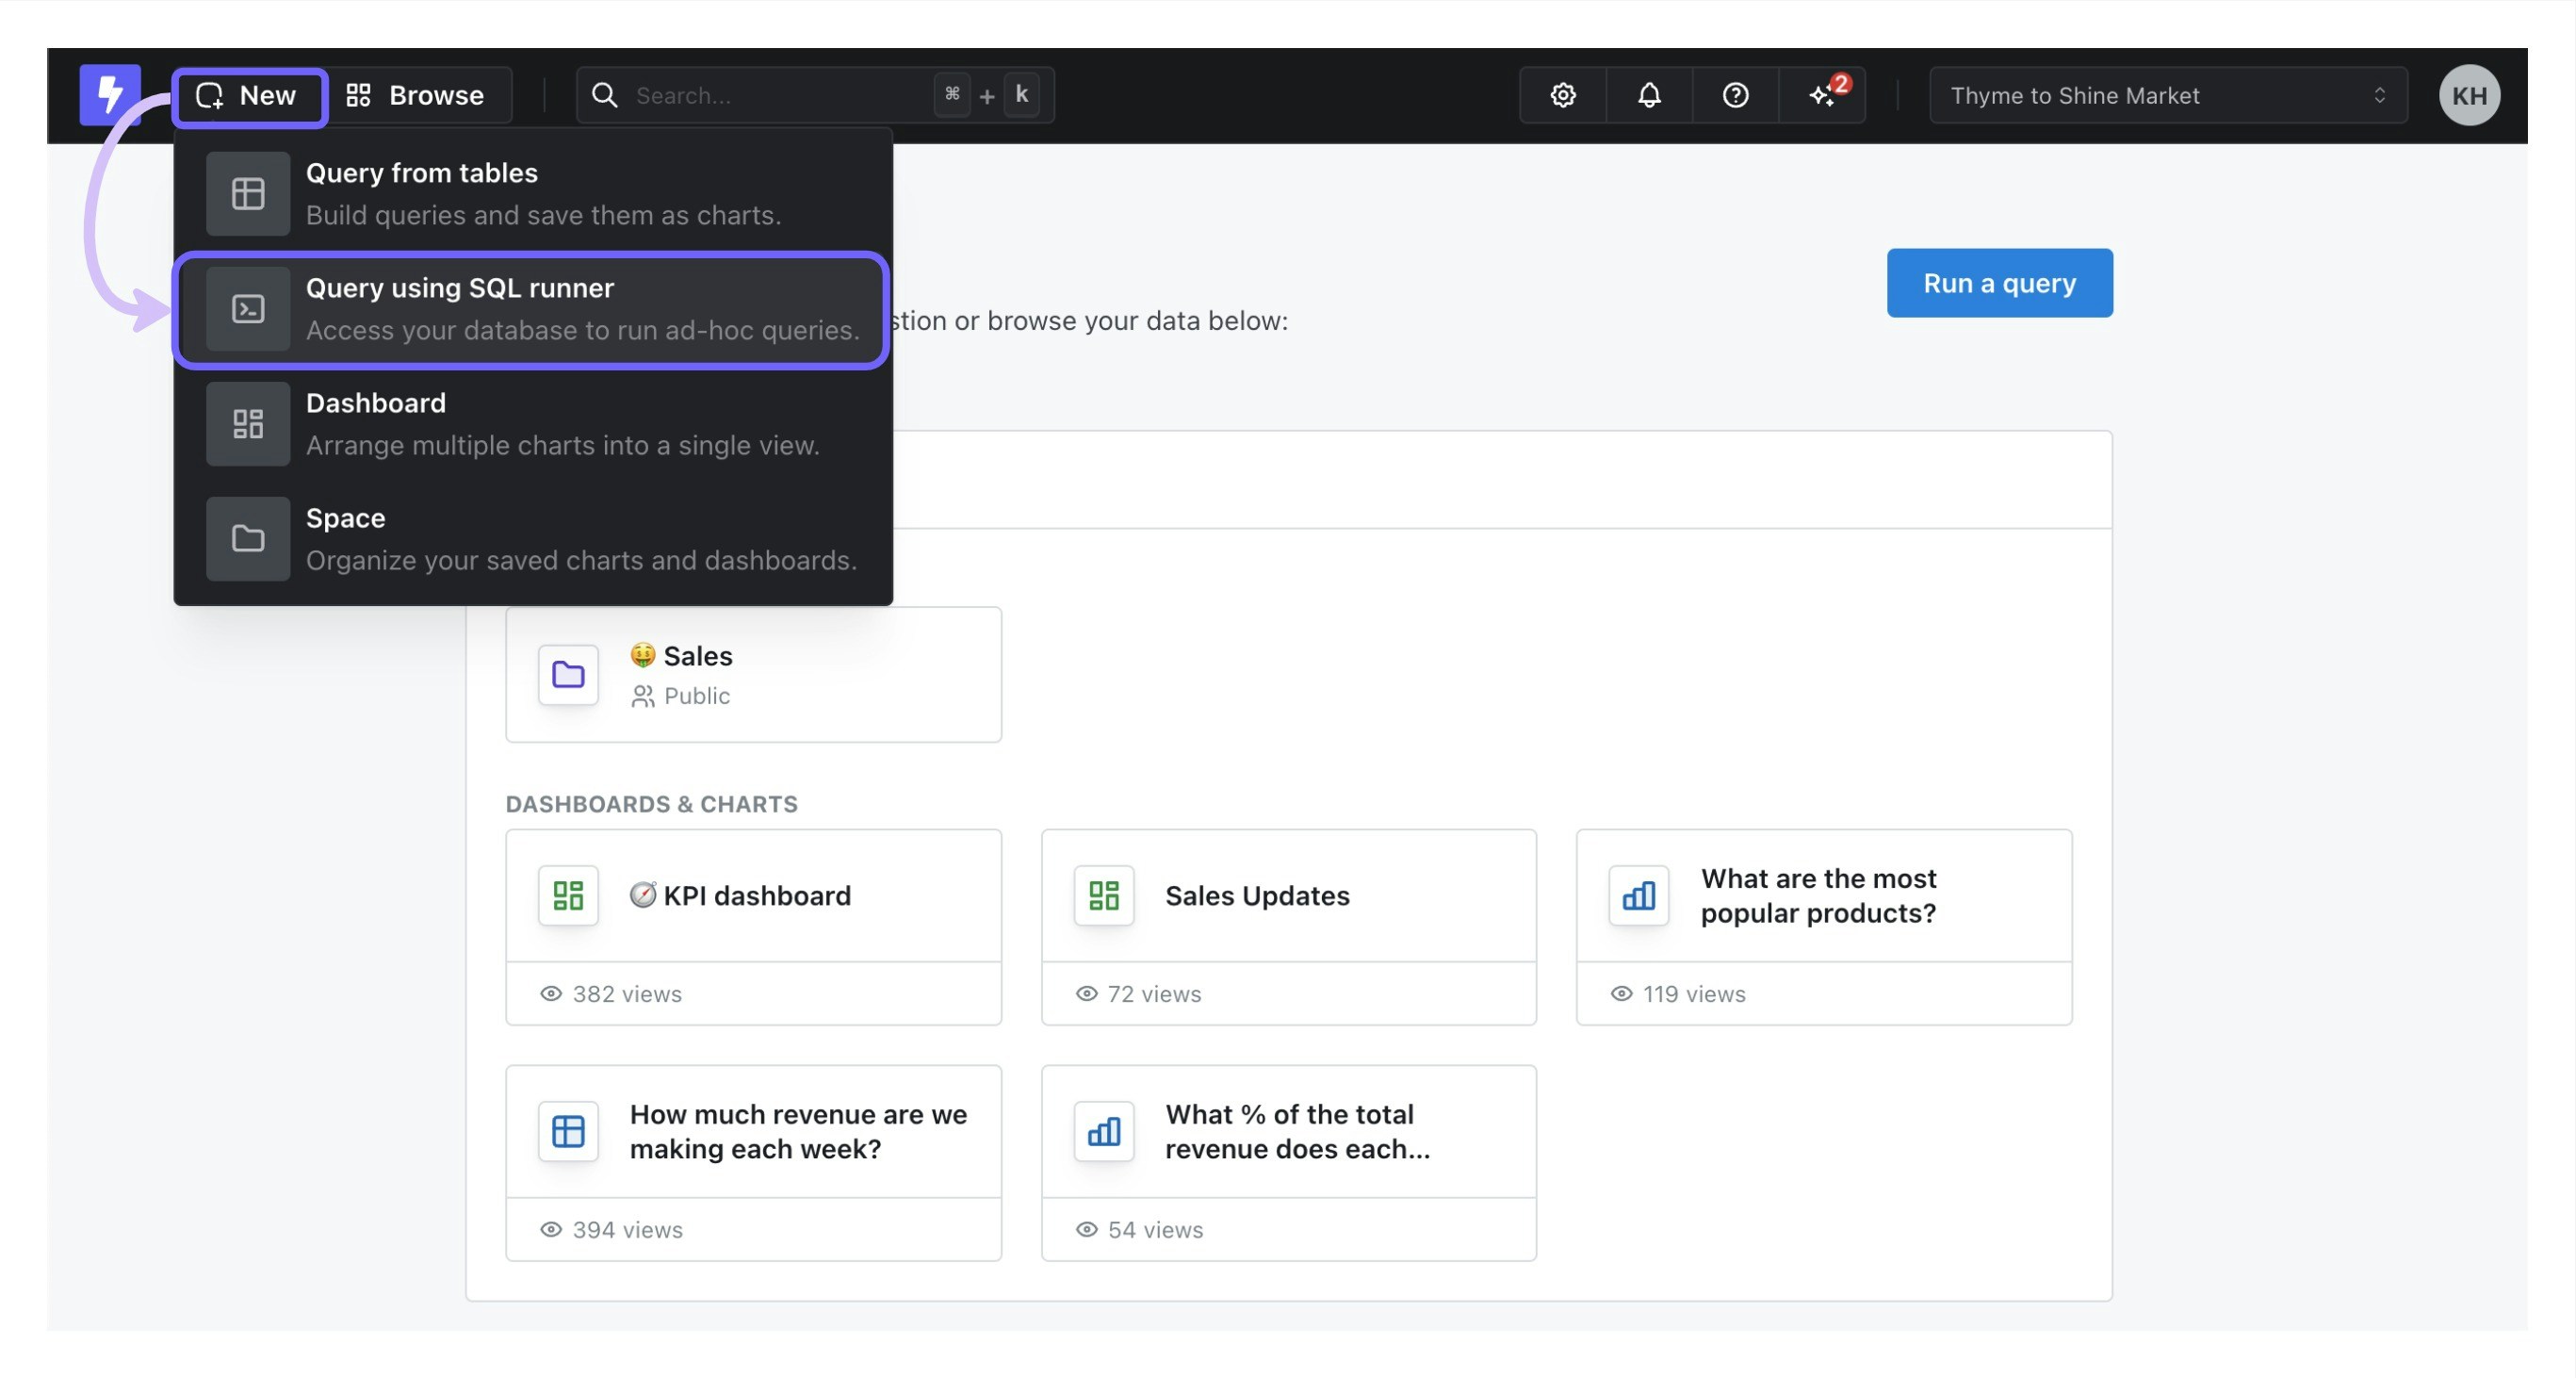
The SQL Runner can be accessed from theNew —> Query using SQL Runner option in your navigation bar.
- A list of tables in your data warehouse that Lightdash has access to (based on your data warehouse connection in Lightdash).
- The schema of a selected table.
- The SQL query builder.
- The results from your latest SQL query.
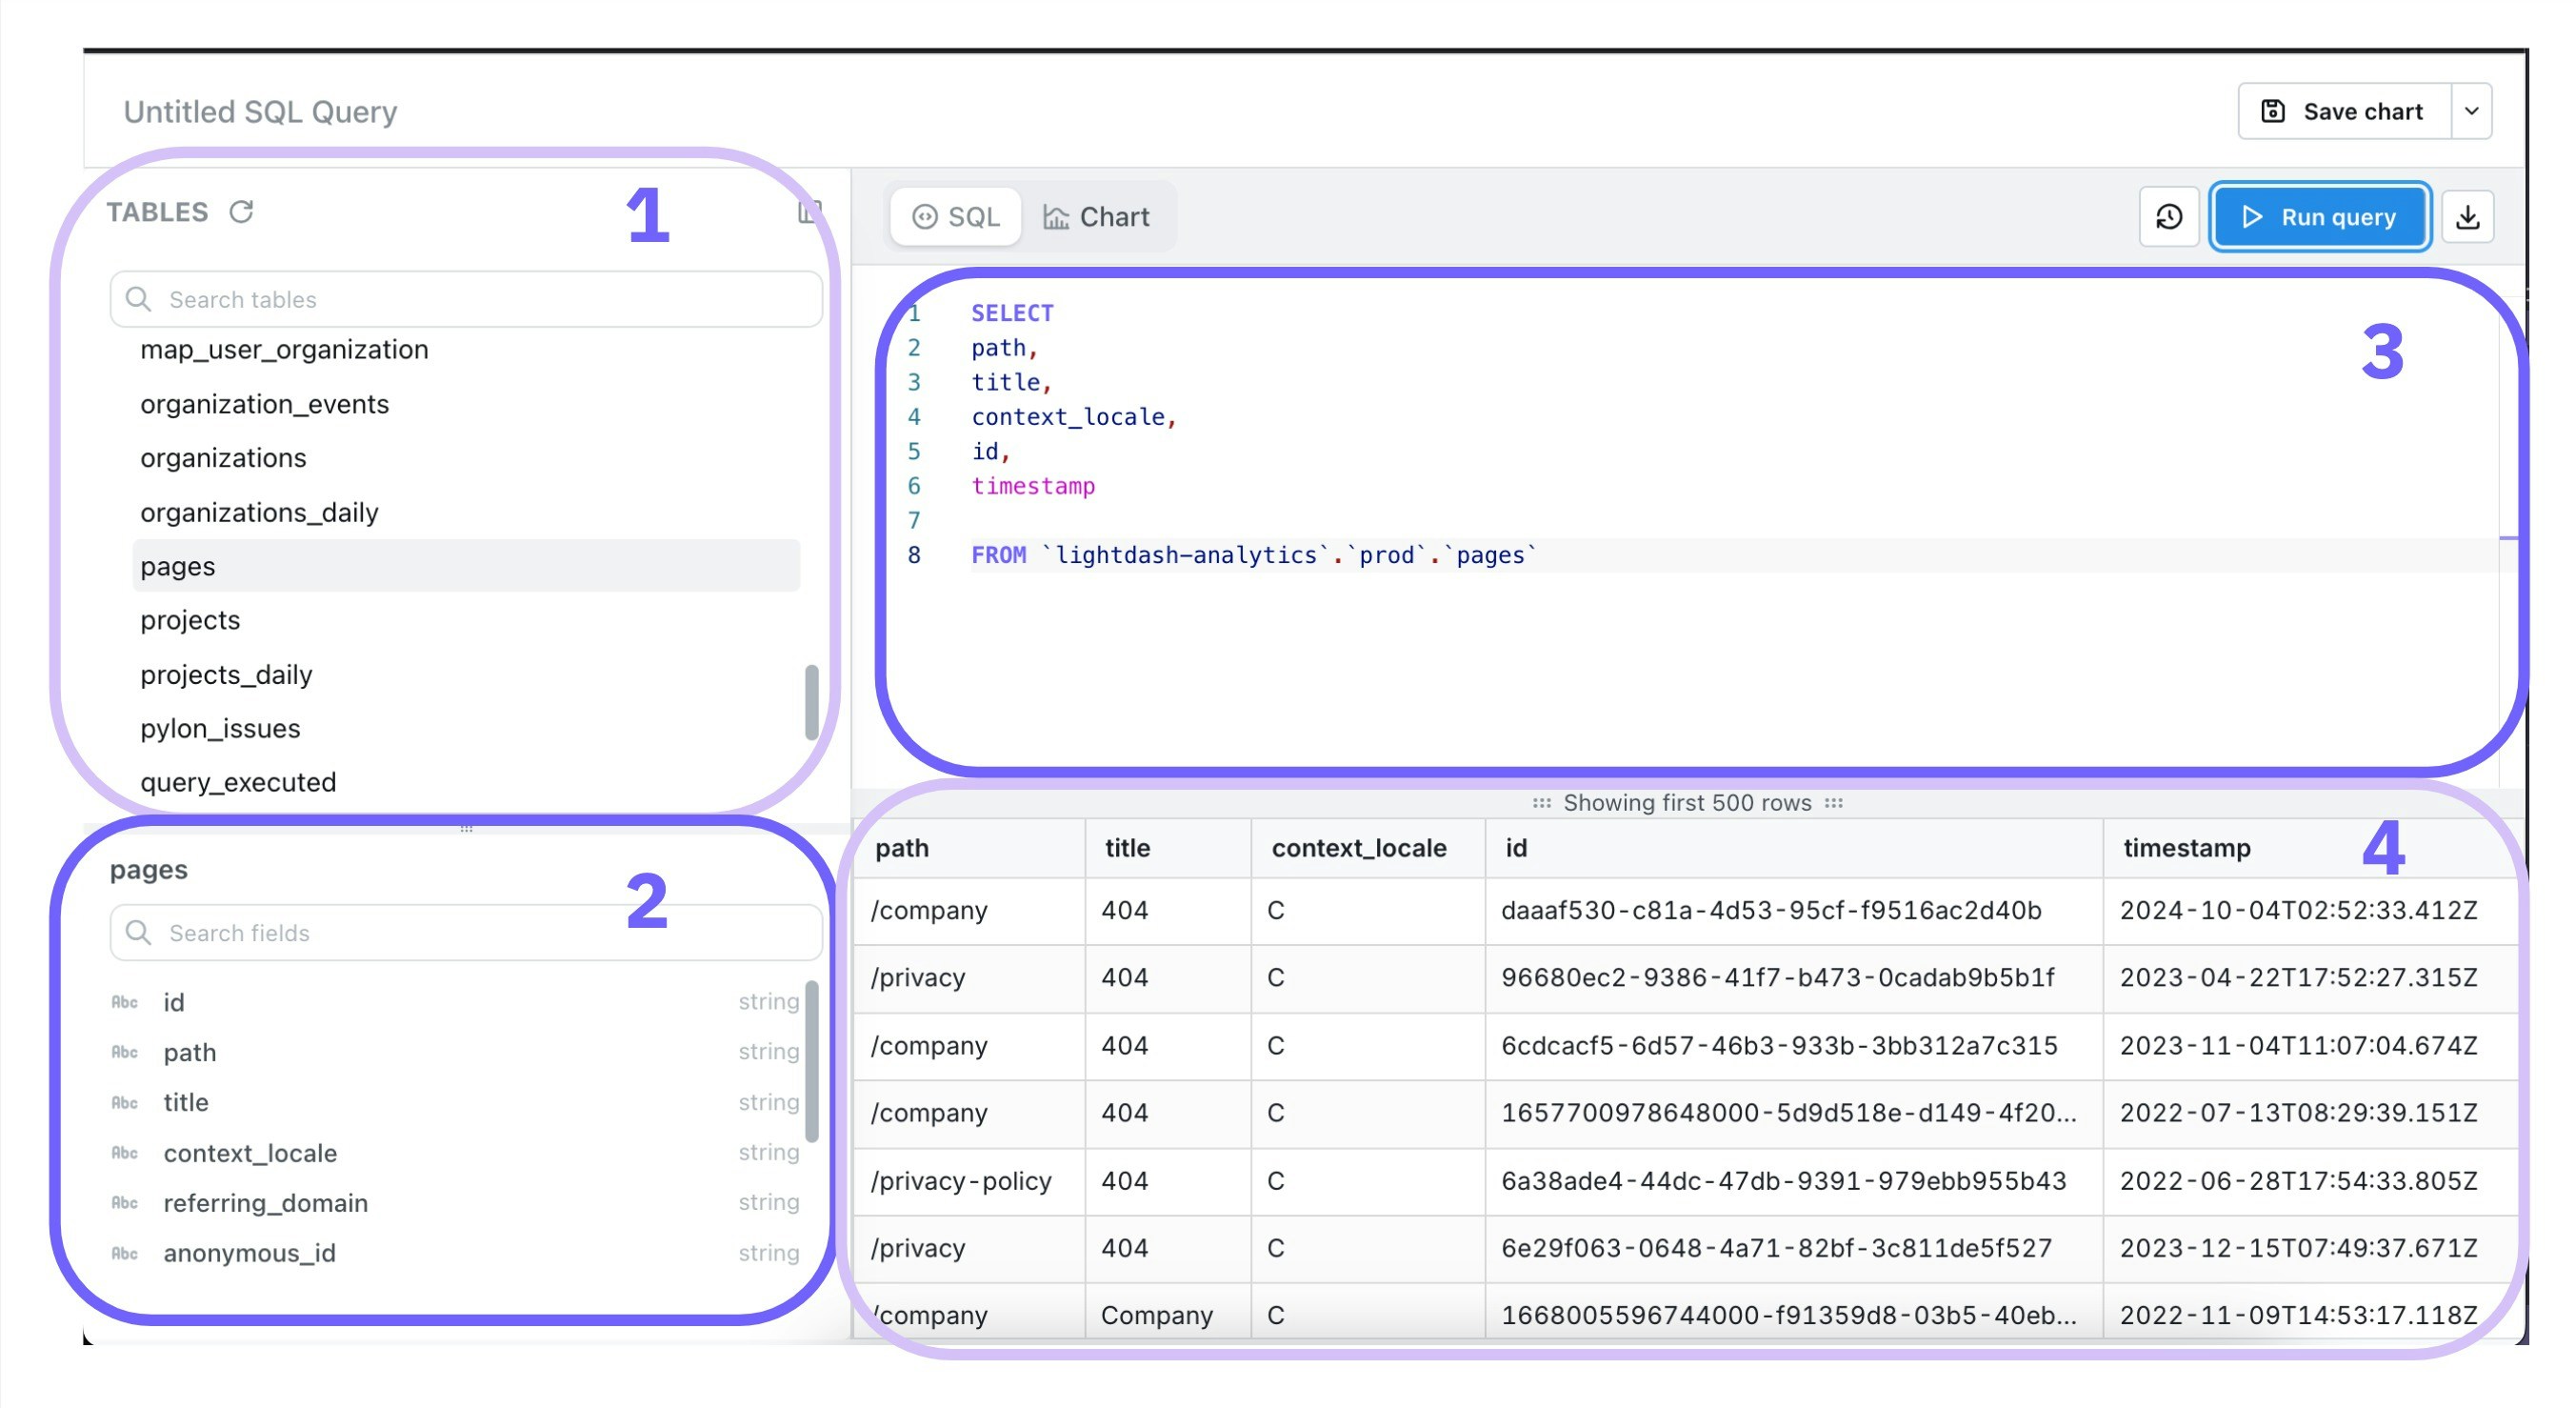
Run query to see the results.
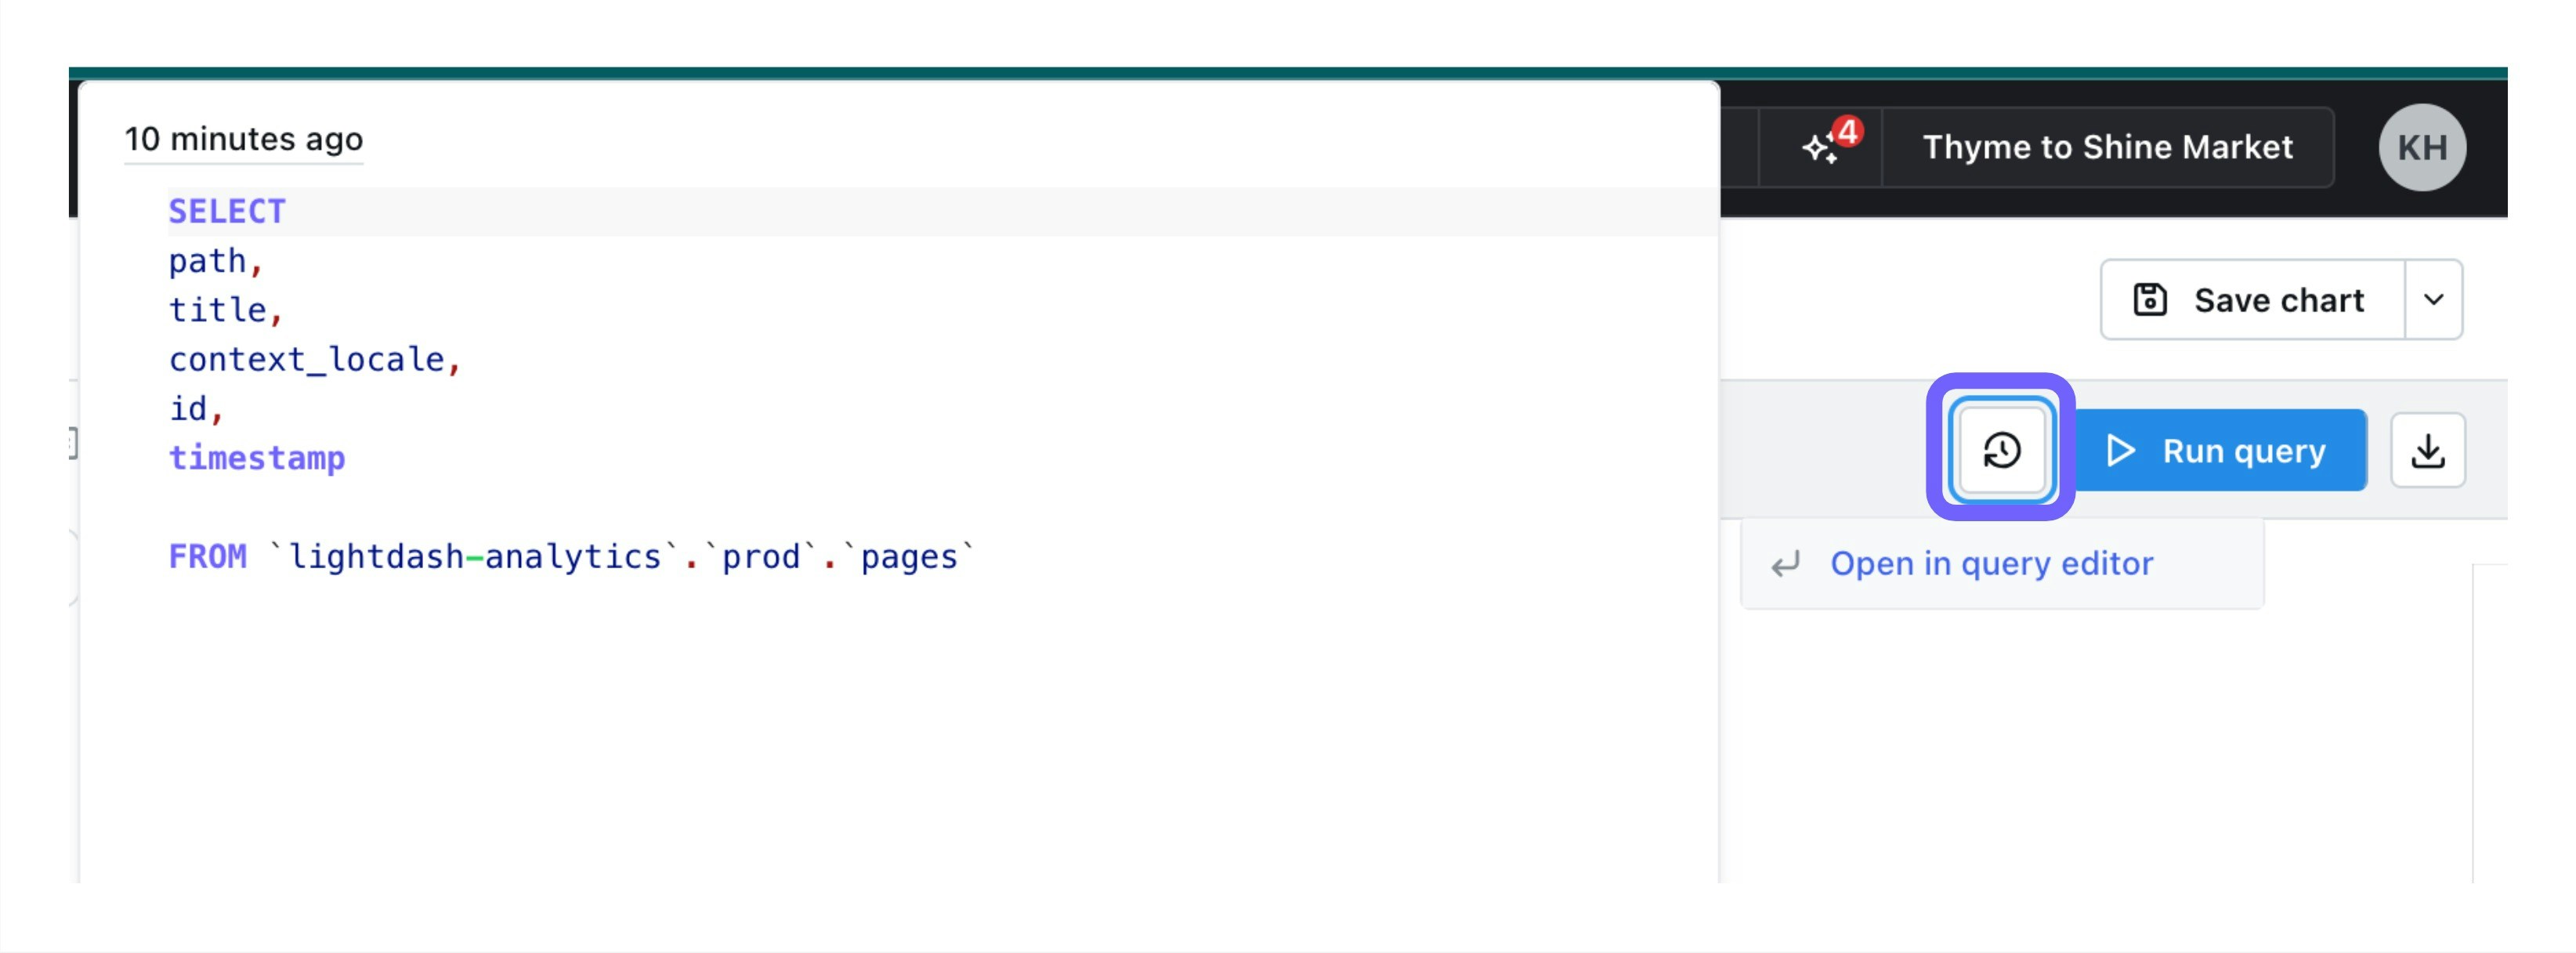
You can access your Query history from your session by clicking on the SQL Query history button beside Run query.
- Build and save a Chart
- Create a Virtual View so your query becomes a reusable table in Lightdash
- Write-back to dbt so your query is saved as a governed model.
- Click the link icon in the top-right to share your query draft with a coworker (or save it yourself to return to later).
Saved charts in the SQL Runner
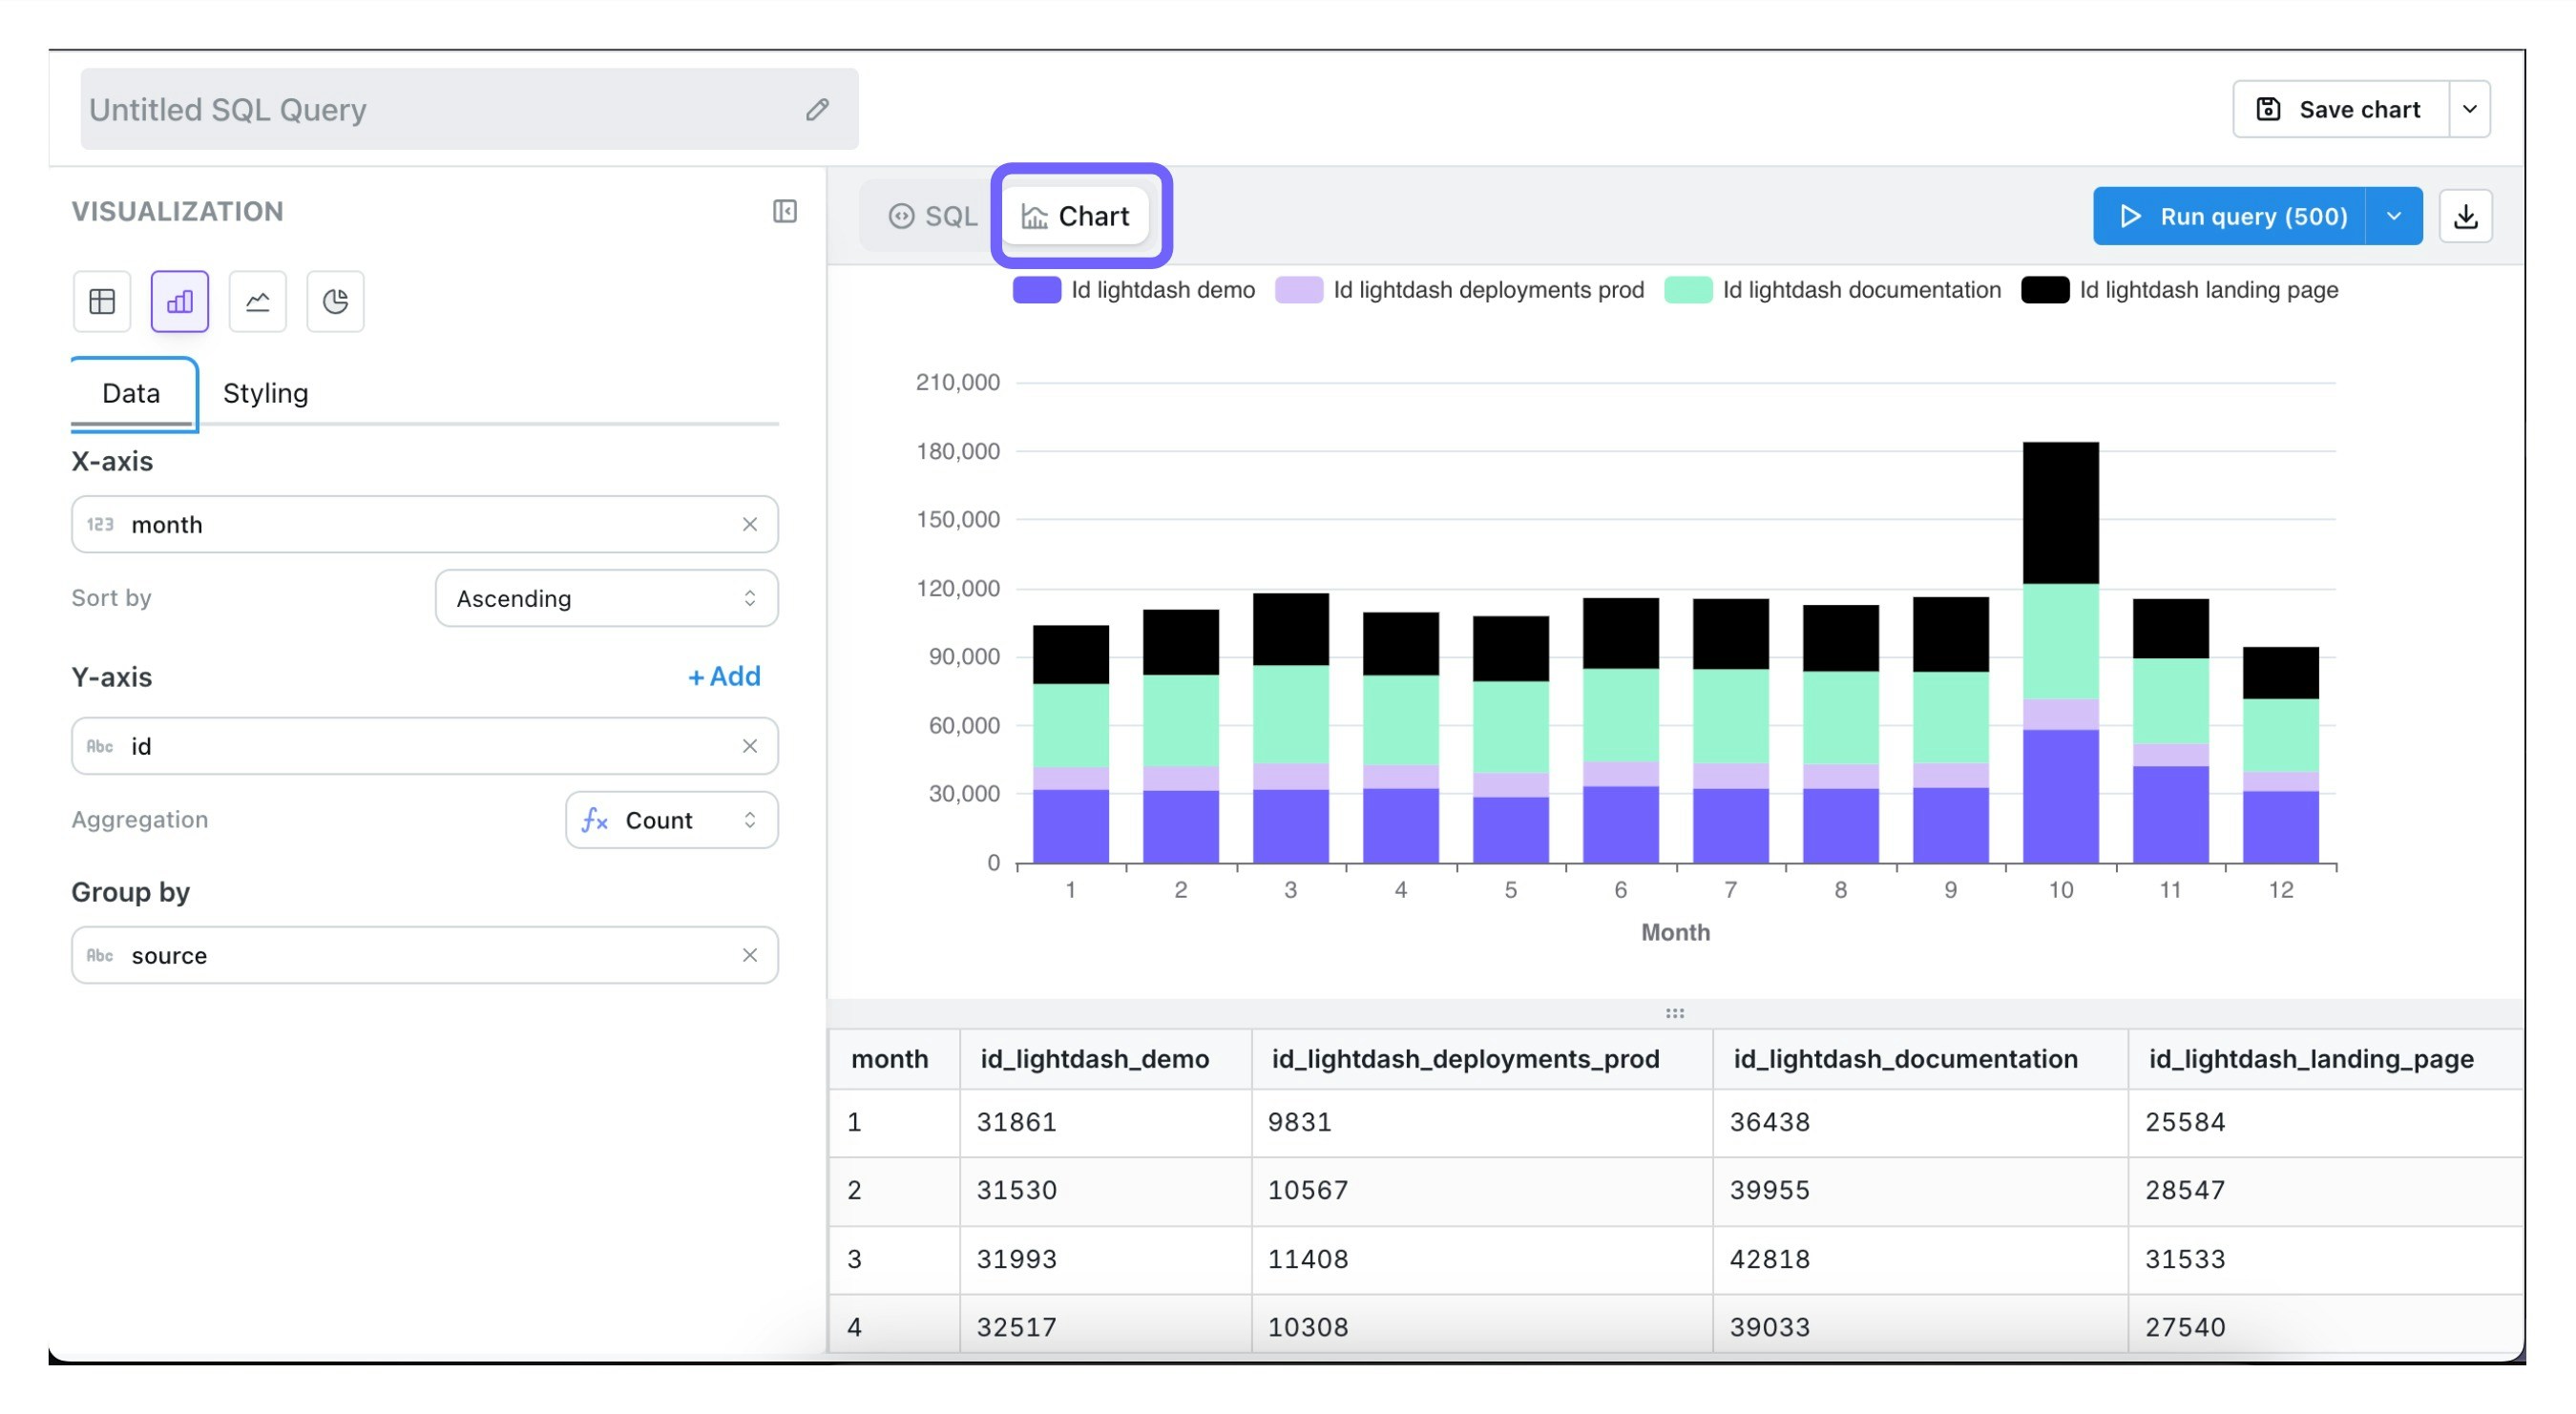
Once you’ve run your query, you can build a chart by clicking on thechart tab in the SQL Runner.
The charts in the SQL Runner are built from the data that you generated in your query. The chart builder automatically aggregates the data from your query results using the aggregation type that you choose. Depending on the column type, the aggregation options are:
- count (which is a distinct count and will ignore duplicates)
- any (which will count and include duplicates)
- sum
- average
- max
- min
save chart.
SQL runner charts on a dashbaord can be filtered in the UI. See the filter documentation for more information.
Limitations
ORDER BY not guaranteed
Results from the SQL runner are not guaranteed to respect yourORDER BY clause. This is because Lightdash wraps your query in a subquery to support dashboard filtering, and SQL databases don’t preserve ordering from subqueries.
Common symptoms: Results appear in wrong order, sorting doesn’t work, ORDER BY ignored, sort order not preserved.