What are metrics?
Metrics are used to perform calculations on your Tables. If dimensions segment your data into groups, metrics calculate interesting statistics for those groups. You can define metrics in your dbt project .yml files along with your dimensions and dbt model properties. For example, if we have a dimension,status, to split orders by their status, we may want to know the “Total number of orders” or the “Total sales” of the orders. These calculations are metrics:
- dbt v1.9 and earlier
- dbt v1.10+
- Lightdash YAML
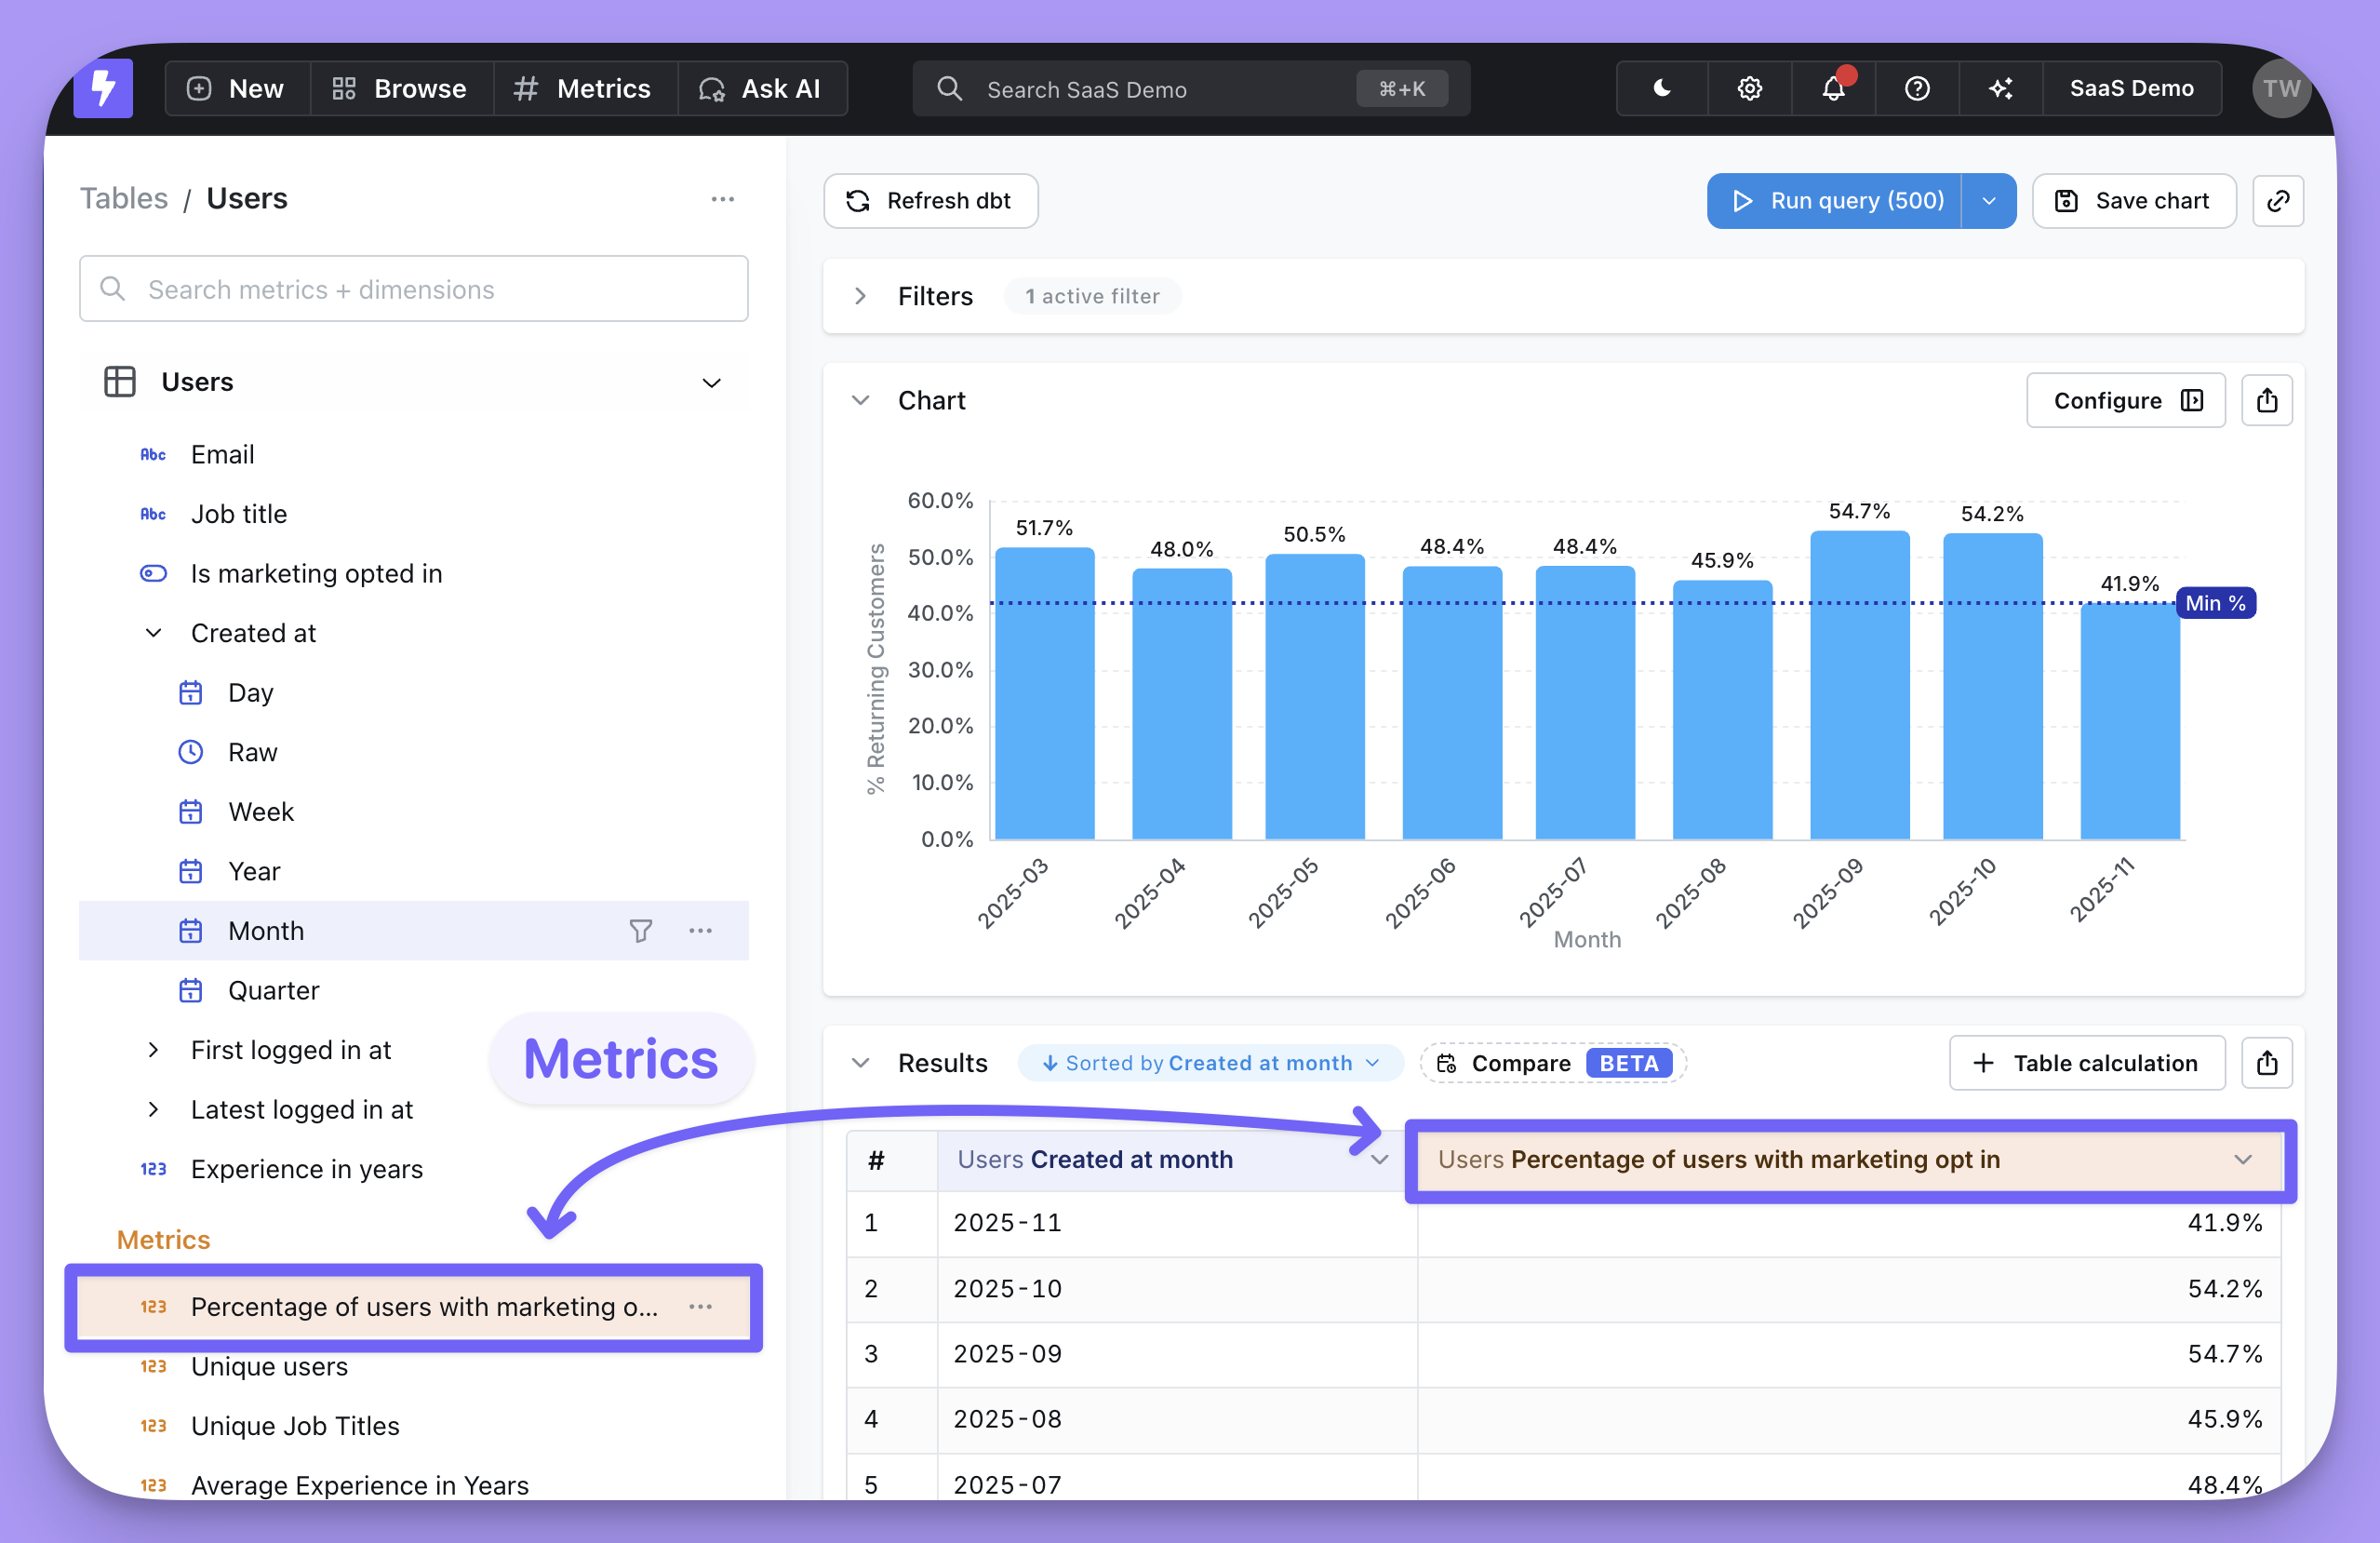
Let’s try adding a metric to our dbt project
This tutorial assumes you’ve set up the Lightdash CLI.If you haven’t installed the Lightdash CLI yet, then follow this guide to installing and setting it up.
Add a metric to one of your dbt models
Head to your dbt project, checkout a new branch (or just work onmain if that’s your style 🤠) and add a metric to one of your dbt models.
We’d suggest starting out simple, like a count for a primary key in your table.
For example:
- dbt v1.9 and earlier
- dbt v1.10+
- Lightdash YAML
Preview your changes using lightdash preview
Once you’ve added a metric to your dbt model, you might want to check to make sure that it’s working the way you’d expect. This is where lightdash preview comes in handy.
Developer previews are temporary Lightdash projects where you can safely experiment with your metrics, dimensions and charts without affecting your production project.
So, let’s spin up a developer preview and check out our changes. In your terminal, run the commands:
cmd + click to open the preview link from your terminal. Once you’re in Lightdash go to Explore —> Tables, then click on the model you just updated to see your new metric and play around with it.
Configure your metric (optional)
You can jazz up your metrics by configuring them in your .yml files. These metric configurations live under themeta tag of your columns, under metrics:
- dbt v1.9 and earlier
- dbt v1.10+
- Lightdash YAML
If you’re happy with your new metric, you can deploy it to production.
If you’re working with a version controlled project, you’ll just want to make sure to merge your changes into the branch you’ve connected to your Lightdash project (e.g.main or master).
Once they’ve been merged or if you’re just working off of main (rebel 😏), you can deploy your changes.
Once you’ve merged your changes, you’ll want to deploy them to production. To do this, just run these commands in your terminal from your dbt project:
Lightdash’s deploy command will deploy using your default dbt target unless you specify to use a different target.For example, if you’ve set up a developer profile where it targets a dev dataset (like
dbt_khindson.my_model_names), then you’ll need to pass the production target in your lightdash deploy command. Something like: lightdash deploy --target prod.Adding custom metrics in the Explore view
The fields that you see in yourdimensions and metrics are created by the people maintaining your Lightdash project.
But, if there’s something missing from this list of metrics, you can use custom metrics to add some on-the-fly calculations while you’re exploring.
To read more about custom metrics, take a look at how to create custom fields.