
What are dimensions?
Lightdash dimensions are columns that have been defined in your dbt project’s .yml files. Basically, they’re just the fields from your data models in dbt. For example, the following dbt project file contains properties that create a single dimension,source, for the Pages Table in Lightdash:
source and the type will be inferred from the column in your database. You can see the full list of dimension types supported in Lightdash here.
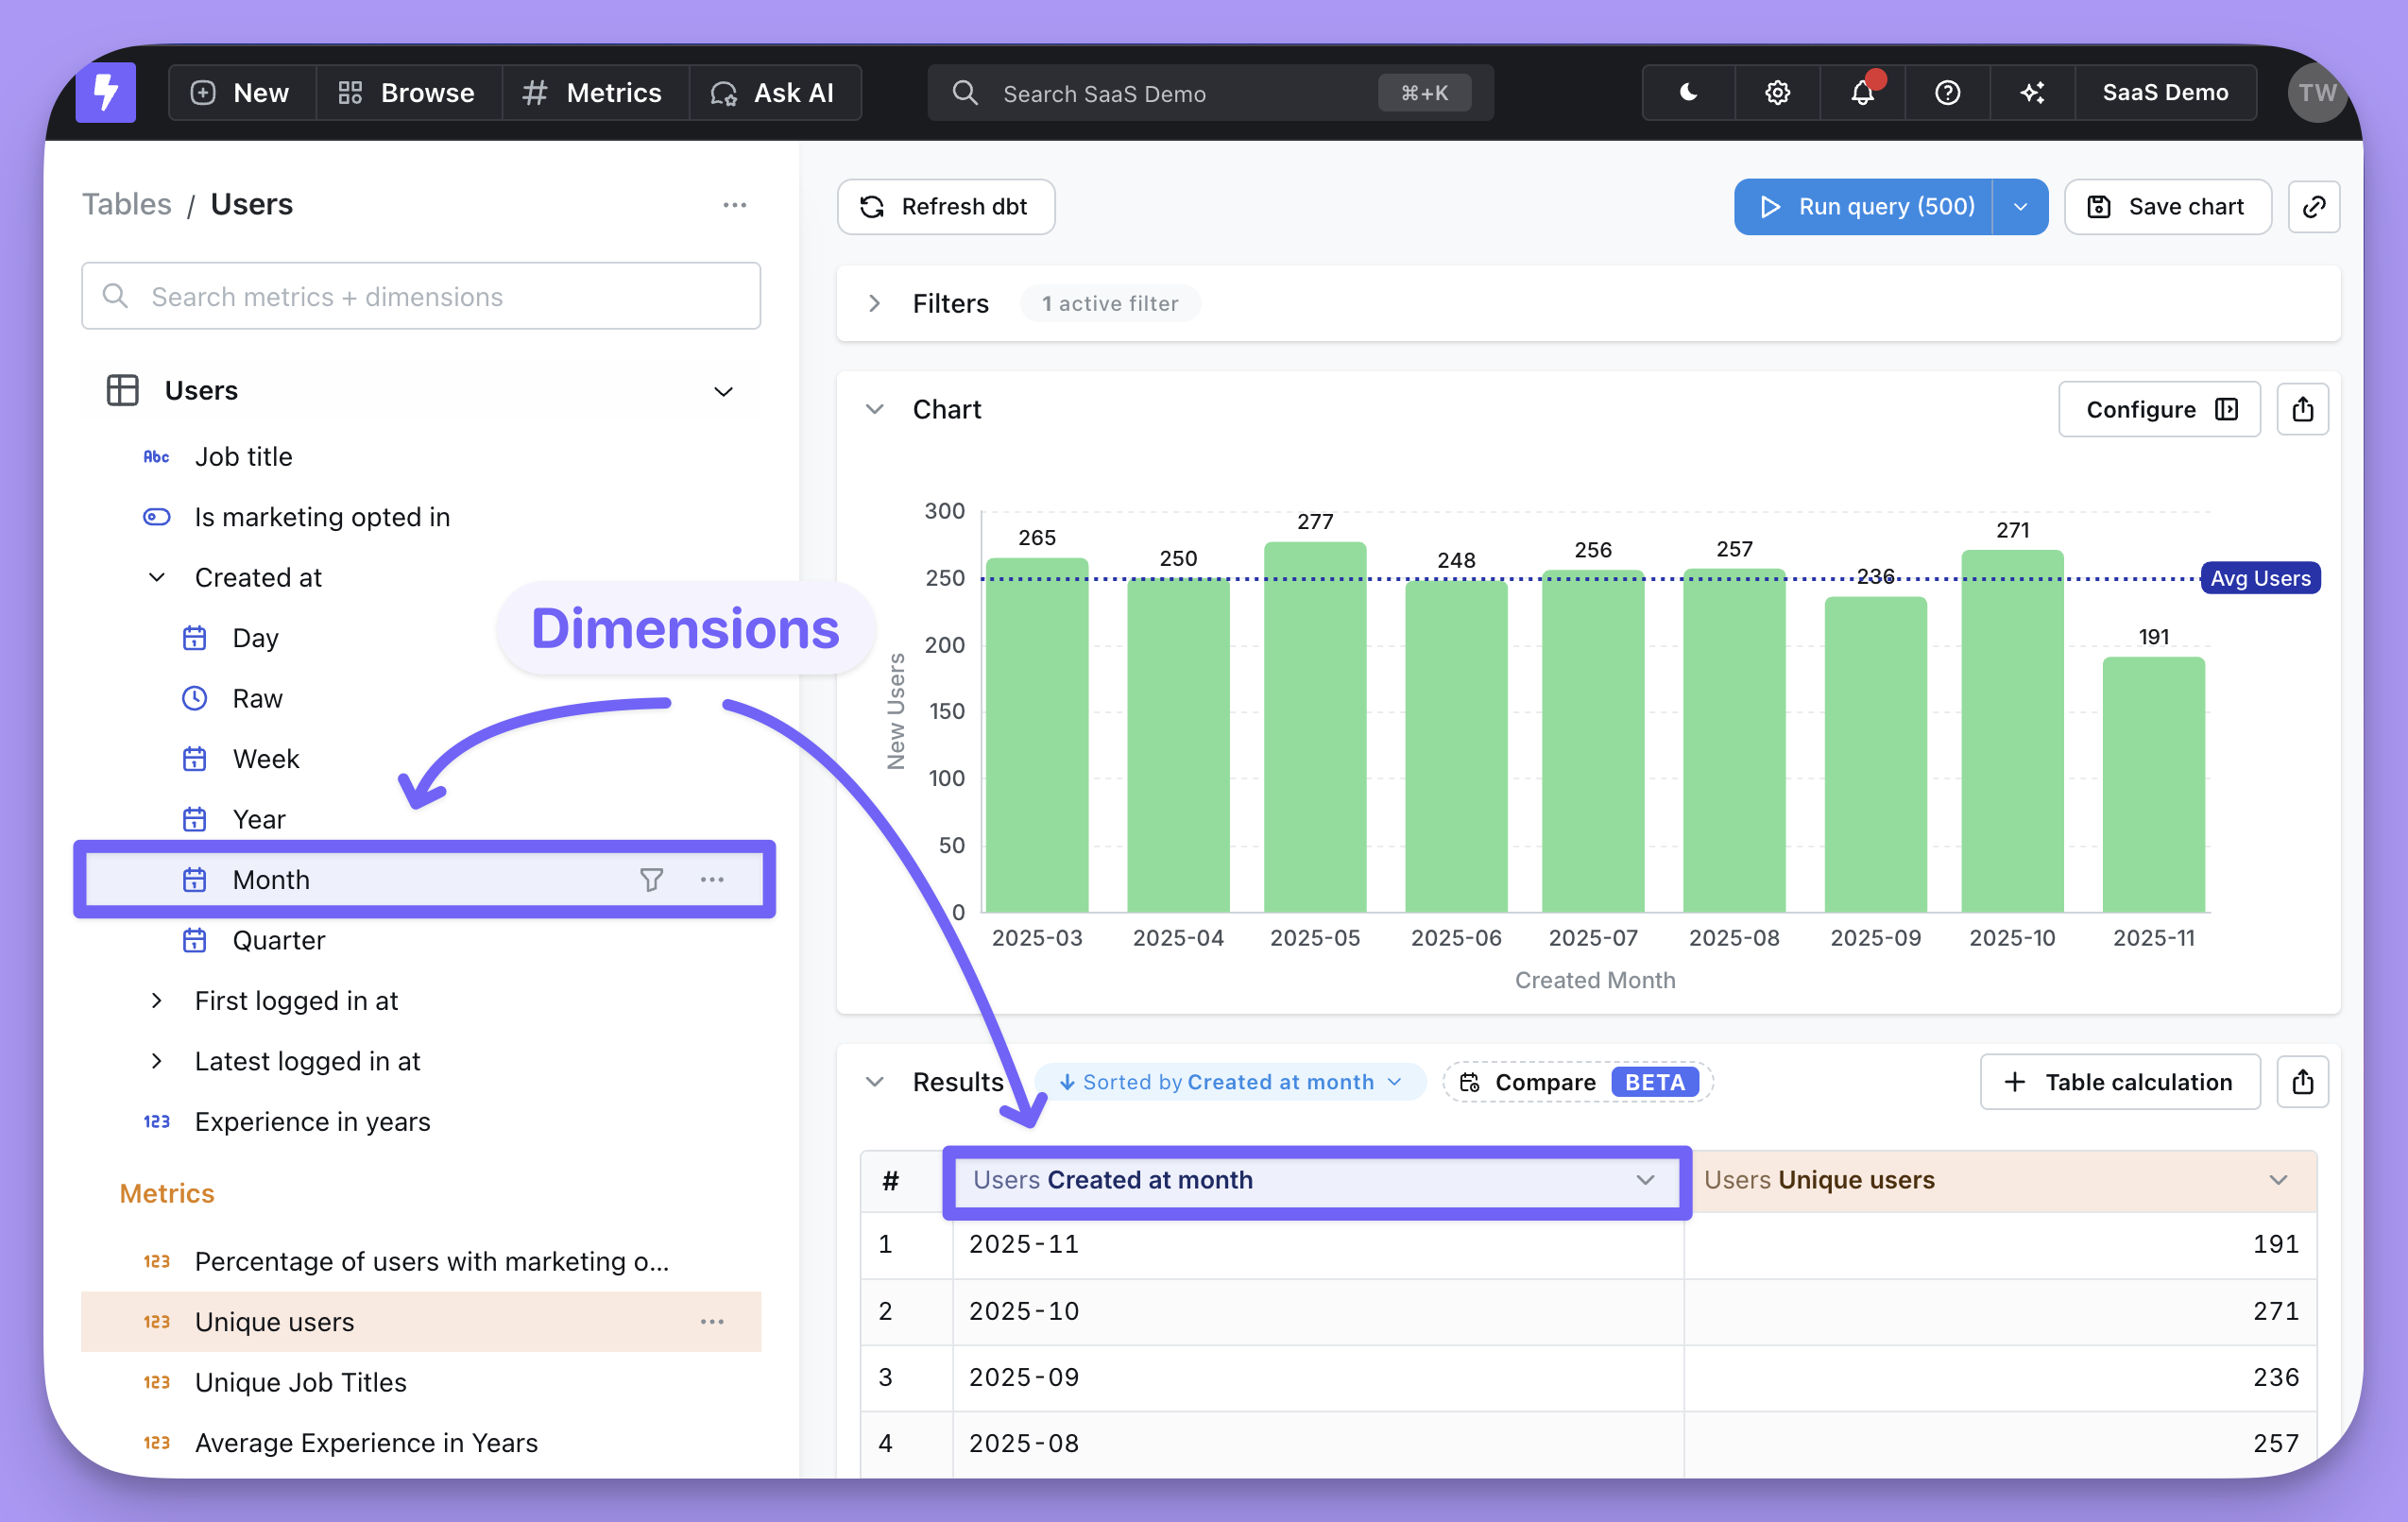
Once you’ve added your dimensions, you can use them in Lightdash to build charts and filter results. Dimensions appear in the Explore view, above metrics and, if selected, pop us as blue fields in your results table.
Create dimensions using the CLI or manually.
Option 1: CLI
This tutorial assumes you’ve set up the Lightdash CLI.If you haven’t installed the Lightdash CLI yet, then follow this guide to installing and setting it up.
Option 2: Manually
We recommend using the CLI because it’s faster and more reliable. But, if you’re keen to do some manual documenting, then you can just add columns to your dbt .yml files and they will appear as dimensions in Lightdash. For example, if I had a column in my dbt model calledsource and I wanted to add it as a dimension to Lightdash, I would just add the column to my .yml file like so:
- dbt v1.9 and earlier
- dbt v1.10+ and Fusion
- Lightdash YAML
Preview your changes using lightdash preview
Once you’ve added a dimension to your dbt model, you might want to check to make sure that it’s working the way you’d expect. This is where lightdash preview comes in handy.
Developer previews are temporary Lightdash projects where you can safely experiment with your metrics, dimensions and charts without affecting your production project.
So, let’s spin up a developer preview and check out our changes. In your terminal, run the commands:
cmd + click to open the preview link from your terminal. Once you’re in Lightdash go to Explore —> Tables, then click on the model you just updated to see your test column and play around with it.
Configure your dimensions
You can jazz up your dimensions by configuring them in your .yml files. These dimension configurations live under themeta tag of your columns, under dimension:
- dbt v1.9 and earlier
- dbt v1.10+ and Fusion
- Lightdash YAML
Deploy your changes to production
There are two ways to do this:Option 1: Deploy your changes using the CLI
If you’re working with a version controlled project, you’ll just want to make sure to merge your changes into the branch you’ve connected to your Lightdash project (e.g.main or master). You’ll also want to make sure that you’ve run your dbt models so that your new columns exist in your data warehouse.
Once they’ve been merged or if you’re just working off of main (rebel 😏), you can deploy your changes. Just run these commands in your terminal from your dbt project:
Lightdash’s deploy command will deploy using your default dbt target unless you specify to use a different target.For example, if you’ve set up a developer profile where it targets a dev dataset (like
dbt_khindson.my_model_names), then you’ll need to pass the production target in your lightdash deploy command. Something like: lightdash deploy --target prod.Option 2: Deploy your changes manually
If you’re working with a version controlled project, you’ll just want to make sure to merge your changes into the branch you’ve connected to your Lightdash project (e.g.main or master). You’ll also want to make sure that you’ve run your dbt models so that your new columns exist in your data warehouse.
Once they’ve been merged or if you’re just working off of main (rebel 😏), you can deploy your changes.
To do this, you just need to hit refresh dbt on the Explore View page in your project. Then, the new dimensions should appear for everyone in your project, automatically.