

LAG, RANK, RUNNING_TOTAL, and MOVING_AVG, and the row functions and pivot functions cover previous rows and pivot columns.
Each template is a window function over your results table. Swap the ${table.column_...} placeholders for your own fields, using the ${table_name.field_name} format or autocomplete.
The ORDER BY columns in a template should match the dimensions and sort order of your results table. Add every dimension in the results table, in the same order, so each row compares against the row directly above it. Columns sort ascending by default; add DESC to sort descending.
For the percent templates, set the table calculation’s format to Percent in the Format tab so the result shows as a percentage instead of a ratio.
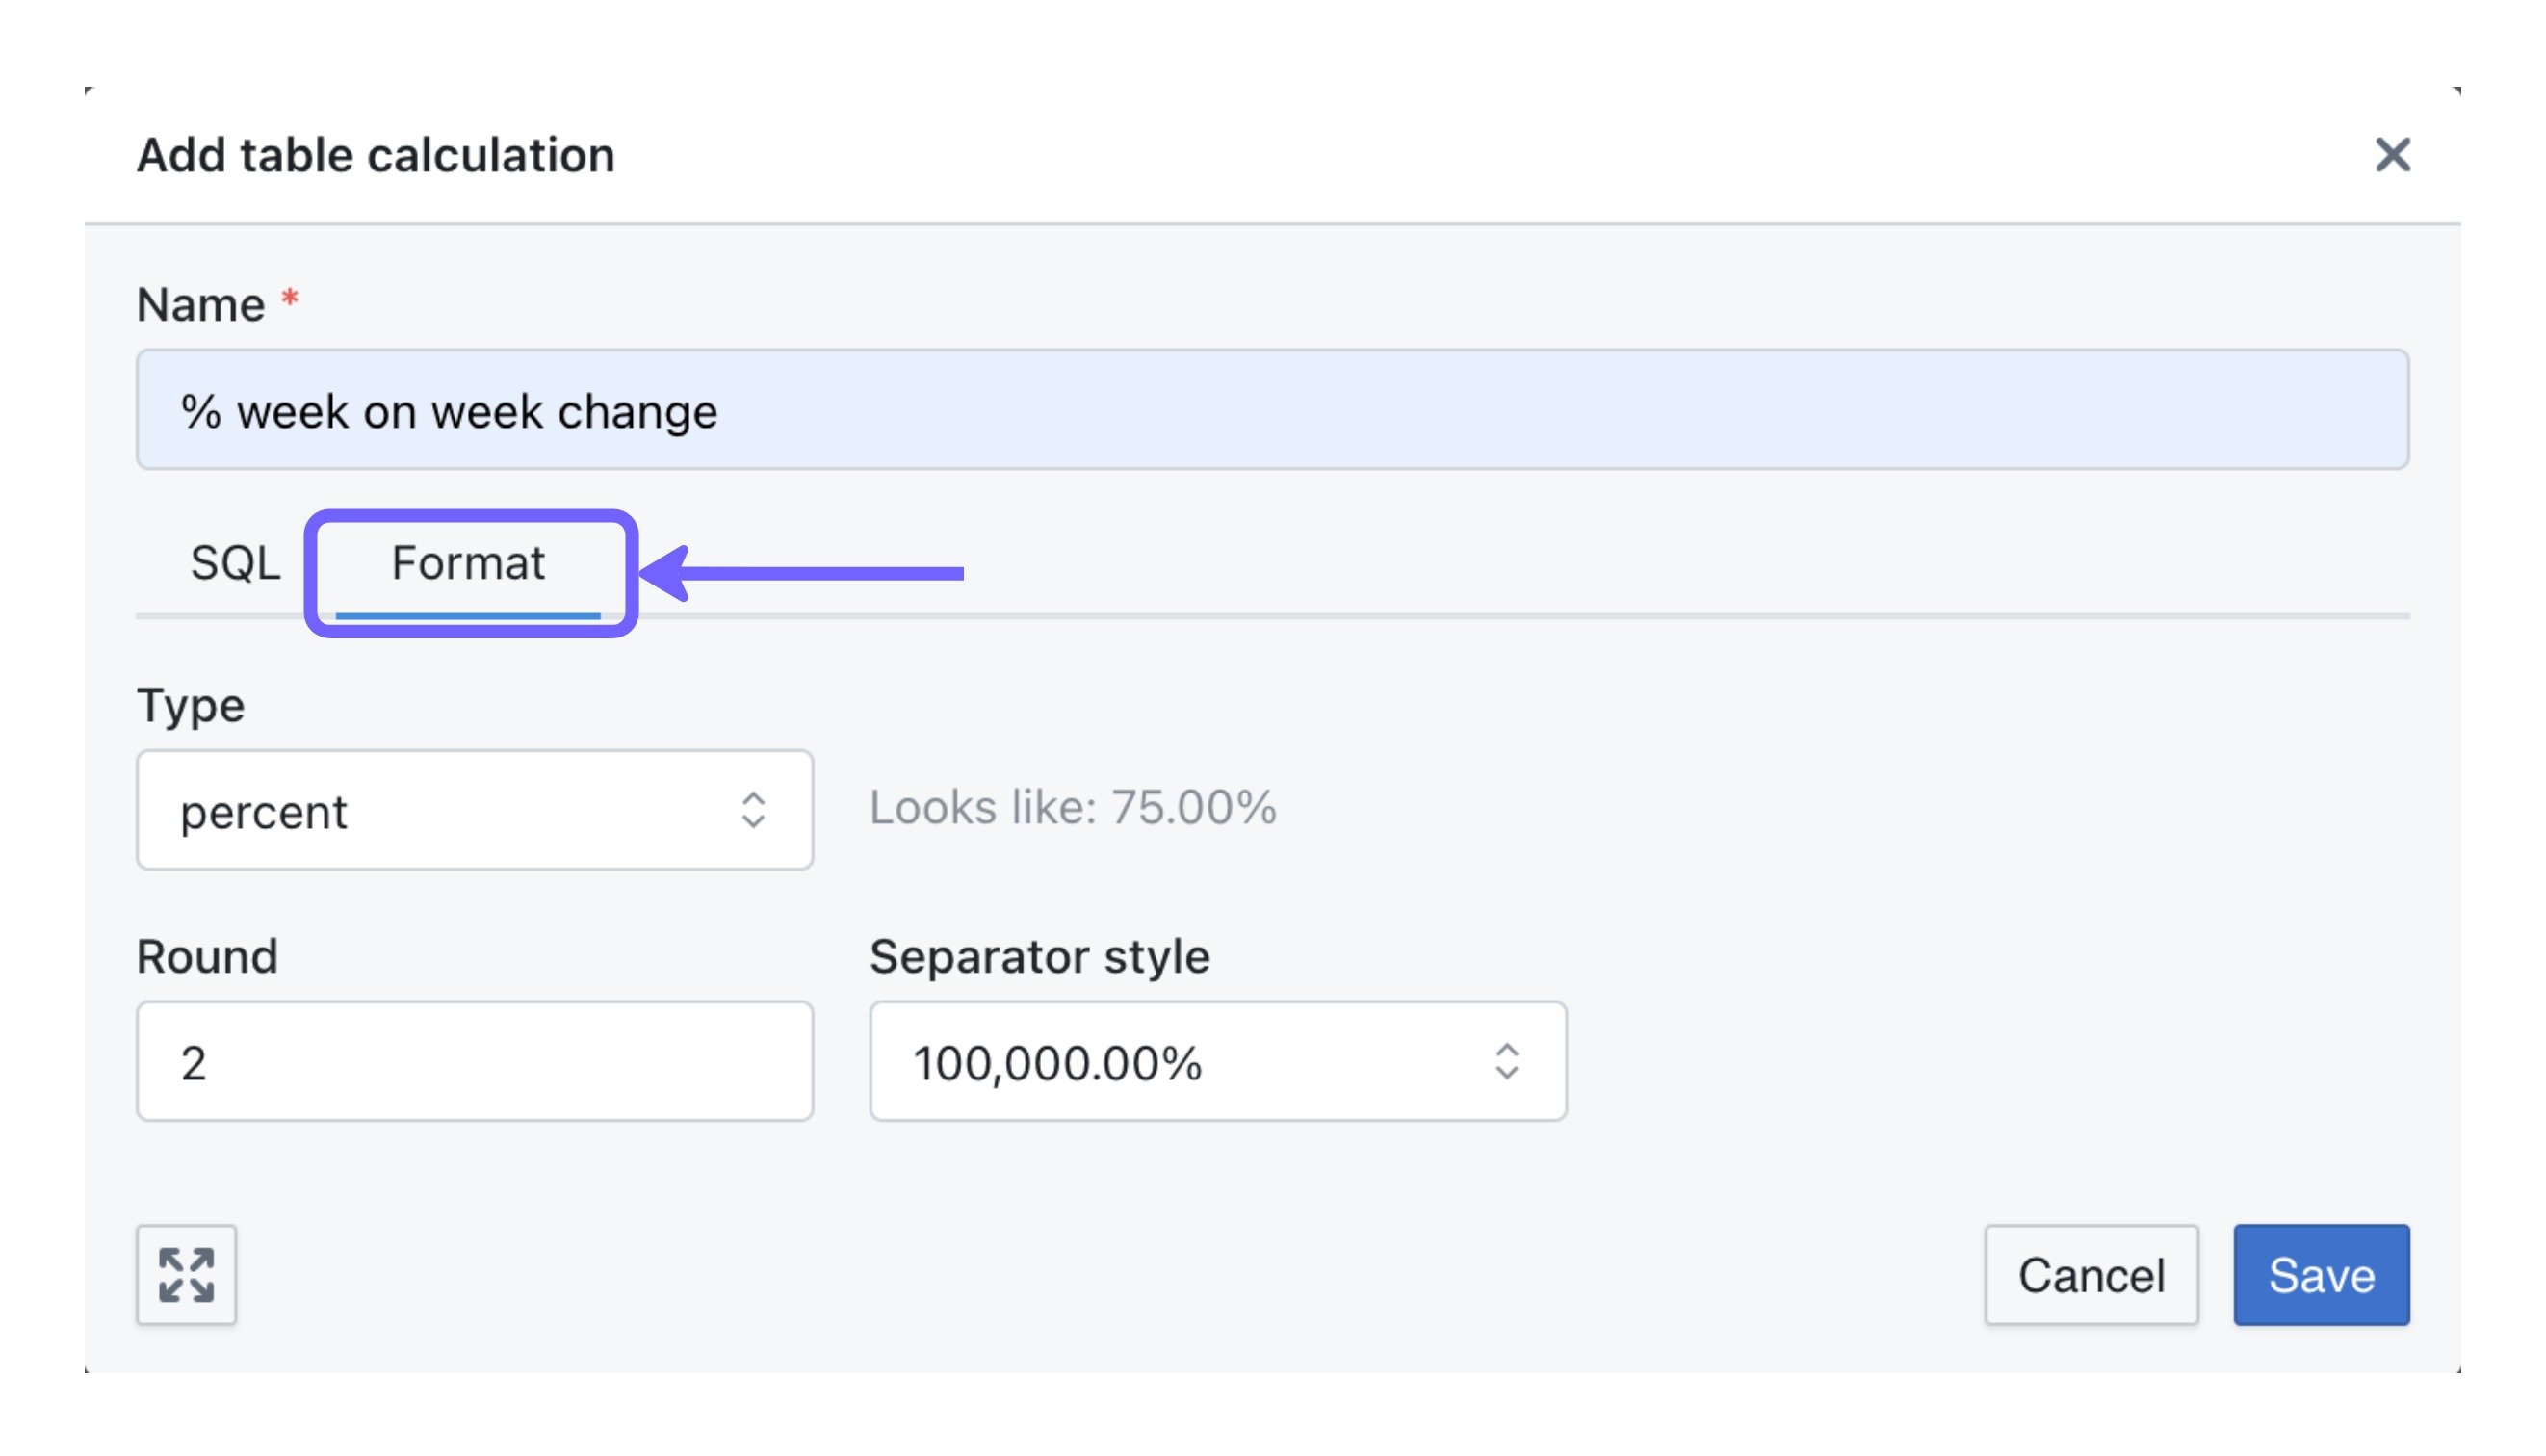
Percent change from previous
Divides each value by the value in the row above it, usingLAG ordered by your results table’s dimensions, then subtracts 1. The first row has no previous value, so it returns NULL.
orders.country as the row dimension and orders.order_date_month as the pivot:
LAG(${orders.total_revenue}, 12). LAG counts rows, not months, so a month with no row for that country shifts the comparison.
Percent of previous value
Divides each value by the value in the row above it, usingLAG ordered by your results table’s dimensions. The first row returns NULL.
Percent of column total
Divides each value by the sum of the whole column. The emptyOVER() makes the window every row in the results table.
Percent of group total
Divides each value by the sum of its group.PARTITION BY splits the rows into groups by column_i_want_to_group_by, such as a month or a pivot dimension, and the sum restarts for each group.
Rank in column
Numbers the rows by the column you want to rank.DESC gives the largest value rank 1; ASC gives the smallest value rank 1. To rank within groups, add a PARTITION BY clause before ORDER BY.
Running total
Sums each value with every value above it. The window runs from the first row (UNBOUNDED PRECEDING) to the current row, in the order of your results table’s dimensions.
Rolling window
Sums the current row and theN rows before it, so a four-week window uses N = 3. Dividing one rolling sum by a second rolling sum gives a rolling average or ratio; drop the second SUM for a plain rolling total. Replace N with a number before you run it.