Update your project connection
To setup your Lightdash connection you’ll need to:
Open up your Lightdash instance to get started.
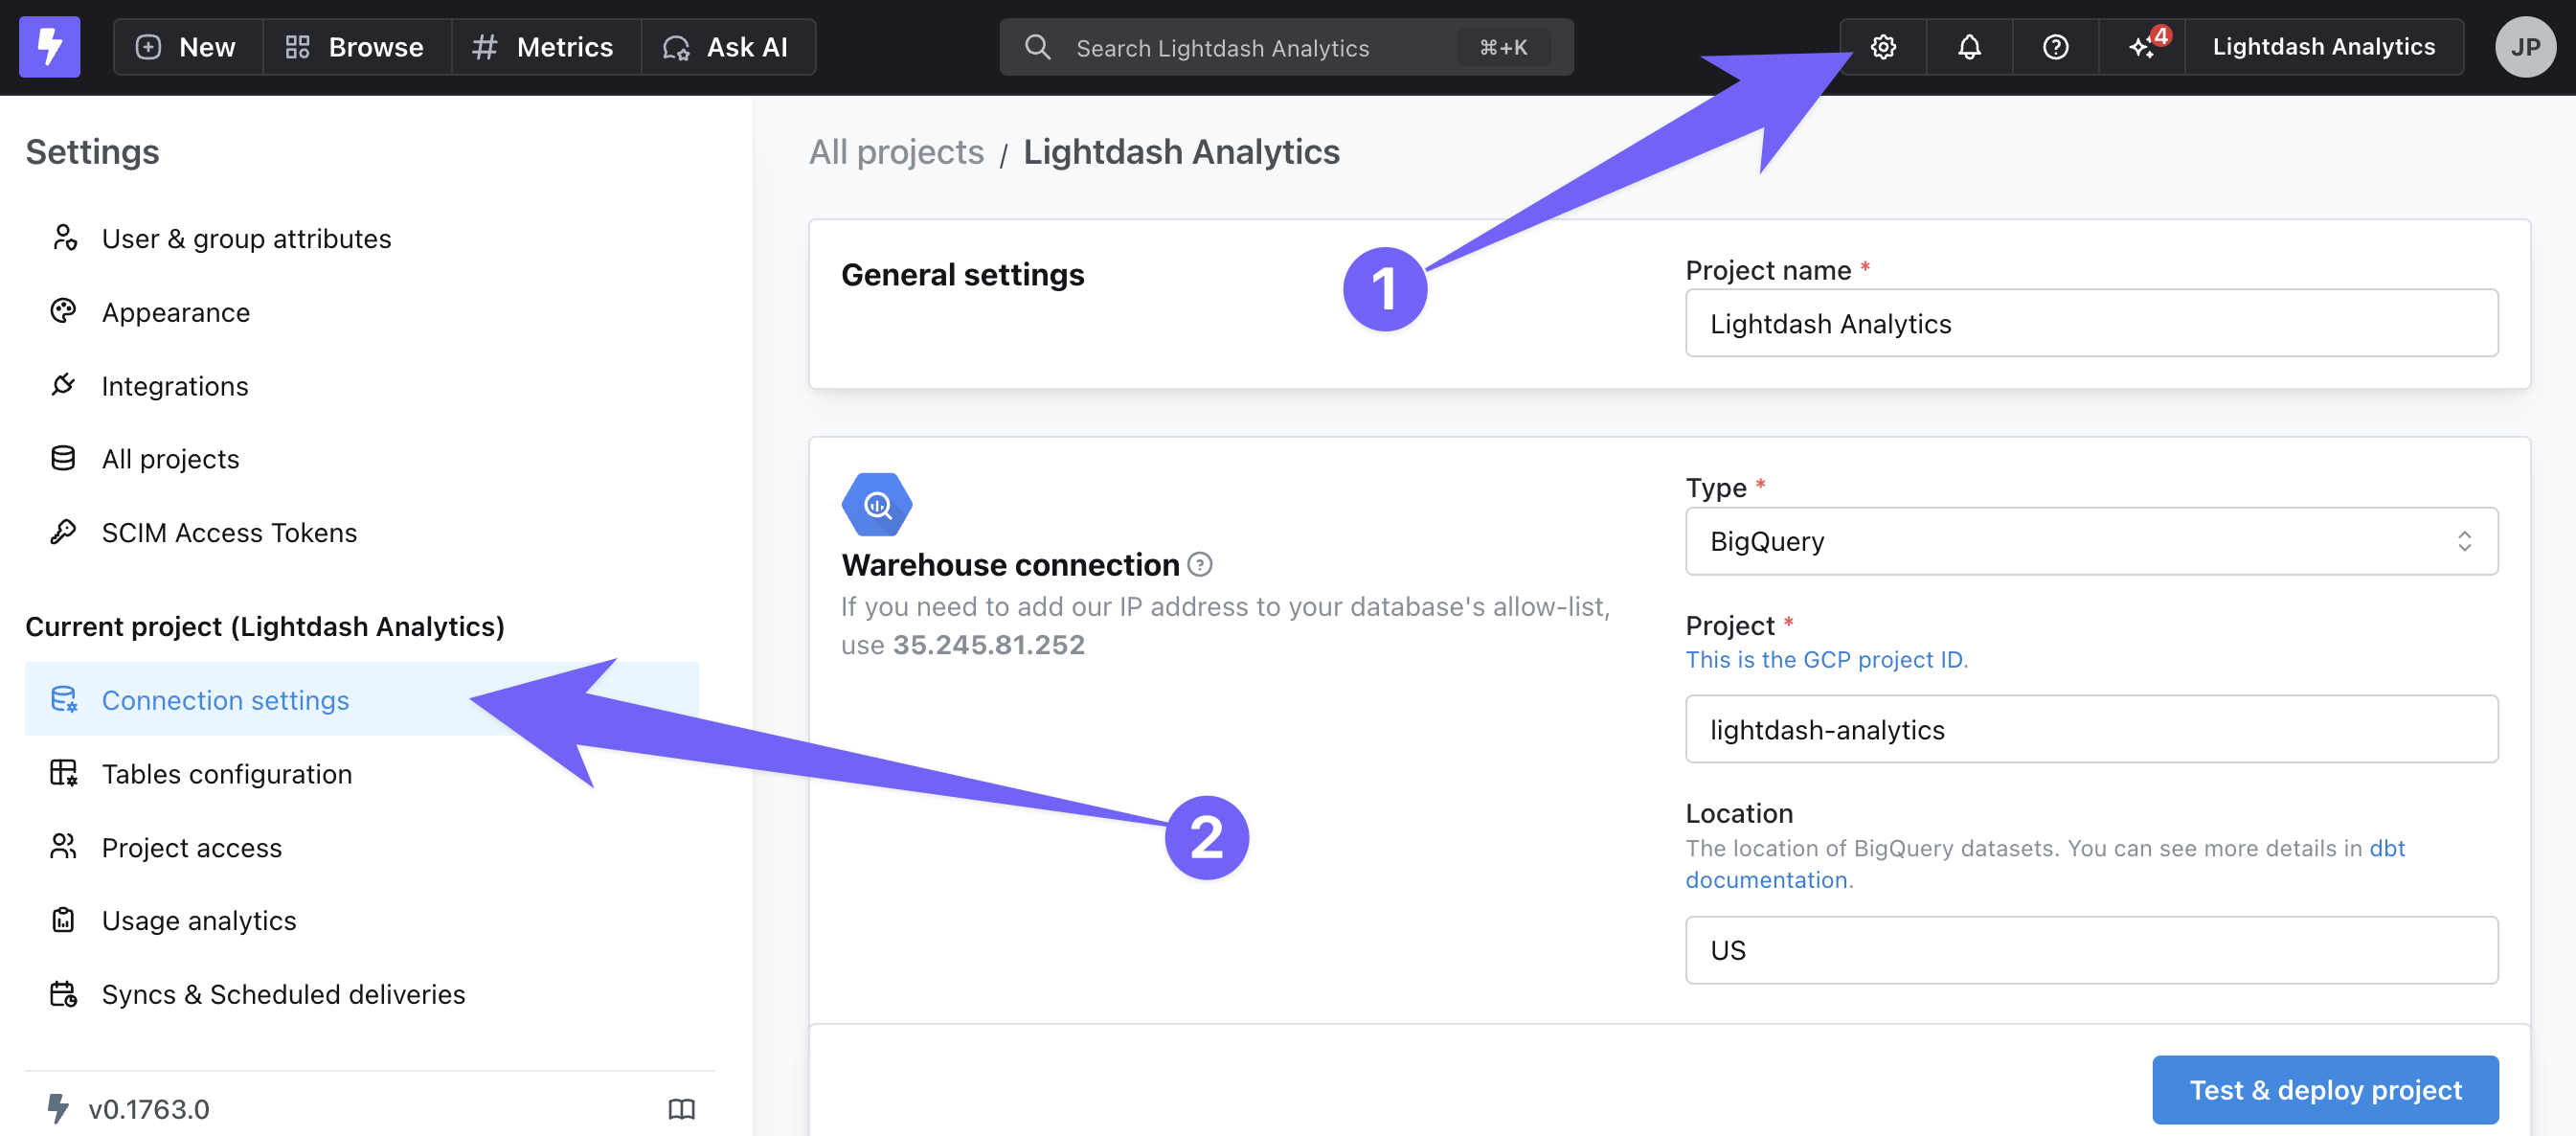
To update an existing connection, go to Project settings by clicking on the gear icon in the top-right navigation.
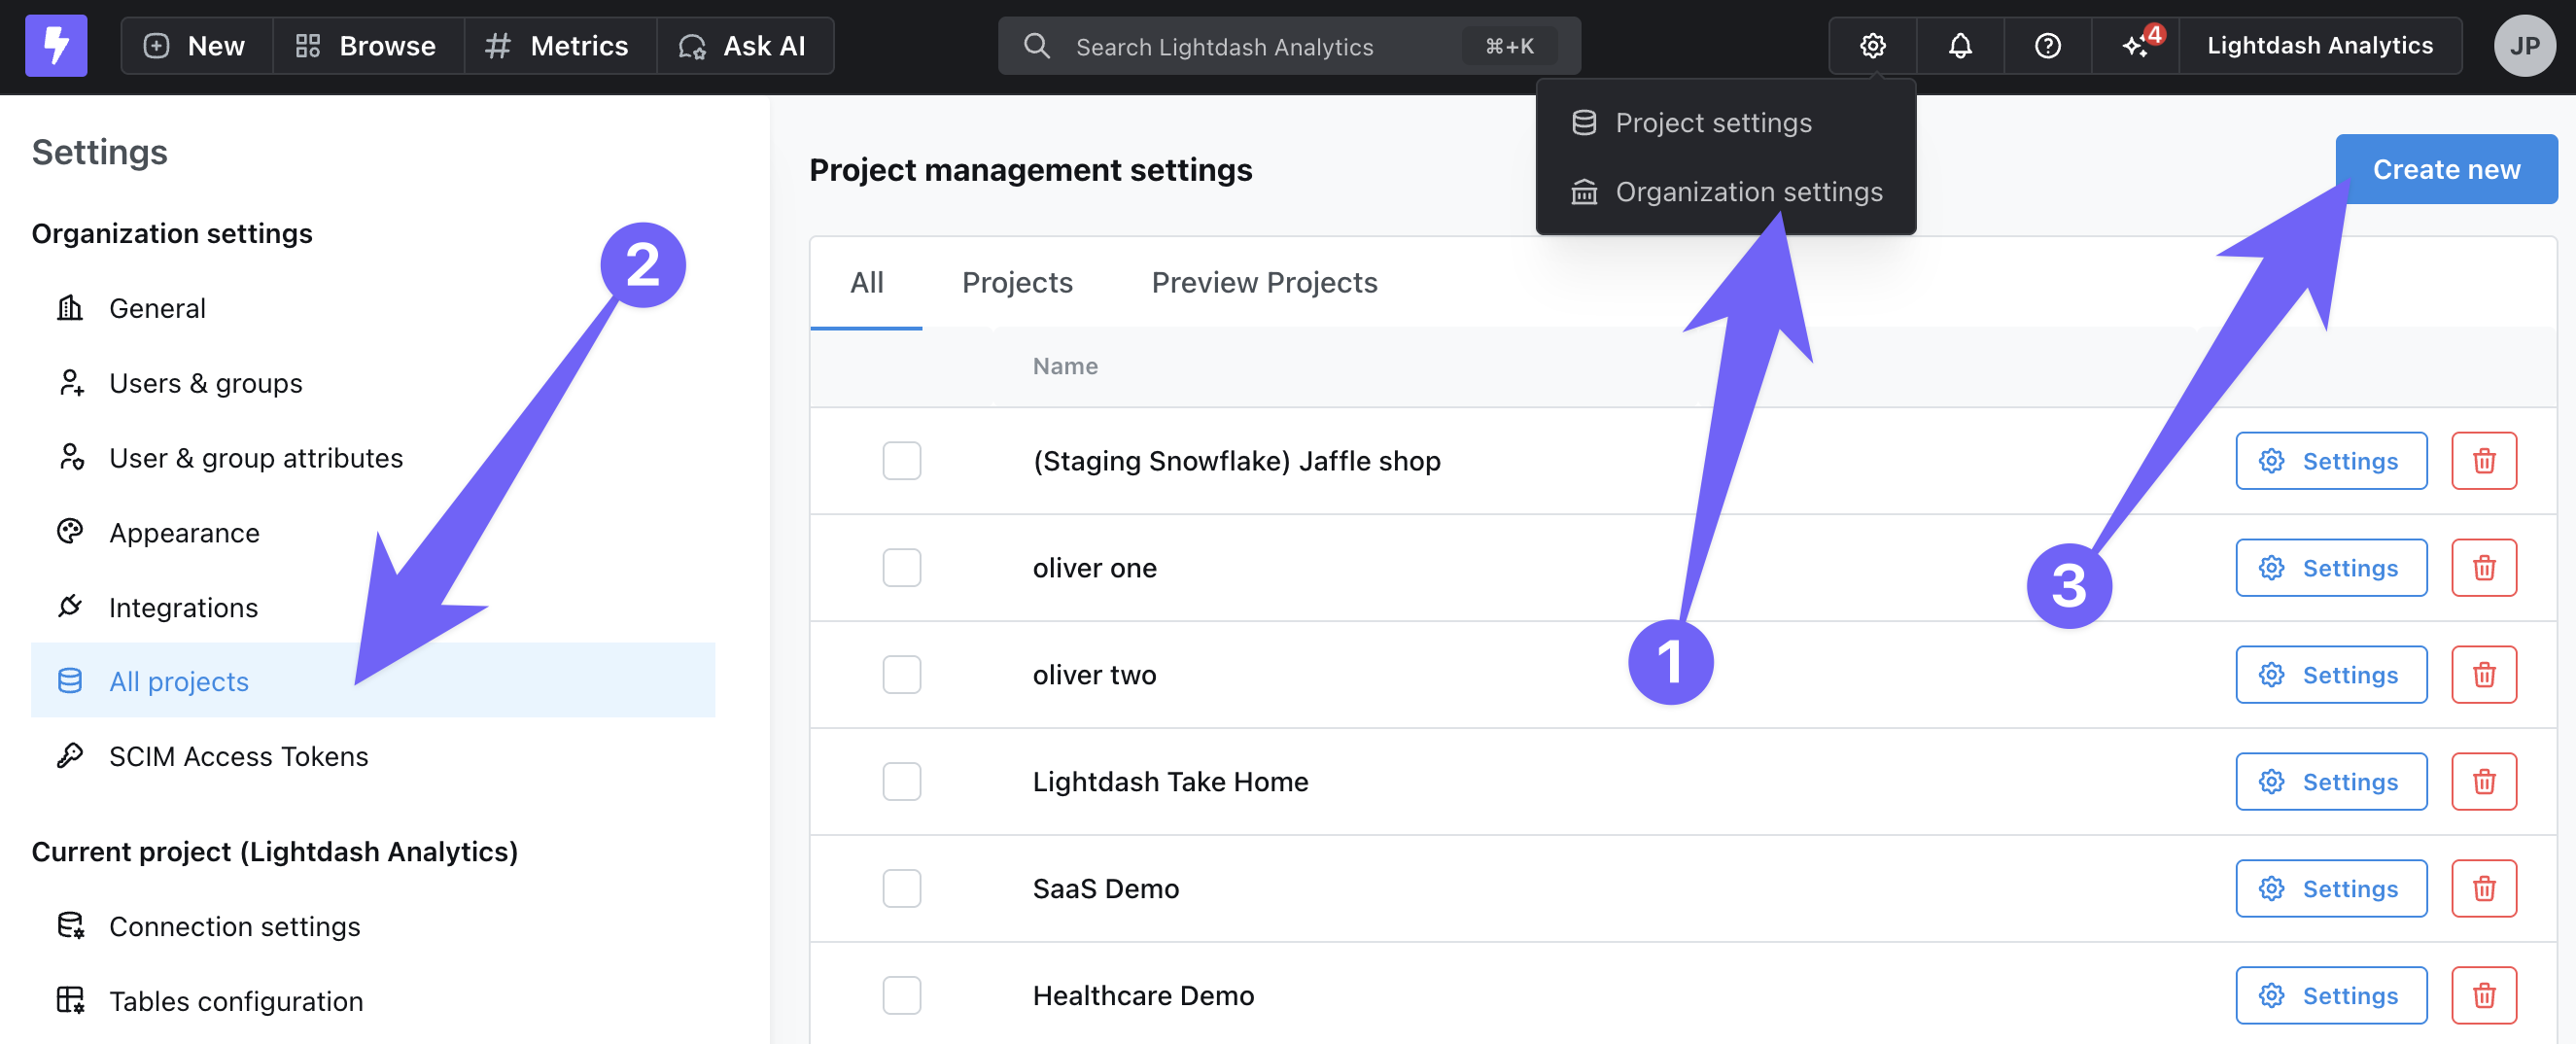
To create a new project, go to Organization settings, then All projects and click Create new.
1. Connect to a warehouse
We currently support:
We always recommend giving read-only permissions to Lightdash, that way you ensure than no data can be manipulated. See each section below for warehouse specific details.
Adding Lightdash's static IP addresses to your allow-list
Adding Lightdash's static IP addresses to your allow-list
Since we host your Lightdash for you, you may need to add our static IP addresses to the allow-list for your security group or firewall rules so they don’t block calls from your Lightdash Cloud to your connected databases.
If you login at:
- app.lightdash.cloud use 35.245.81.252
- eu1.lightdash.cloud use 34.79.239.130
If you login at a different domain, look for the IP in the project settings page (see image below).
Bigquery
Project
This is project ID from Google Cloud Platform for the data that you want to connect Lightdash to.
To find your project ID, head to the BigQuery Cloud console.
Once you’re in there, click on the project name in the top bar.
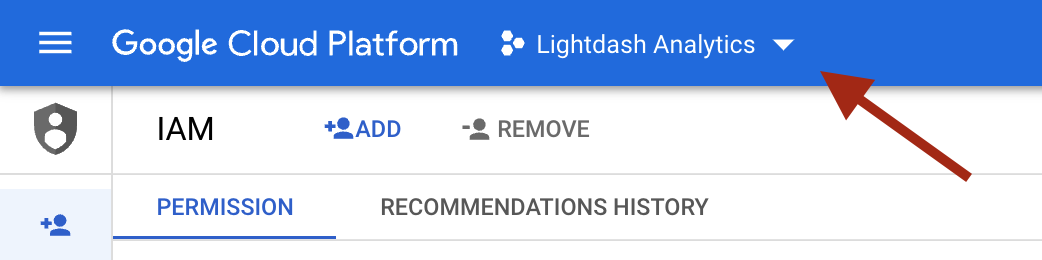
Then, you should see all of the projects and their project IDs in your organization (that you have access to).
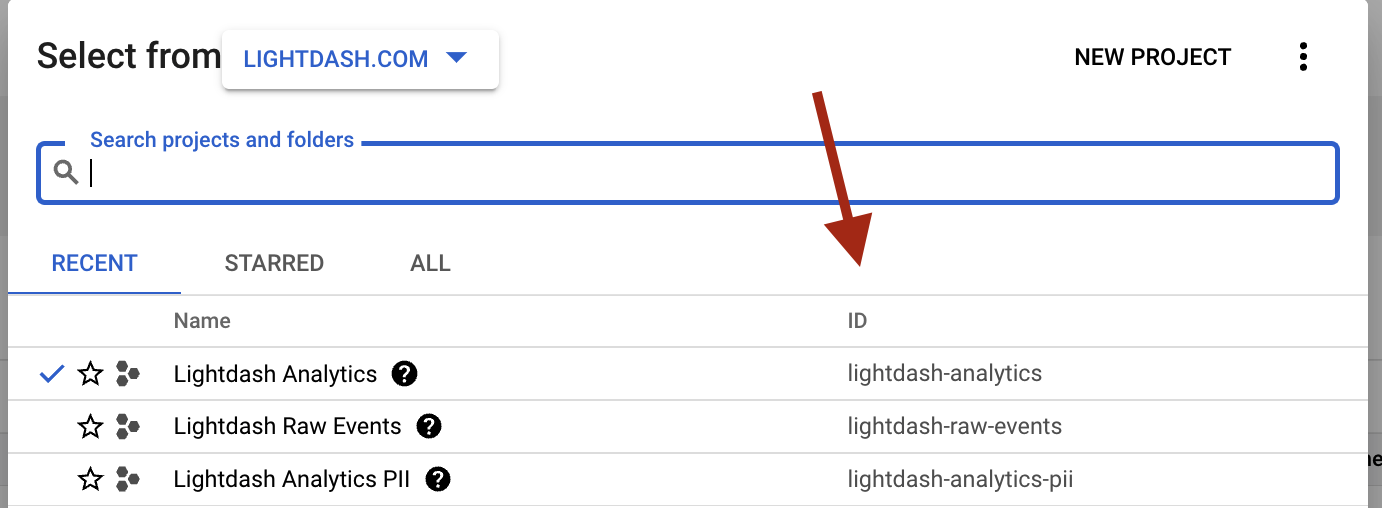
For the project you want to connect Lightdash to, just copy its id and pop it into the project field in the Warehouse Connection form in Lightdash.
Authentication type
You can choose to connect to BigQuery with a user account (using “Sign in with Google”) or with a service account using a JSON key file.
User Account (Sign in with Google)
When you use “Sign in with Google” - Lightdash will execute queries against bigquery with your personal google user account. This is the simplest way to get connected quickly using your existing account.
Service account (JSON Key File)
To have Lightdash connect to BigQuery with a service account, you need to create the account and JSON key. You can read more about creating and managing service accounts with Google BigQuery in their docs. You will need permissions to create service accounts and keys in your Google Project. If you don’t have the permissions, use your user account instead.
If you’re creating a new service account, make sure that you save your JSON key file somewhere safe! You’ll need it for connecting to Lightdash.
The service account you use with Lightdash will need to have the following roles in your GCP project:
-
roles/bigquery.dataViewer(to see data in your project) -
roles/bigquery.jobUser(to run queries in your project)
If you need to provide access to data across multiple BigQuery projects, the service account will need to be granted roles/bigquery.dataViewer on each additional BigQuery project.
Once you have a service account all ready to go, you’ll need to add its JSON key file to Lightdash in the key file section of the Warehouse Connection page.
Location
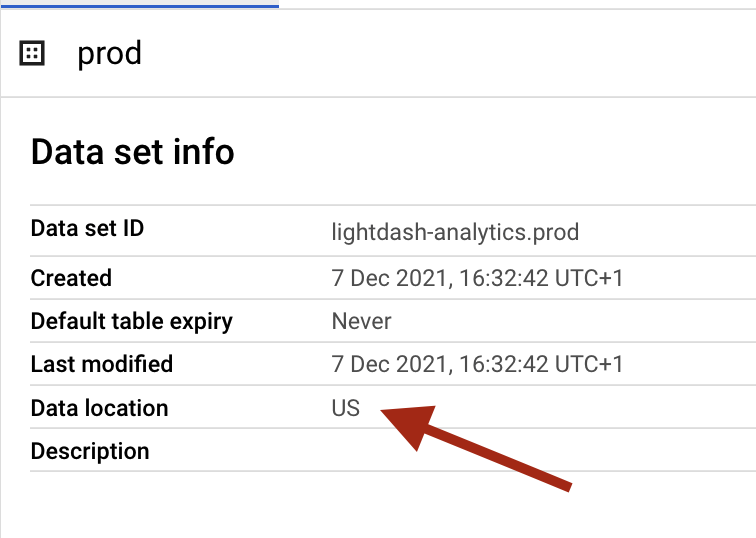
The data location of the dataset in BigQuery where the output of your dbt models is written to.
location may be either a multi-regional location (e.g. EU, US), or a regional location (e.g. us-west2 ). Check out the BigQuery documentation for more information on dataset locations.
You can find the location of the dataset you’re using for your dbt project in your dbt profiles.yml file, or in your BigQuery console.
Timeout in seconds
BigQuery supports query timeouts. By default, the timeout is set to 300 seconds. If a query run by Lightdash takes longer than this timeout to complete, then BigQuery may cancel the query and issue the following error:
To change this timeout, use the Timeout in seconds configuration.
Priority
The priority for the BigQuery jobs that Lightdash executes can be configured with the priority configuration in your Warehouse Connection settings. The priority field can be set to one of batch or interactive.
For more information on query priority, check out the BigQuery documentation.
Retries
The retries configuration specifies the number of times Lightdash should retry queries that result in unhandled server errors.
For example, setting retries to 5 means that Lightdash will retry BigQuery queries 5 times with a delay. If the query does not succeed after the fifth attempt, then Lightdash will raise an error.
By default, the number of retries is set to 3.
Maximum bytes billed
If a value for the Maximum bytes billed is set, then queries executed by Lightdash will fail if they exceed the configured maximum bytes threshhold. This configuration should be supplied as an integer number of bytes.
For example, setting this to 1000000000 means if a query would bill more than a gigabyte of data (e.g. 2Gb), then BigQuery will reject the query and you’d get an error like this:
Start of week
This controls what day is the start of the week in Lightdash. Auto sets it to whatever the default is for your data warehouse. Or, you can customize it and select the day of the week from the drop-down menu. This will be taken into account when using ‘WEEK’ time interval in Lightdash.
Execution project
Here you can specify an execution project to bill for query execution, instead of using the project where your dbt resources are materialized. If you leave this blank, all costs get applied to the project from the top of the connection details.
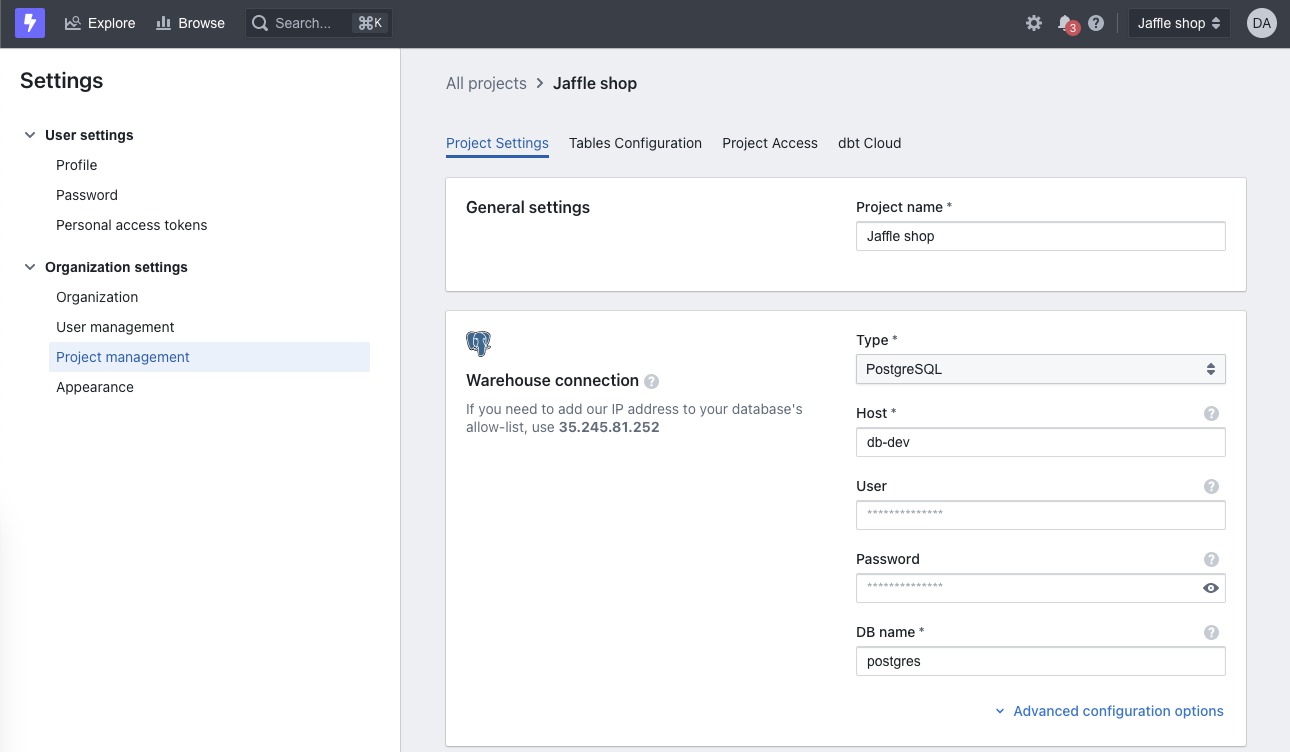
Postgres
You can see more details in dbt documentation.
Host
This is the host where the database is running.
User
This is the database user name.
Password
This is the database user password.
DB name
This is the database name.
Schema
This is the default schema used by dbt to compile and run your dbt project. You can find this in the dbt cloud IDE or your local profiles.yml file.
If you’re a dbt cloud user you can find this under your profile in the dbt cloud IDE:
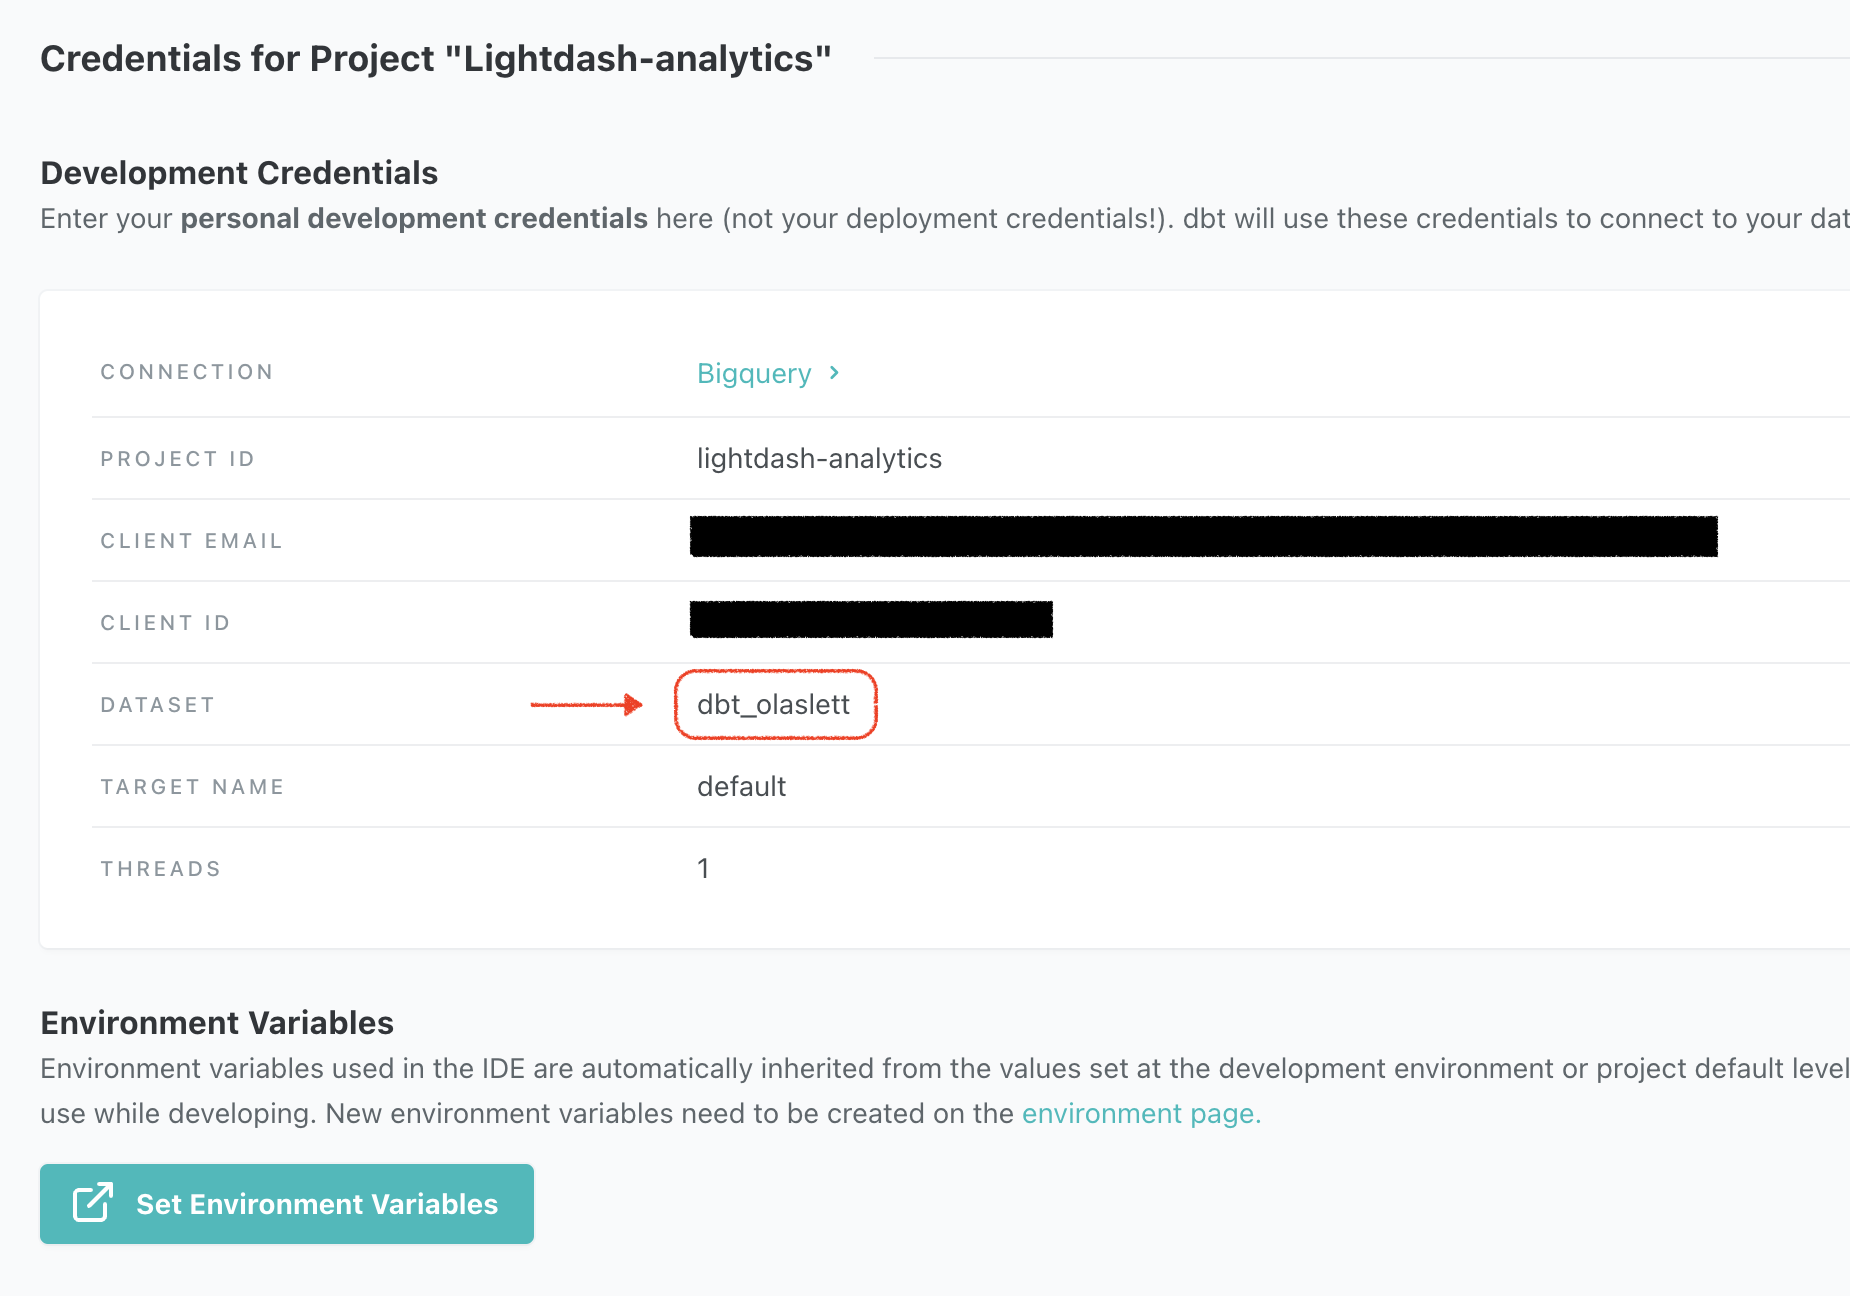
If you work with dbt locally, then check your profiles.yml file at ~/.dbt/profiles.yml and look for a field named schema:
Port
This is the port where the database is running.
Keep alive idle (seconds)
This specifies the amount of seconds with no network activity after which the operating system should send a TCP keepalive message to the client. You can see more details in postgresqlco documentation.
Search path
This controls the Postgres “search path”. You can see more details in dbt documentation.
SSL mode
This controls how dbt connects to Postgres databases using SSL. You can see more details in dbt documentation.
SSL certificate
The client certificate used to authenticate your connection to the database. This is only required if you’re using SSL mode verify-full.
SSL private key
The private key used to authenticate your connection to the database. This is only required if you’re using SSL mode verify-full.
SSL root certificate
The trusted certificate authority (CA) certificate used to verify the database server’s identity. This is only required if you’re using SSL mode verify-ca or verify-full.
Start of week
This controls what day is the start of the week in Lightdash. Auto sets it to whatever the default is for your data warehouse. Or, you can customize it and select the day of the week from the drop-down menu. This will be taken into account when using ‘WEEK’ time interval in Lightdash.
Use SSH tunnel
Enable to input your SSH Remote Host, SSH Remote Port, SSH Username, and to generate a public SSH key.
Redshift
You can see more details in dbt documentation.
Host
This is the host where the database is running.
User
This is the database user name.
Password
This is the database user password.
DB name
This is the database name.
Schema
This is the default schema used by dbt to compile and run your dbt project. You can find this in the dbt cloud IDE or your local profiles.yml file.
If you’re a dbt cloud user you can find this under your profile in the dbt cloud IDE:
If you work with dbt locally, then check your profiles.yml file at ~/.dbt/profiles.yml and look for a field named schema:
Port
This is the port where the database is running.
Keep alive idle (seconds)
This specifies the amount of seconds with no network activity after which the operating system should send a TCP keepalive message to the client.
If the database closes its connection while Lightdash is waiting for data, you may see the error SSL SYSCALL error: EOF detected. Lowering the keepalives_idle value may prevent this, because the server will send a ping to keep the connection active more frequently.
By default, this value is set to 240 seconds, but can be configured lower (perhaps 120 or 60), at the cost of a chattier network connection.
SSL mode
This controls how dbt connects to Postgres databases using SSL.
RA3 Node
Allow dbt to use cross-database-resources
Start of week
This controls what day is the start of the week in Lightdash. Auto sets it to whatever the default is for your data warehouse. Or, you can customize it and select the day of the week from the drop-down menu. This will be taken into account when using ‘WEEK’ time interval in Lightdash.
Use SSH tunnel
Enable to input your SSH Remote Host, SSH Remote Port, SSH Username, and to generate a public SSH key.
Snowflake
You can see more details in dbt documentation.
Account
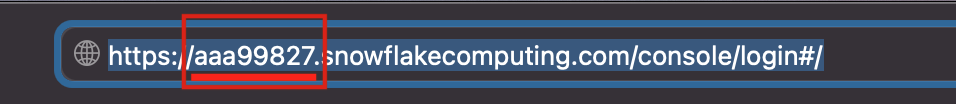
This is your Snowflake account identifer.
The easiest way to find this is to login to snowflake in your browser and your account identifier is whatever comes before snowflakecomputing.com.
For example in the image below, the user logs in via https://aaa99827.snowflakecomputing.com/console/login#/ so the account identifier is aaa99827.
If you don’t have access via the browser, you can use the following format <organization_name>-<account_name> whereorganization_name and account_name can be found by following any of the methods listed inManaging accounts in your organization.
User
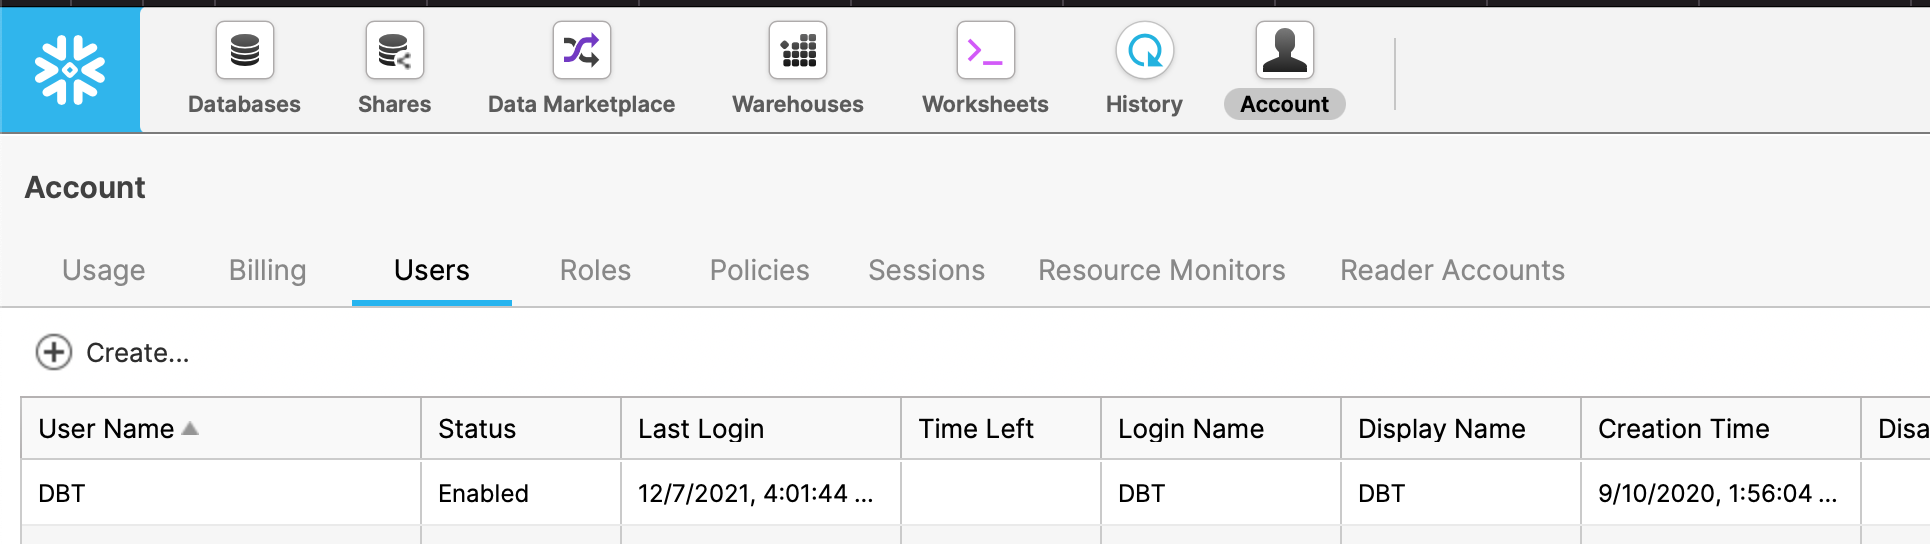
This is the login name for your Snowflake user. This is usually the same username you use to login to Snowflake.
Alternatively, you can create a new user through the snowflake consolewith a username and password specifically for Lightdash to use.
If you’re a snowflake admin you can list all users available in the snowflake console:
Authentication type
Choose to authenticate using either a user account (using “Sign in with Snowflake”) or with a service account using a JSON key file or password.
Sign in with Snowflake
This method requires you to configure an Oauth2 flow from your Snowflake warehouse.
Adding security integration on Snowflake warehouse
Adding security integration on Snowflake warehouse
To do this, first open an SQL console on your Snowflake warehouse, and create a security integration like this:
Now you can get the integration details using
Copy the OAUTH_AUTHORIZATION_ENDPOINT and OAUTH_TOKEN_ENDPOINT
Then run
And copy the OAUTH_CLIENT_SECRET, OAUTH_CLIENT_SECRET_2 and OAUTH_CLIENT_ID
Finally, contact the Lightdash Team support@lightdash.com to setup Sign in with Snowflake for your instance.
You can read more about this on Snowflake official docs
Private Key
You can generate a Private Key for a Snowflake user following the guide here
Once generated, copy across the Private Key File that is generated into Lightdash. If you chose to encrypt your private key you will also need to supply the Private Key Passphrase.
Password
This is the password your Snowflake user. This is usually the same password you use to login to Snowflake. Note that due to changes in Snowflake Authentication, users that require passwords may also need to enable MFA, which is not compatible with a Lightdash project connection.
Role
This is the security role that you would like to use when running queries as the specified user. The role must have access to any warehouses, databases, schemas, and tables you want to use.
If you’re a Snowflake admin you can list all roles available in the snowflake console:
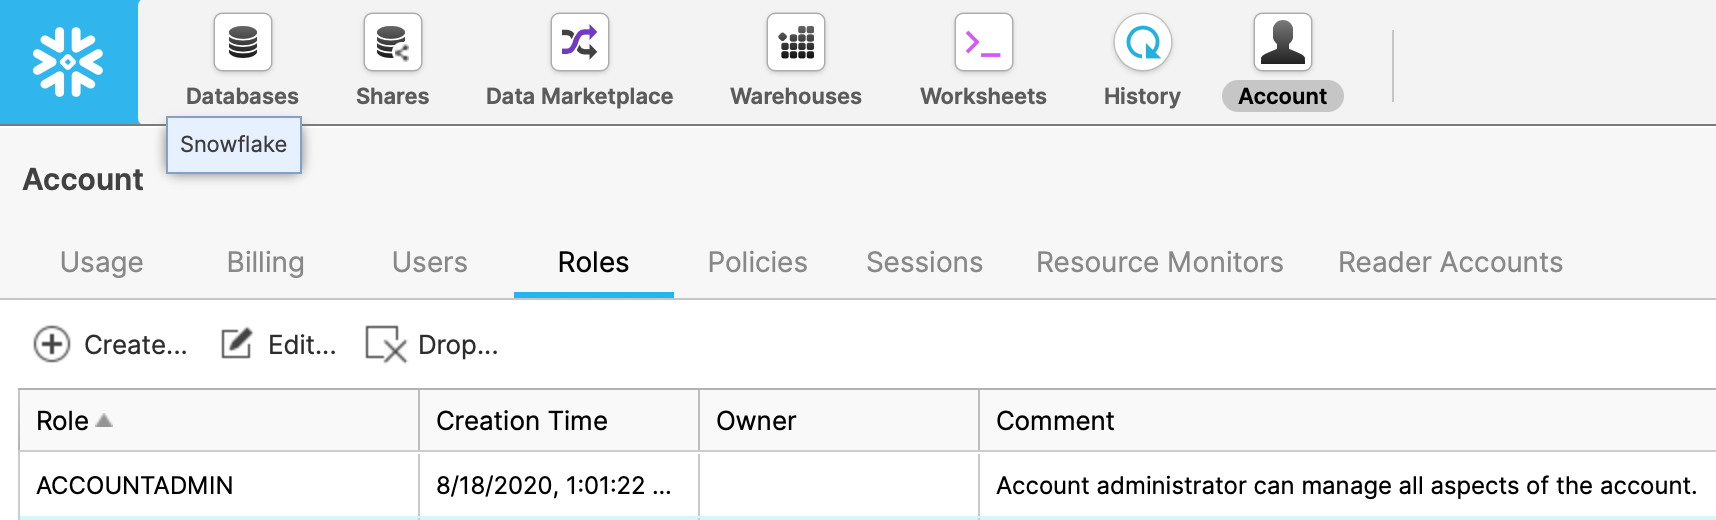
You can configure your role to allow read access to all warehouses, databases, schemas, and tables by following the guide forCreating custom read-only roles.
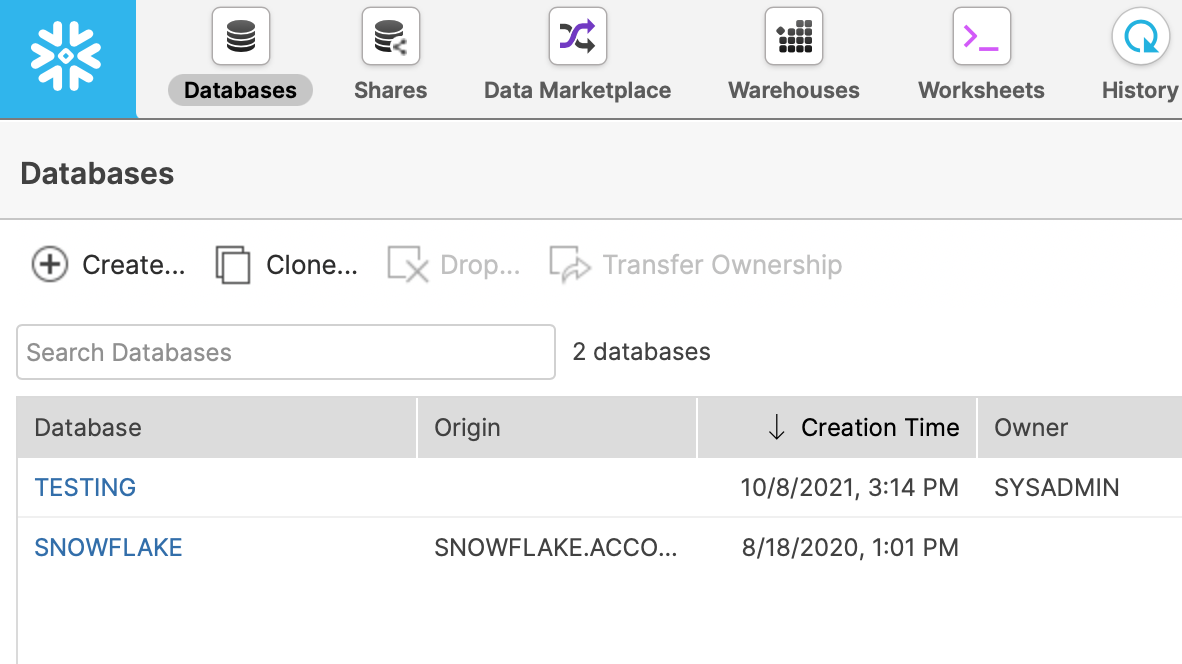
Database
This is the name of your database. The specified user must be granted access to this database. You can see a list of databases available in the snowflake console:
Warehouse
This is the name of the warehouse you would like to use for running queries. The specified user must be grantend access to use this warehouse. You can see al list of warehouses available in the snowflake console:
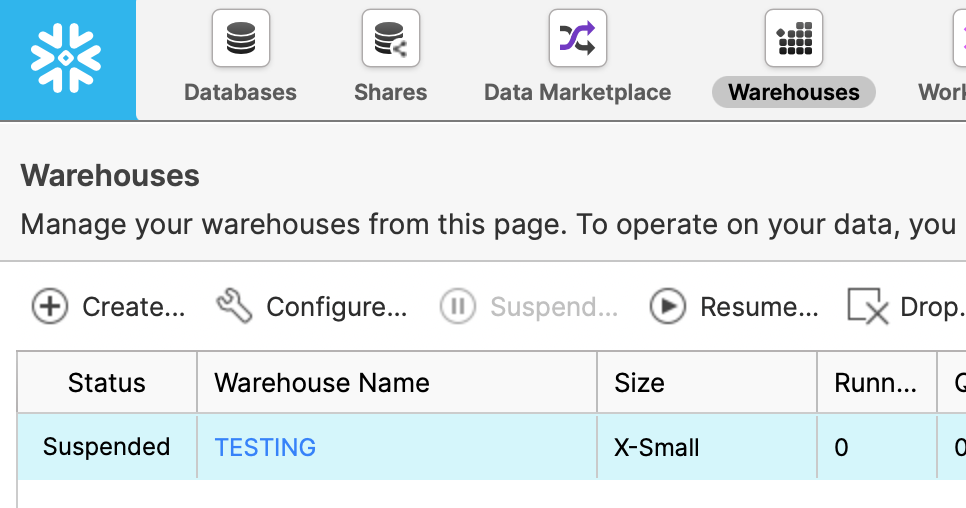
If “Always use this warehouse” is set to yes, this warehouse will be used for all queries, even if the dbt configuration specifies a different warehouse using snowflake_warehouse.
Schema
This is the default schema used by dbt to compile and run your dbt project. You can find this in the dbt cloud IDE or your local profiles.yml file.
If you’re a dbt cloud user you can find this under your profile in the dbt cloud IDE:
If you work with dbt locally, then check your profiles.yml file at ~/.dbt/profiles.yml and look for a field named schema:
Keep client session alive
This is intended to keep Snowflake sessions alive beyond the typical 4 hour timeout limit. You can see more details in dbt documentation.
Query tag
A value with which to tag all queries, for later searching in QUERY_HISTORY view)
Start of week
This controls what day is the start of the week in Lightdash. Auto sets it to whatever the default is for your data warehouse. Or, you can customize it and select the day of the week from the drop-down menu. This will be taken into account when using ‘WEEK’ time interval in Lightdash.
Databricks
The credentials needed to connect to your cluster can be found in the ODBC options in your databricks account:
-
Go to the
Computetab in the sidebar. -
Click the configuration tab for the cluster that you’re connecting to Lightdash.
-
Expand the
Advanced optionstab -
Open the
JDBC/ODBCtab
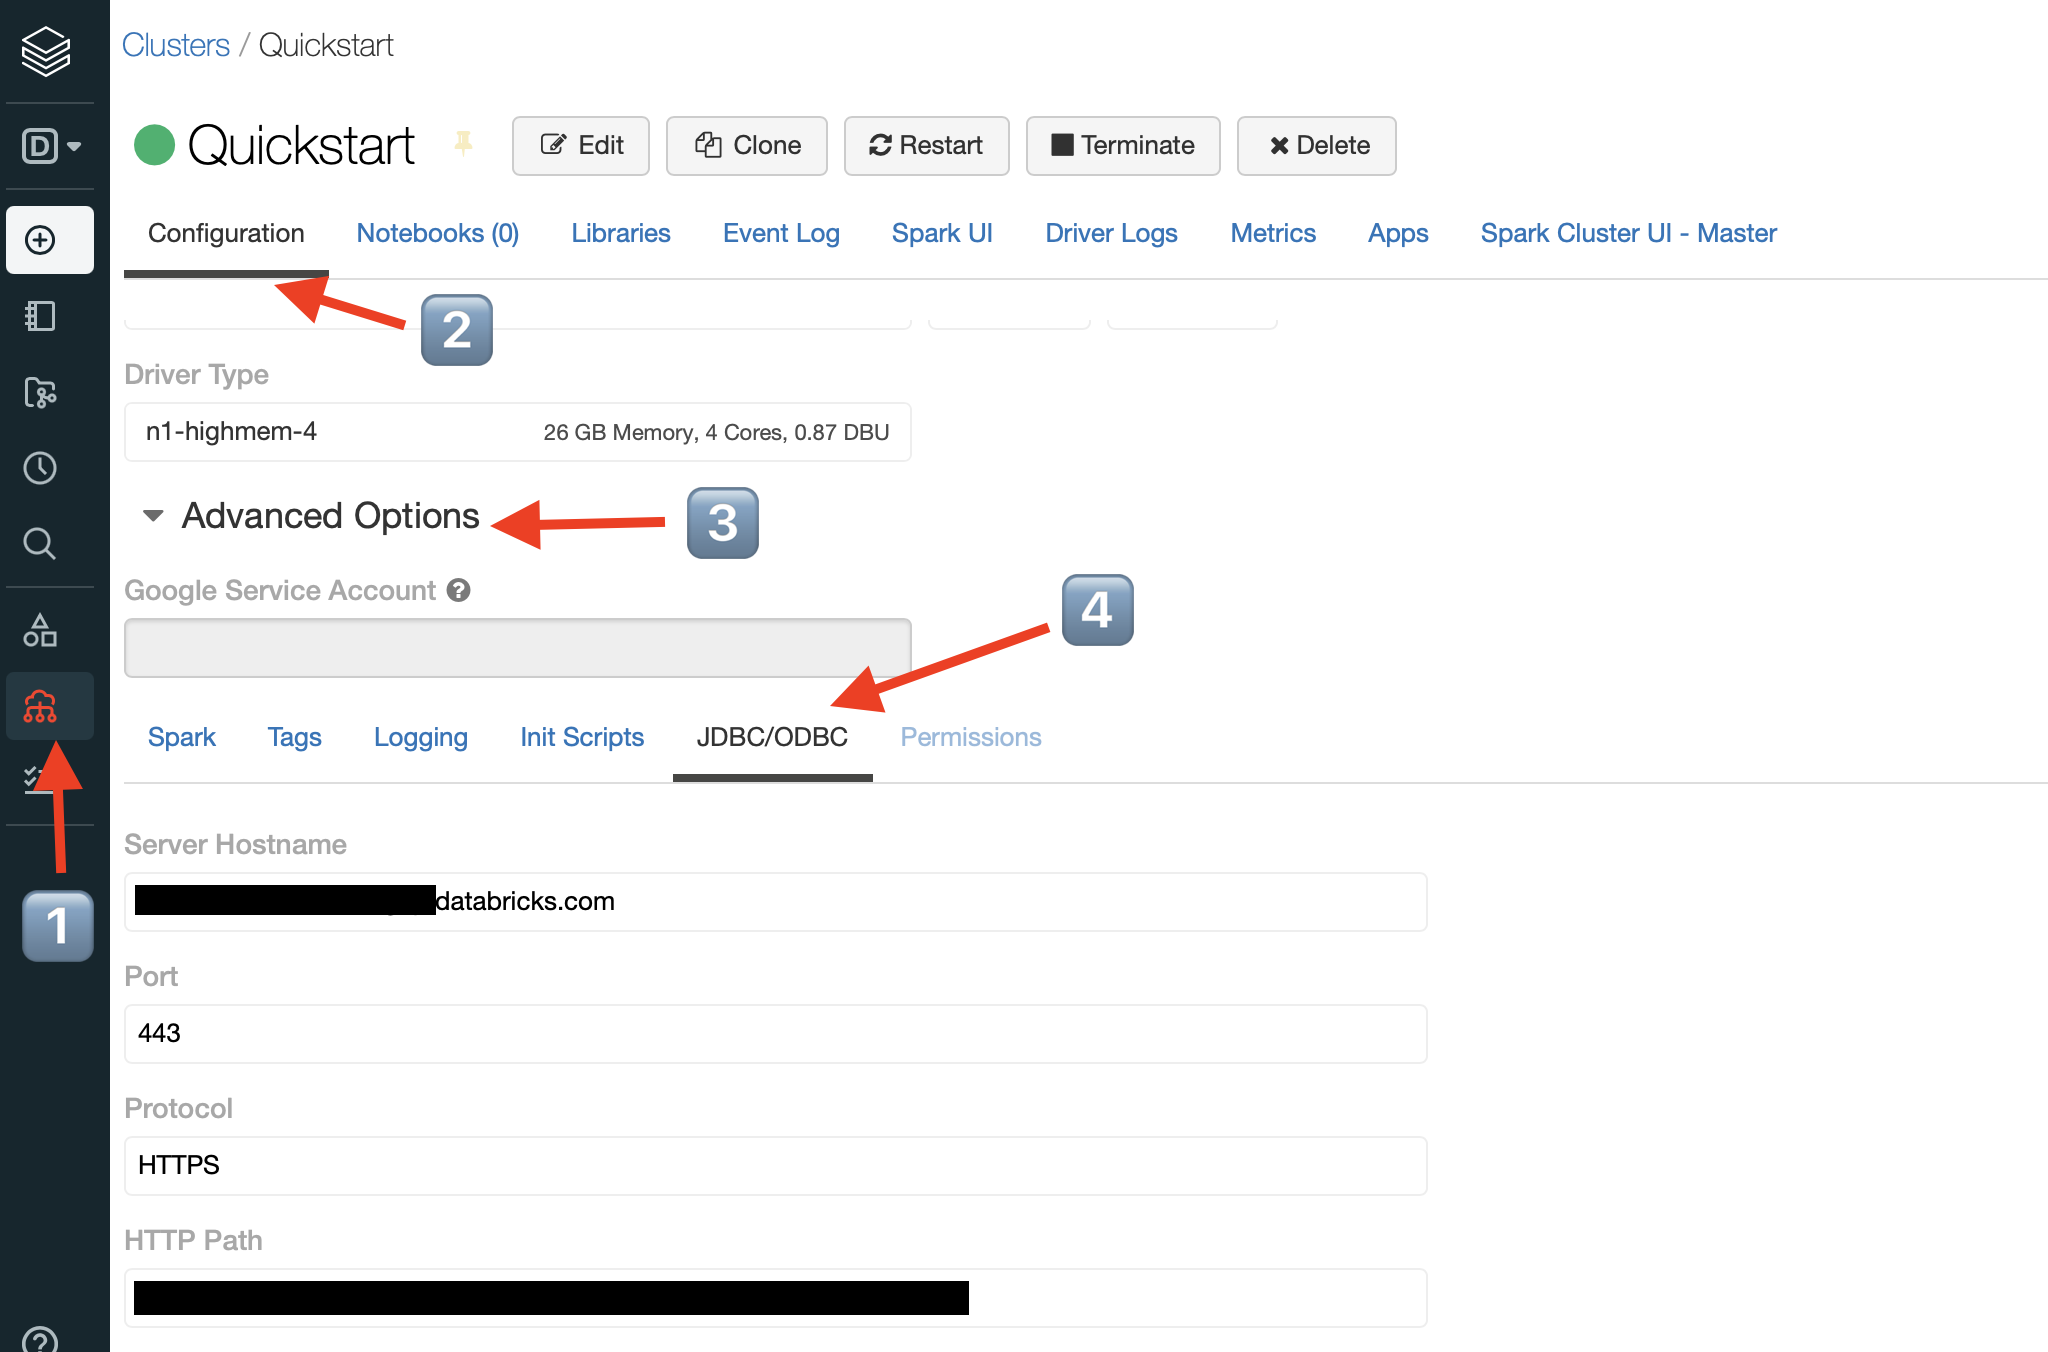
Server hostname
Follow the instructions above to find your ODBC connection instructions.
HTTP Path
Follow the instructions above to find your ODBC connection instructions.
Port
Follow the instructions above to find your ODBC connection instructions.
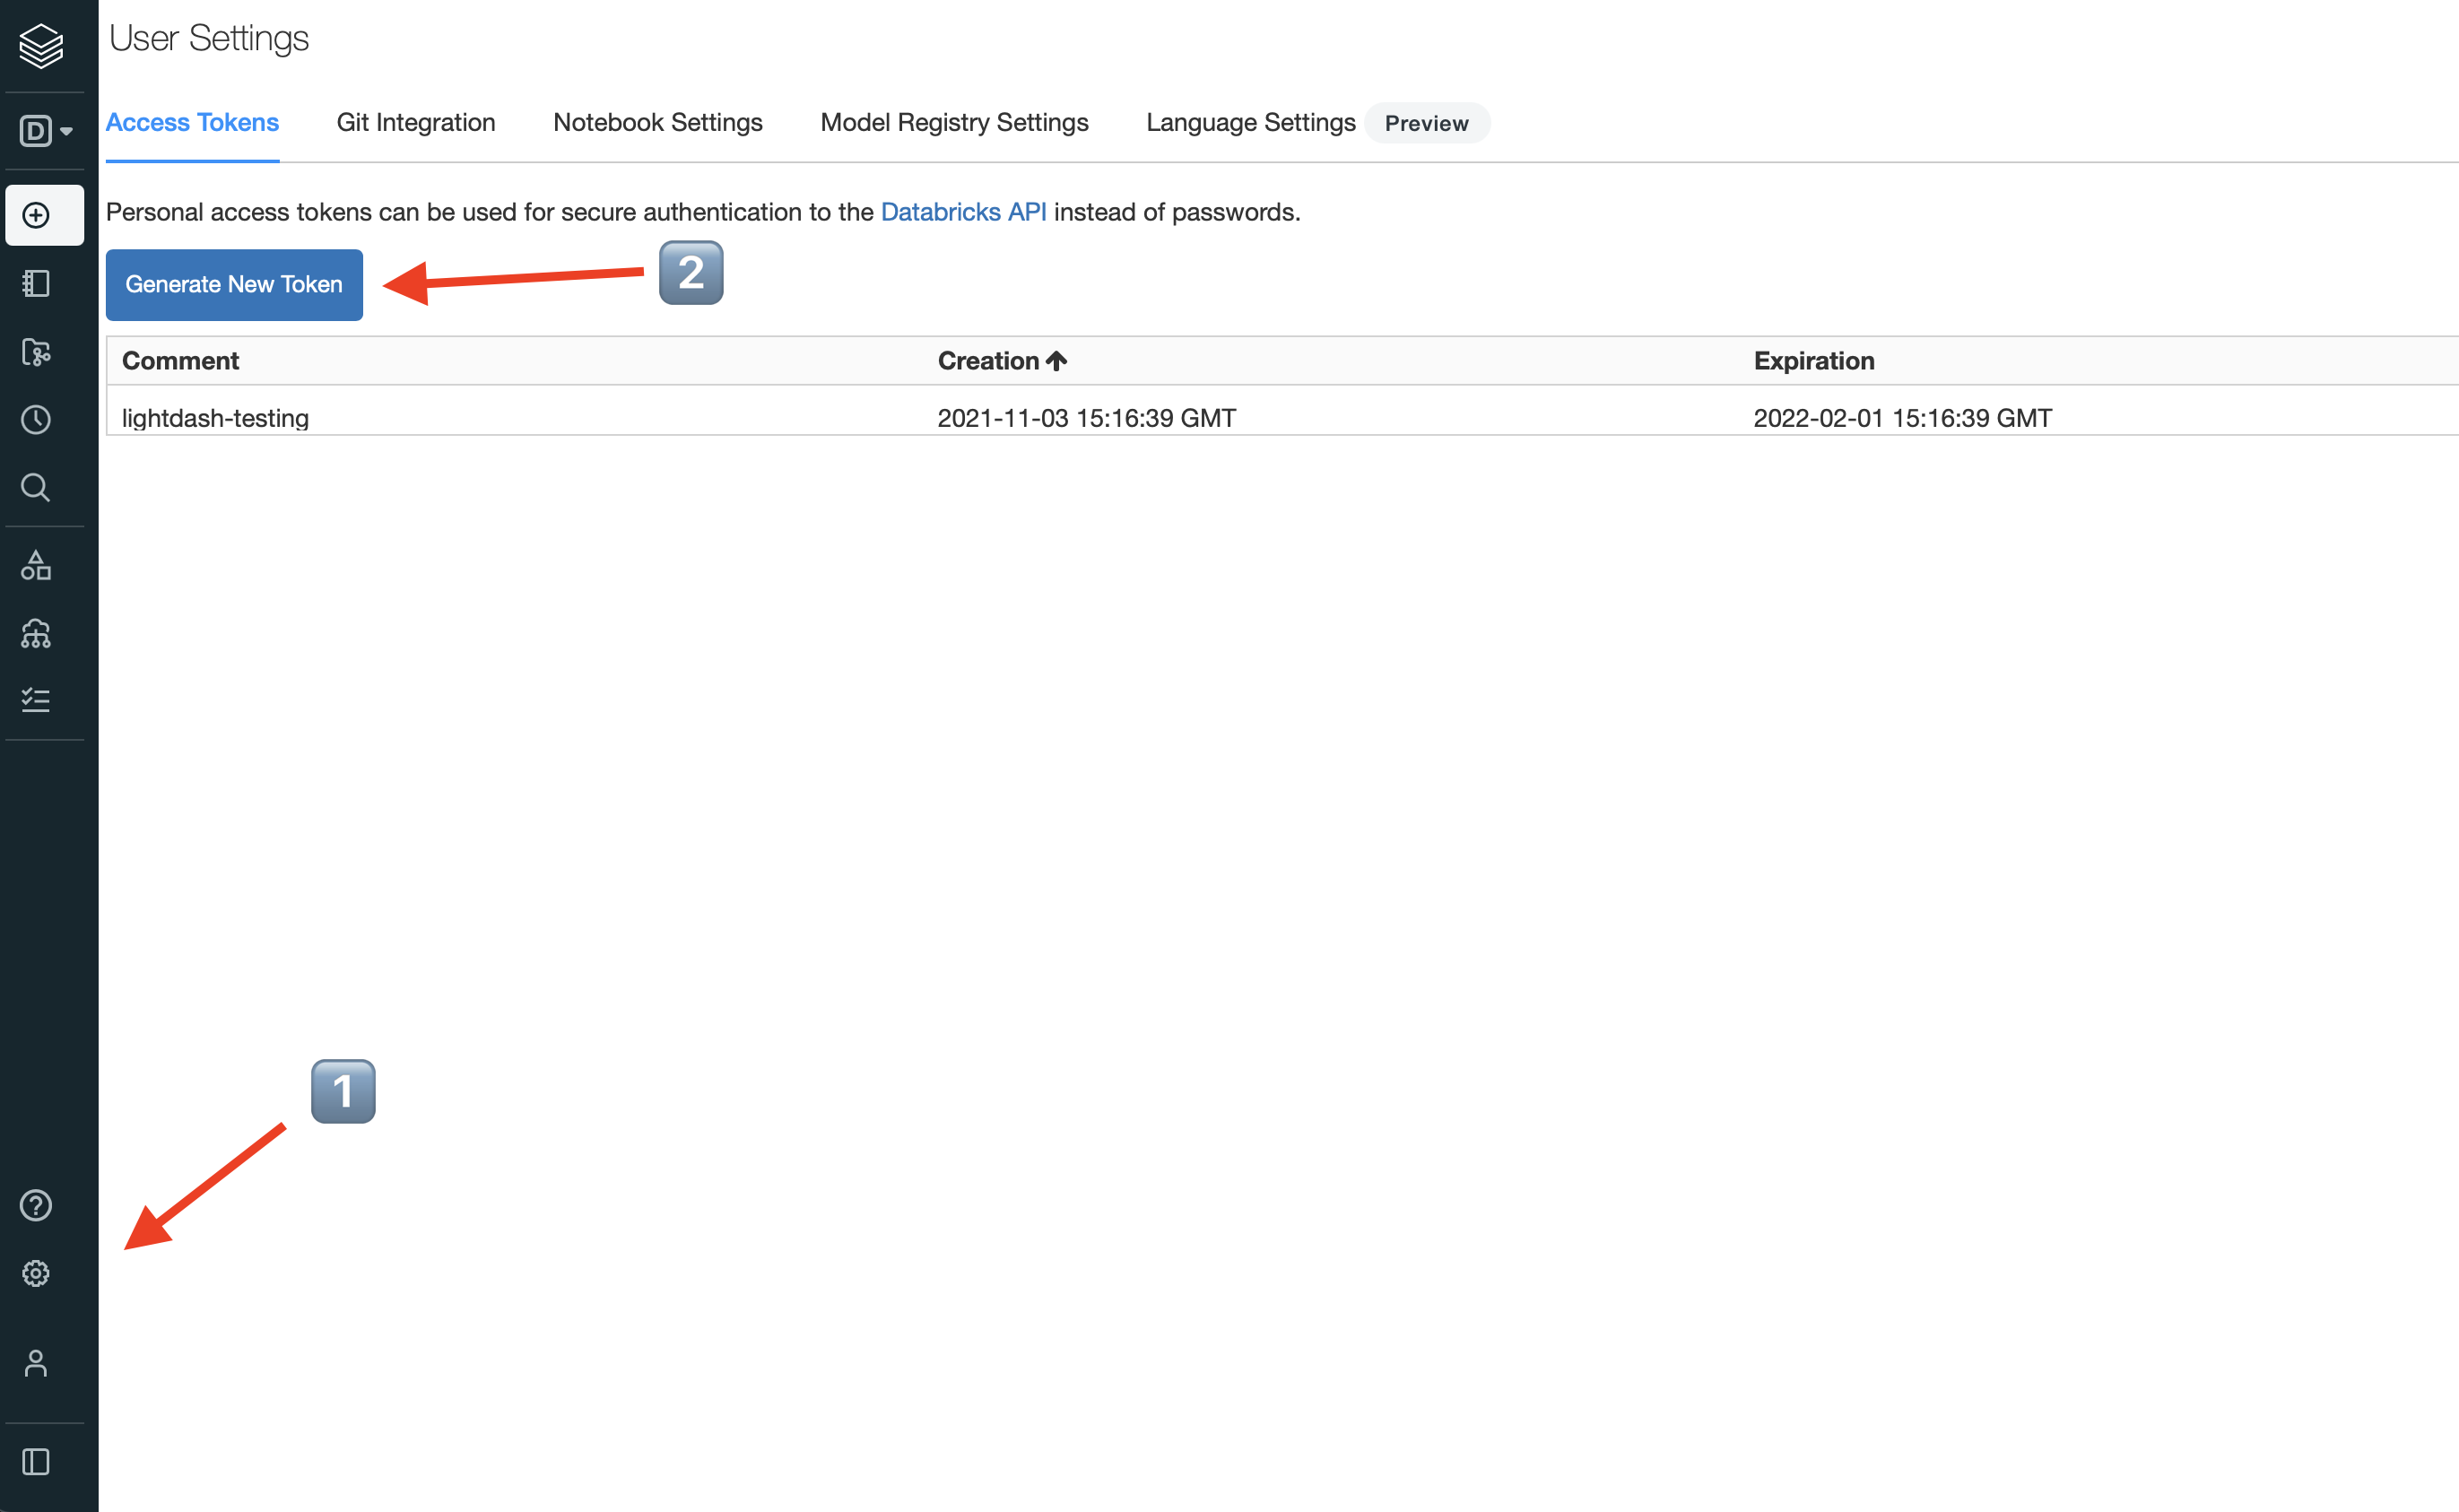
Personal Access Token
Your personal access token can be found in your user settings in databricks:
-
Open
Settingsby clicking the cog ⚙️ in the sidebar and selectUser settings -
Click
Generate token. You’ll be asked to enter a name and expiry. -
Copy the token
Database
The default database name used by dbt for this connection.
Start of week
This controls what day is the start of the week in Lightdash. Auto sets it to whatever the default is for your data warehouse. Or, you can customize it and select the day of the week from the drop-down menu. This will be taken into account when using ‘WEEK’ time interval in Lightdash.
Trino
We only support LDAP authentication with Trino. You can see more details in dbt’s documentation.
Host
The hostname of your cluster. E.g. mycluster.mydomain.com
Don’t include the http:// or https:// prefix.
User
The username (of the account) to log in to your cluster. When connecting to Starburst Galaxy clusters, you must include the role of the user as a suffix to the username.
Format for Starburst Enterprise or Trino: user.name or user.name@mydomain.com
Format for Starburst Galaxy:user.name@mydomain.com/role
Password
This is the password for authentication.
DB name
Specify the name of the database that your dbt models are built into. This is the name of a catalog in your cluster.
e.g. my_postgres_catalog
Port
The port to connect to your cluster. By default, it’s 443 for TLS enabled clusters.
e.g. 443
SSL mode
This controls how dbt connects to Trino database using SSL.
Start of week
This controls what day is the start of the week in Lightdash. Auto sets it to whatever the default is for your data warehouse. Or, you can customize it and select the day of the week from the drop-down menu. This will be taken into account when using ‘WEEK’ time interval in Lightdash.
2. Import a dbt project
Connecting Lightdash to a hosted dbt project means that you’ll be able to keep your Lightdash instance in sync with the changes in your dbt project.
To connect your dbt project, head to your project connection settings in Lightdash:
Then scroll down to your dbt project connection:
Pick your repository type and follow the guide below:
dbt Cloud managed repositories
Support for connecting Lightdash to dbt Cloud managed repositories is in beta. If you’re using dbt Cloud and you’d like to use Lightdash, please reach out to us.
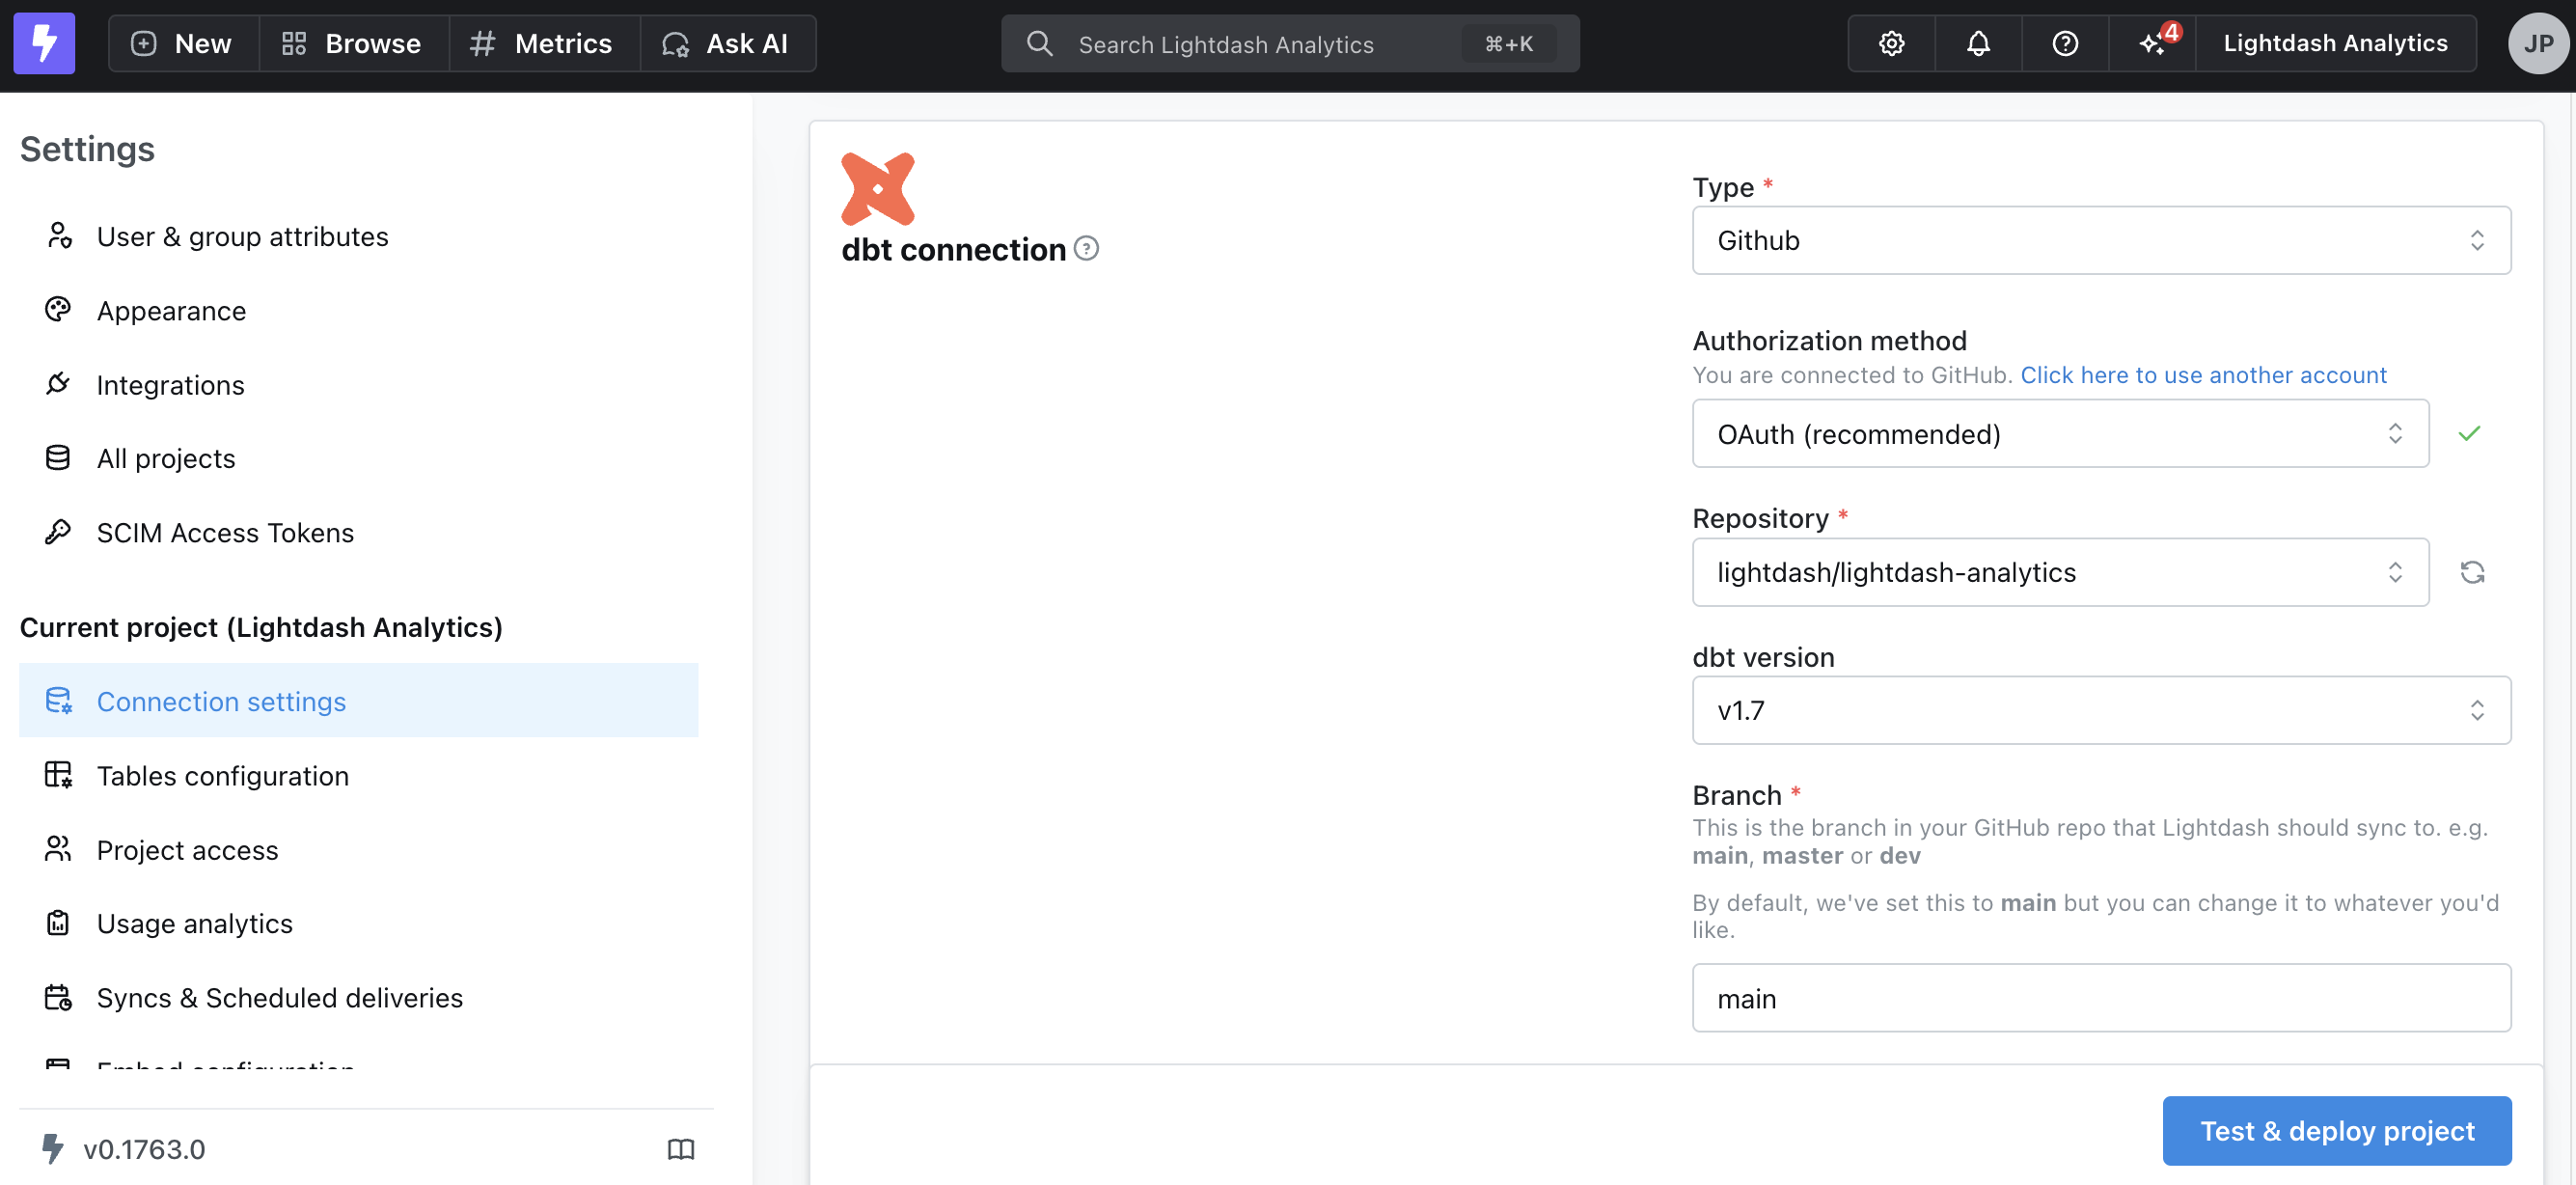
GitHub
OAuth (recommended authorization method)
We recommend you connect to Github using OAuth. This gives Lightdash a direct connection to the repo, so it won’t lose access when individuals leave the company, and it can create pull requests, which is required for dbt write-back features. This connection lives at the organization level, so you can map different dbt project repos to each Lightdash project without needing a new access token.
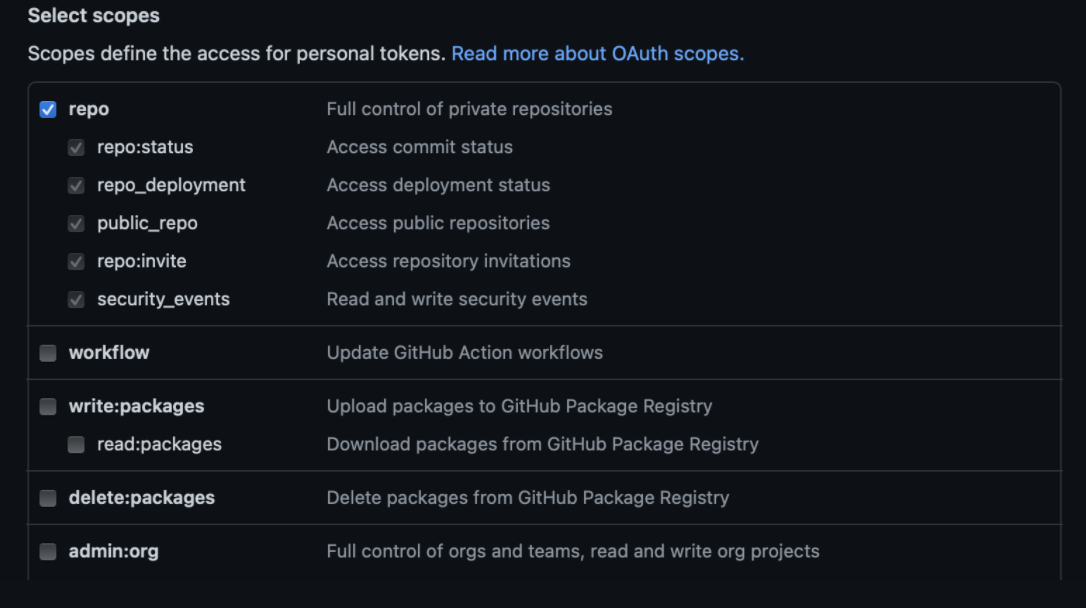
Personal access token (classic authorization method)
This is used to access your repo. See the instructions for creating a personal access token here.
Select repo scope when you’re creating the token.
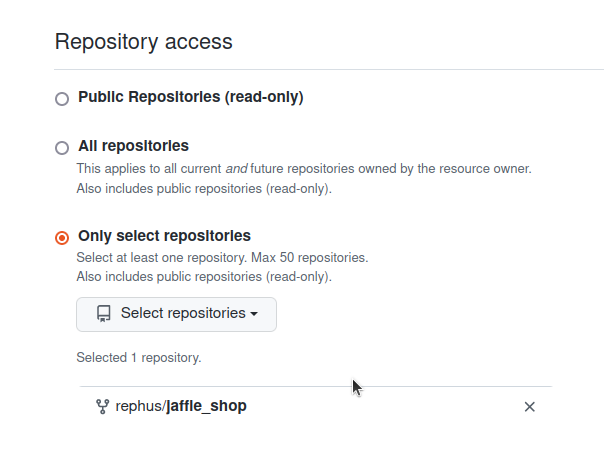
Fine-grained access token (beta authorization method)
Fine-grained access tokens are new special tokens that can only give access to individual repositories on your github account. You can read more about it on the Github docs.
- Go to Settings > Developer access > Personal access tokens > Fine-grained token
- Add the name, expiration, description and owner (we’ll need their username later)
- Add the repositories you want Lightdash to access. You might want to give access only to the repository where your
dbtproject is located.
- On
Repositorypermissions, selectContents—>Read and WriteandPull Requests—>Read and Write.
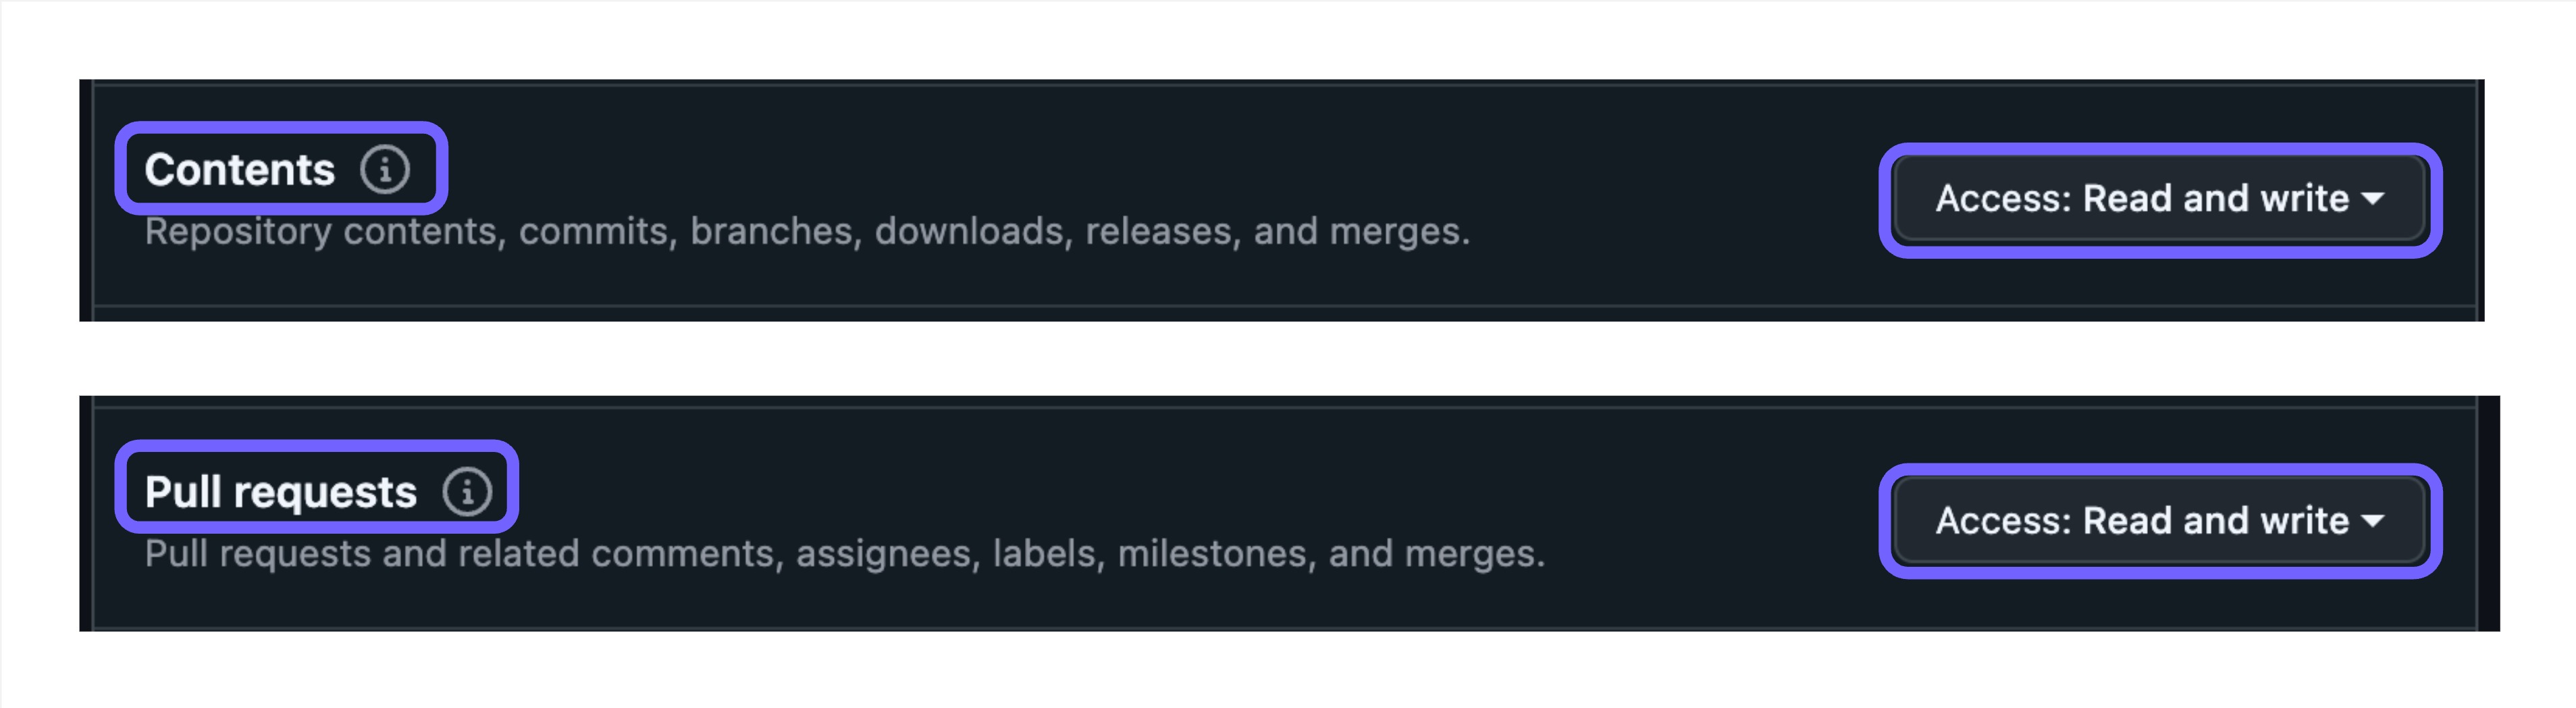
- Click
Generate tokenand copy the token.
You could also replace your old tokens with new fine-grained tokens on project settings.
Repository
This should be in the format my-org/my-repo. e.g. lightdash/lightdash-analytics
Branch
This is the branch in your GitHub repo that Lightdash should sync to. e.g. main, master or dev
By default, we’ve set this to main but you can change it to whatever you’d like.
Project directory path
This is the folder where your dbt_project.yml file is found in the GitHub repository you entered above.
-
Put
/if yourdbt_project.ymlfile is in the main folder of your repo (e.g. lightdash/lightdash-analytics/dbt_project.yml) -
Include the path to the sub-folder where your dbt project is if your dbt project is in a sub-folder in your repo. For example, if my project was in lightdash/lightdash-analytics/dbt/dbt_project.yml, I’d write
/dbtin this field.
Host domain
If you’ve customized the domain for your GitHub pages, you can add the custom domain for your project in here.
By default, this is github.com
After adding your Github information, fill out the dbt project details and you’re all set!
GitLab
Personal access token
This is used to access your repo. See the instructions for creating a personal access token here.
Select read_repository scope when you’re creating the token. The token, if using a project access token, or the user, when using a personal access token, needs to have permission to download the code. Normally this would be the Reporter role.
Repository
You can find this in the GitLab URL when you’re in your repo. This should be in the format my-org/my-repo. e.g. if my browser had https://gitlab.com/lightdash/lightdash-analytics.gitlab.io, I’d put in: lightdash/lightdash-analytics as my repository in Lightdash.
Branch
This is the branch in your GitLab repo that Lightdash should sync to. e.g. main, master or dev
By default, we’ve set this to main but you can change it to whatever you’d like.
Project directory path
This is the folder where your dbt_project.yml file is found in the GitLab repository you entered above.
If your dbt_project.yml file is in the main folder of your repo (e.g. lightdash/lightdash-analytics/dbt_project.yml), then you don’t need to change anything in here. You can just leave the default value we’ve put in.
If your dbt project is in a sub-folder in your repo (e.g. lightdash/lightdash-analytics/dbt/dbt_project.yml), then you’ll need to include the path to the sub-folder where your dbt project is (e.g. /dbt).
Host domain
If you’ve customized the domain for your GitLab pages, you can add the custom domain for your project in here.
By default, this is gitlab.io.
After adding your Gitlab information, fill out the dbt project details and you’re all set!
Azure DevOps
Personal access token
This is your secret token used to access Azure Devops. See the instructions to create a personal access tokenYou must specify at least the Repo:Read scope.
Organization
This is the name of the organization that owns your repository
Project
This is the name of the project that owns your repository
Repository
This is the name of the repository. For many projects, this is the same as your project name above.
Branch
This is the branch in your repository that Lightdash should sync to. e.g. main, master or dev
By default, we’ve set this to main but you can change it to whatever you’d like.
Project directory path
This is the folder where your dbt_project.yml file is found in the repository you entered above.
If your dbt_project.yml file is in the main folder of your repo (e.g. lightdash/lightdash-analytics/dbt_project.yml), then you don’t need to change anything in here. You can just leave the default value we’ve put in.
If your dbt project is in a sub-folder in your repo (e.g. lightdash/lightdash-analytics/dbt/dbt_project.yml), then you’ll need to include the path to the sub-folder where your dbt project is (e.g. /dbt).
After adding the Azure DevOps details, fill out the dbt project details and you’re all set!
Bitbucket
Username
This is the login name for your Bitbucket user. This is usually the same username you use to login to Bitbucket. You can find your username in Bitbucket by:
-
Going to your avatar in the bottom left and click Personal settings.
-
From the Account settings page, check the value next to the Username
Alternatively, you can create a new user through the Bitbucket consolewith a username and password specifically for Lightdash to use.
Http access token
Getting a token depends on whether you use Bitbucket Cloud or Bitbucket server:
-
Bitbucket Cloud users should follow instructions for creating an App Password
-
Bitbucket Server users should follow instructions for creating a HTTP Access Token
Select Project read and Repository read scope when you’re creating the token.
Repository
This should be in the format my-org/my-repo. e.g. lightdash/lightdash-analytics
Branch
This is the branch in your Bitbucket repo that Lightdash should sync to. e.g. main, master or dev
By default, we’ve set this to main but you can change it to whatever you’d like.
Project directory path
This is the folder where your dbt_project.yml file is found in the Bitbucket repository you entered above.
-
Put
/if yourdbt_project.ymlfile is in the main folder of your repo (e.g. lightdash/lightdash-analytics/dbt_project.yml) -
Include the path to the sub-folder where your dbt project is if your dbt project is in a sub-folder in your repo. For example, if my project was in lightdash/lightdash-analytics/dbt/dbt_project.yml, I’d write
/dbtin this field.
Host domain
If you’ve customized the domain for your Bitbucket server, you can add the custom domain for your project in here.
After adding your Bitbucket information, fill out the dbt project details and you’re all set!
CLI
The CLI connection type is the default type for projects that were created using the CLI via the lightdash deploy --create command.
Usually, we recommend swapping to a direct connection to your git repo after initial project creation, but if you want to continue managing deployments in the CLI, read this guide on how to use Lightdash deploy and set up continuous deployment.
Local dbt project
Unsuitable for production and only available for Lightdash instances installed on your local machine
To start Lightdash with the option to connect to a local dbt project, you must specify the directory of the dbt project when you start docker compose: