Accessing project compilation logs
To view the compilation logs for your project:- Click on the
settingsicon in the navigation bar - Navigate to
project settings - Select
compilation historyfrom the menu
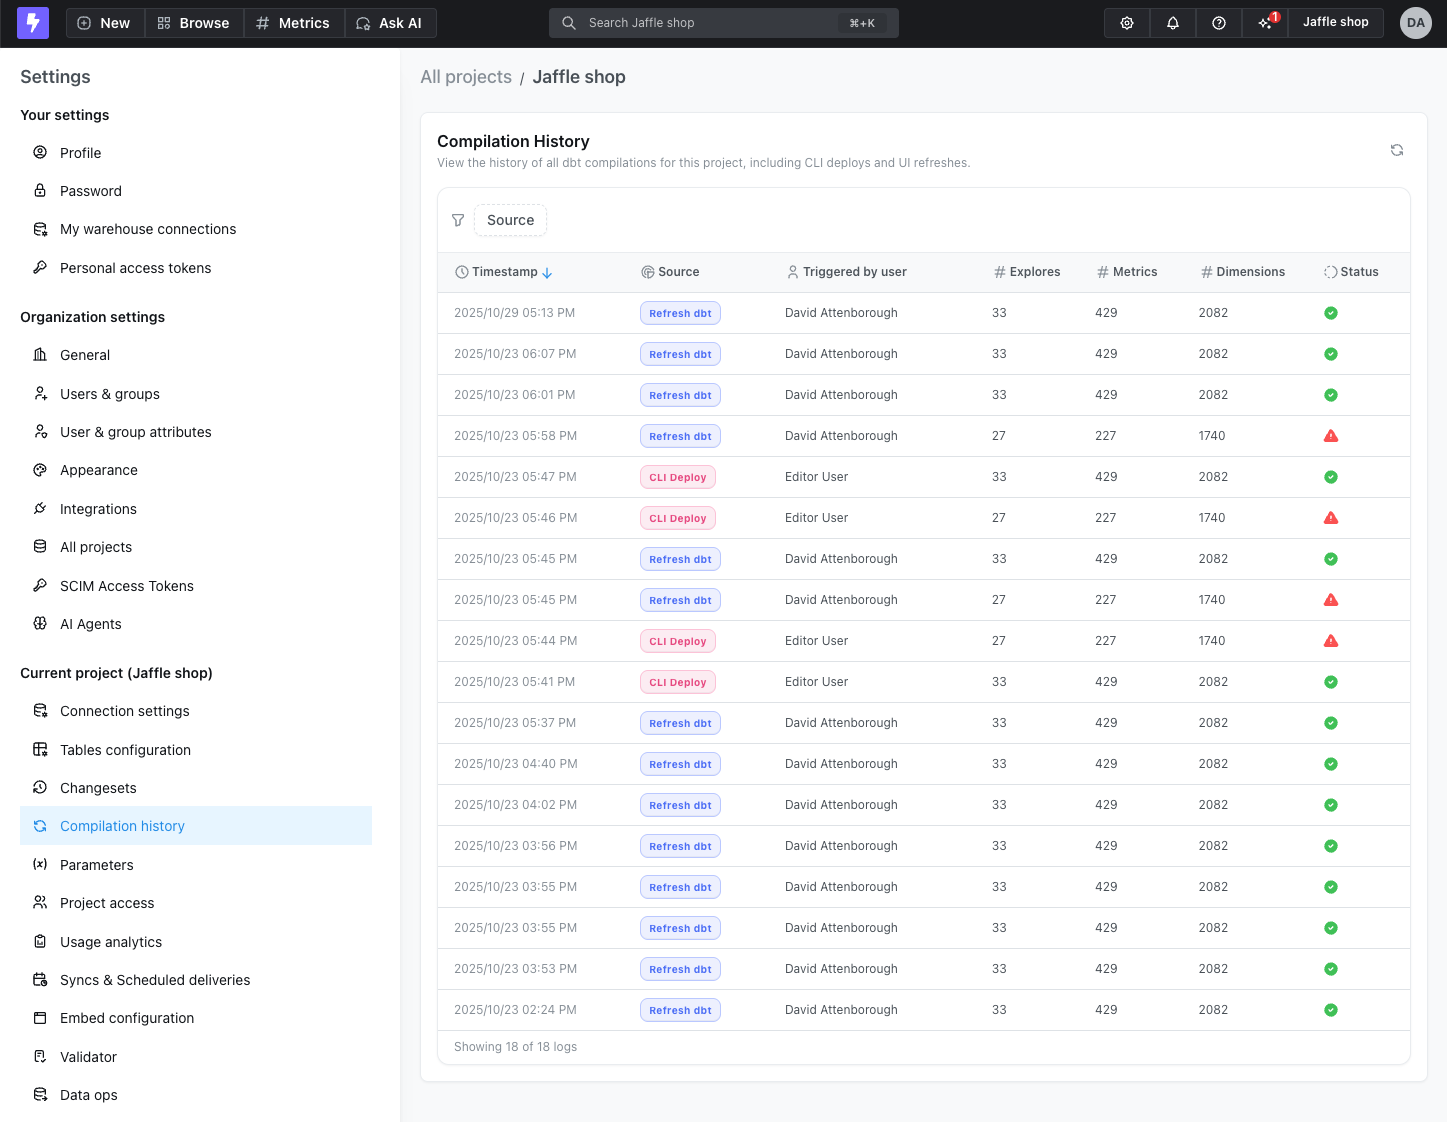
Understanding compilation log entries
The compilation history displays a list of all project compilations, showing when each compilation occurred, who triggered it, and the source (such asRefresh dbt, CLI Deploy).
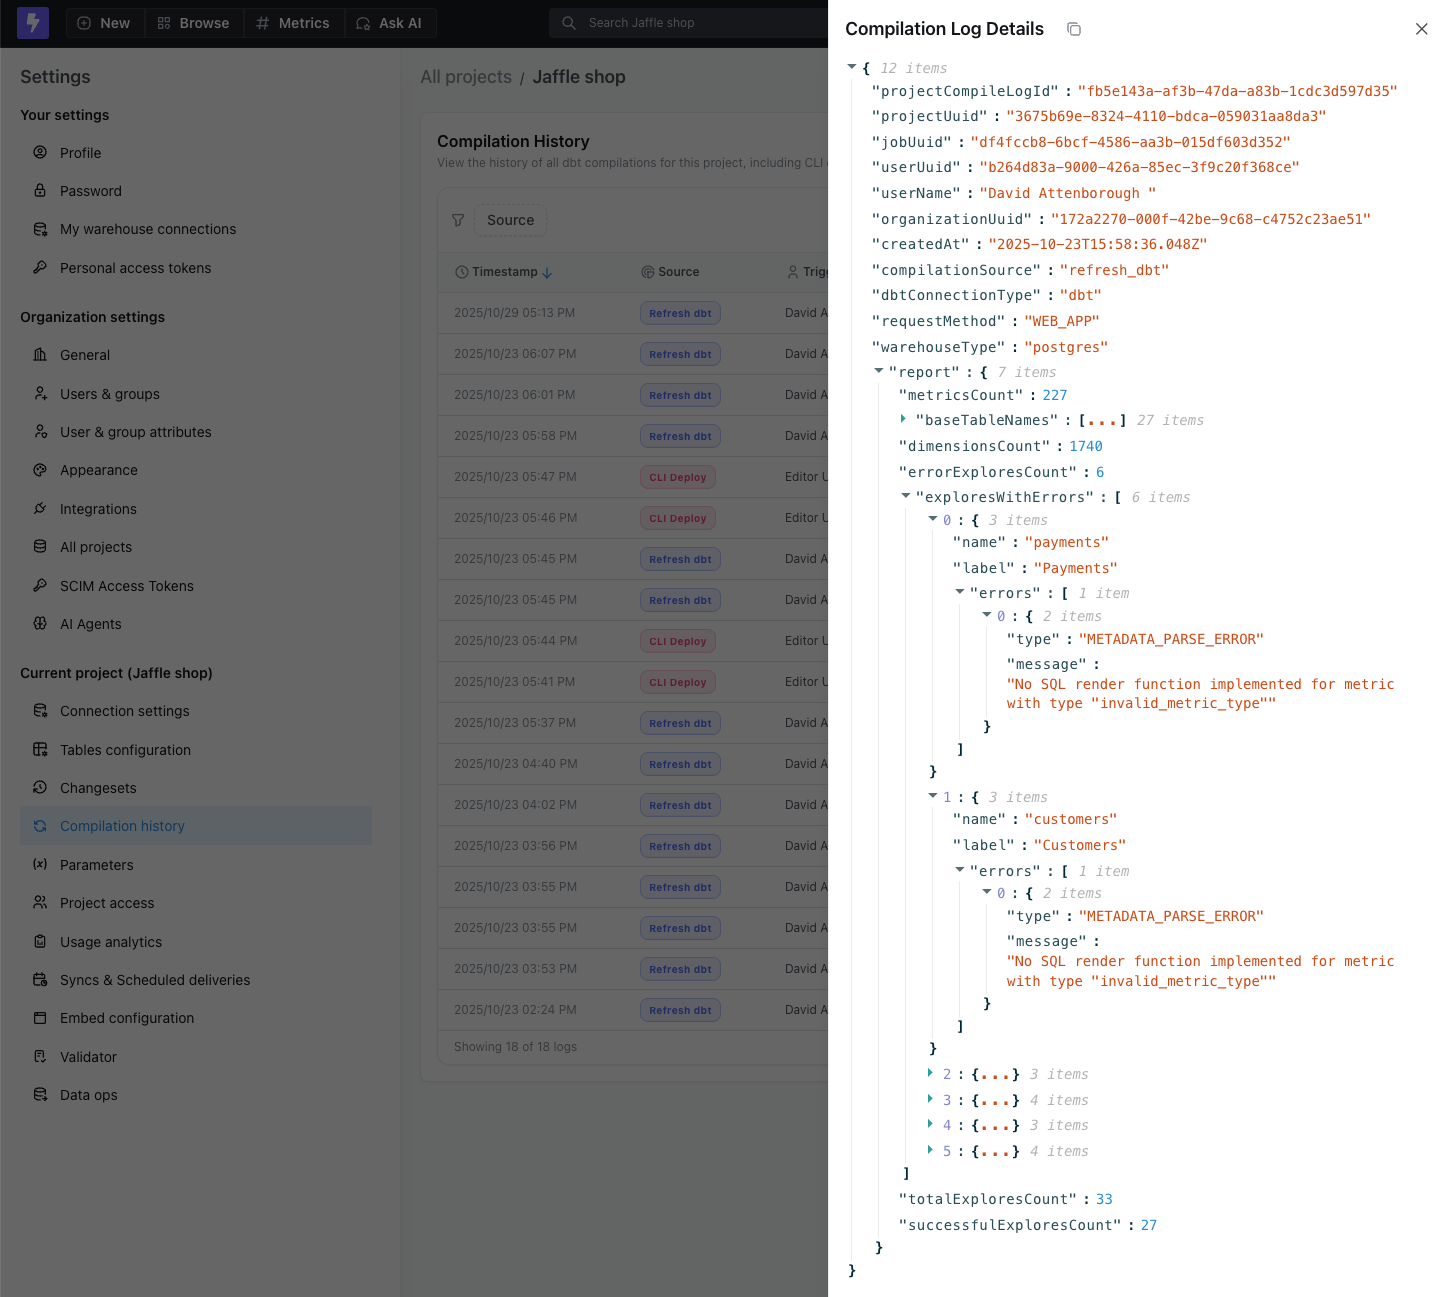
Viewing compilation details
Click on any log entry to view detailed information about that compilation, including:- User and trigger: Who initiated the compilation and how it was triggered
- Compilation report:
- Total counts of metrics, dimensions, and explores in your project
- List of dbt models included
- Number of successful explores vs. explores with errors
- Detailed error messages for any failed explores
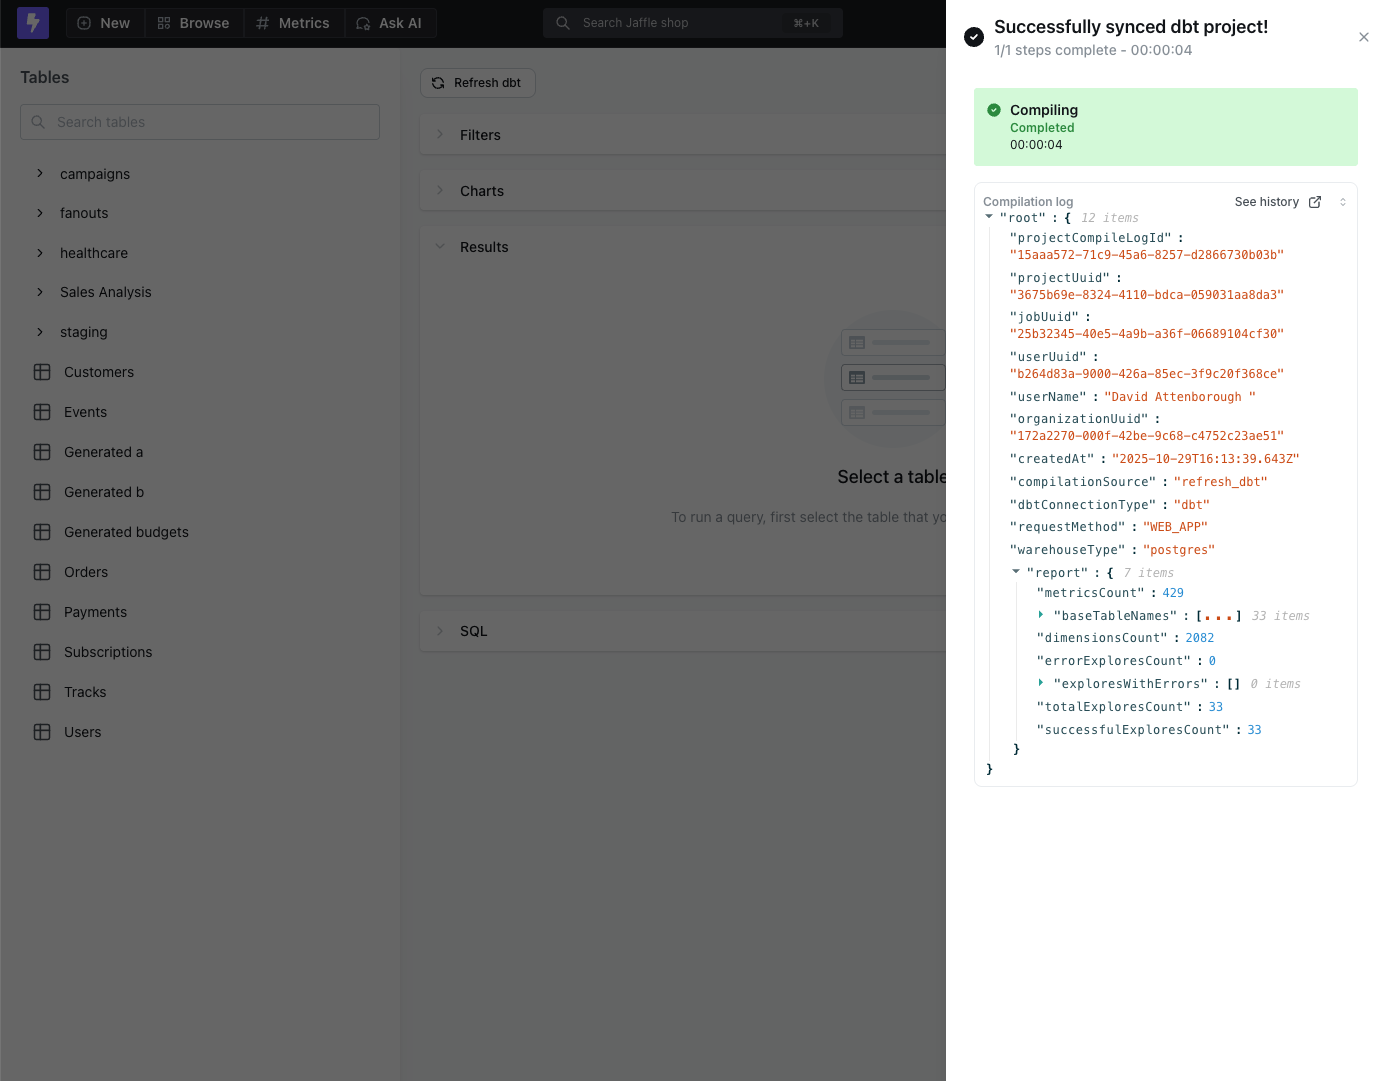
Viewing logs during dbt refresh
When you use theRefresh dbt button in the UI, the compilation log is displayed as the job finalizes. After the refresh completes, you can view the full compilation details directly in the job notification.
Common use cases
Troubleshooting compilation failures
When a compilation fails, use the logs to:- Identify when the failure occurred
- See which user or process triggered the compilation
- Review error messages and stack traces
- Compare with previous successful compilations to identify what changed
Monitoring deployment activity
Track when your project is deployed to production:- Monitor deployment frequency
- Identify who is making changes
- Verify that automated deployments are running as expected
- Audit changes for compliance requirements
Understanding project changes over time
Use compilation logs to:- Track the evolution of your semantic layer
- See when new metrics or dimensions were added
- Monitor the pace of project development
- Identify patterns in how your team works