Materialization status
The Materializations tab shows all your pre-aggregates and their current state.
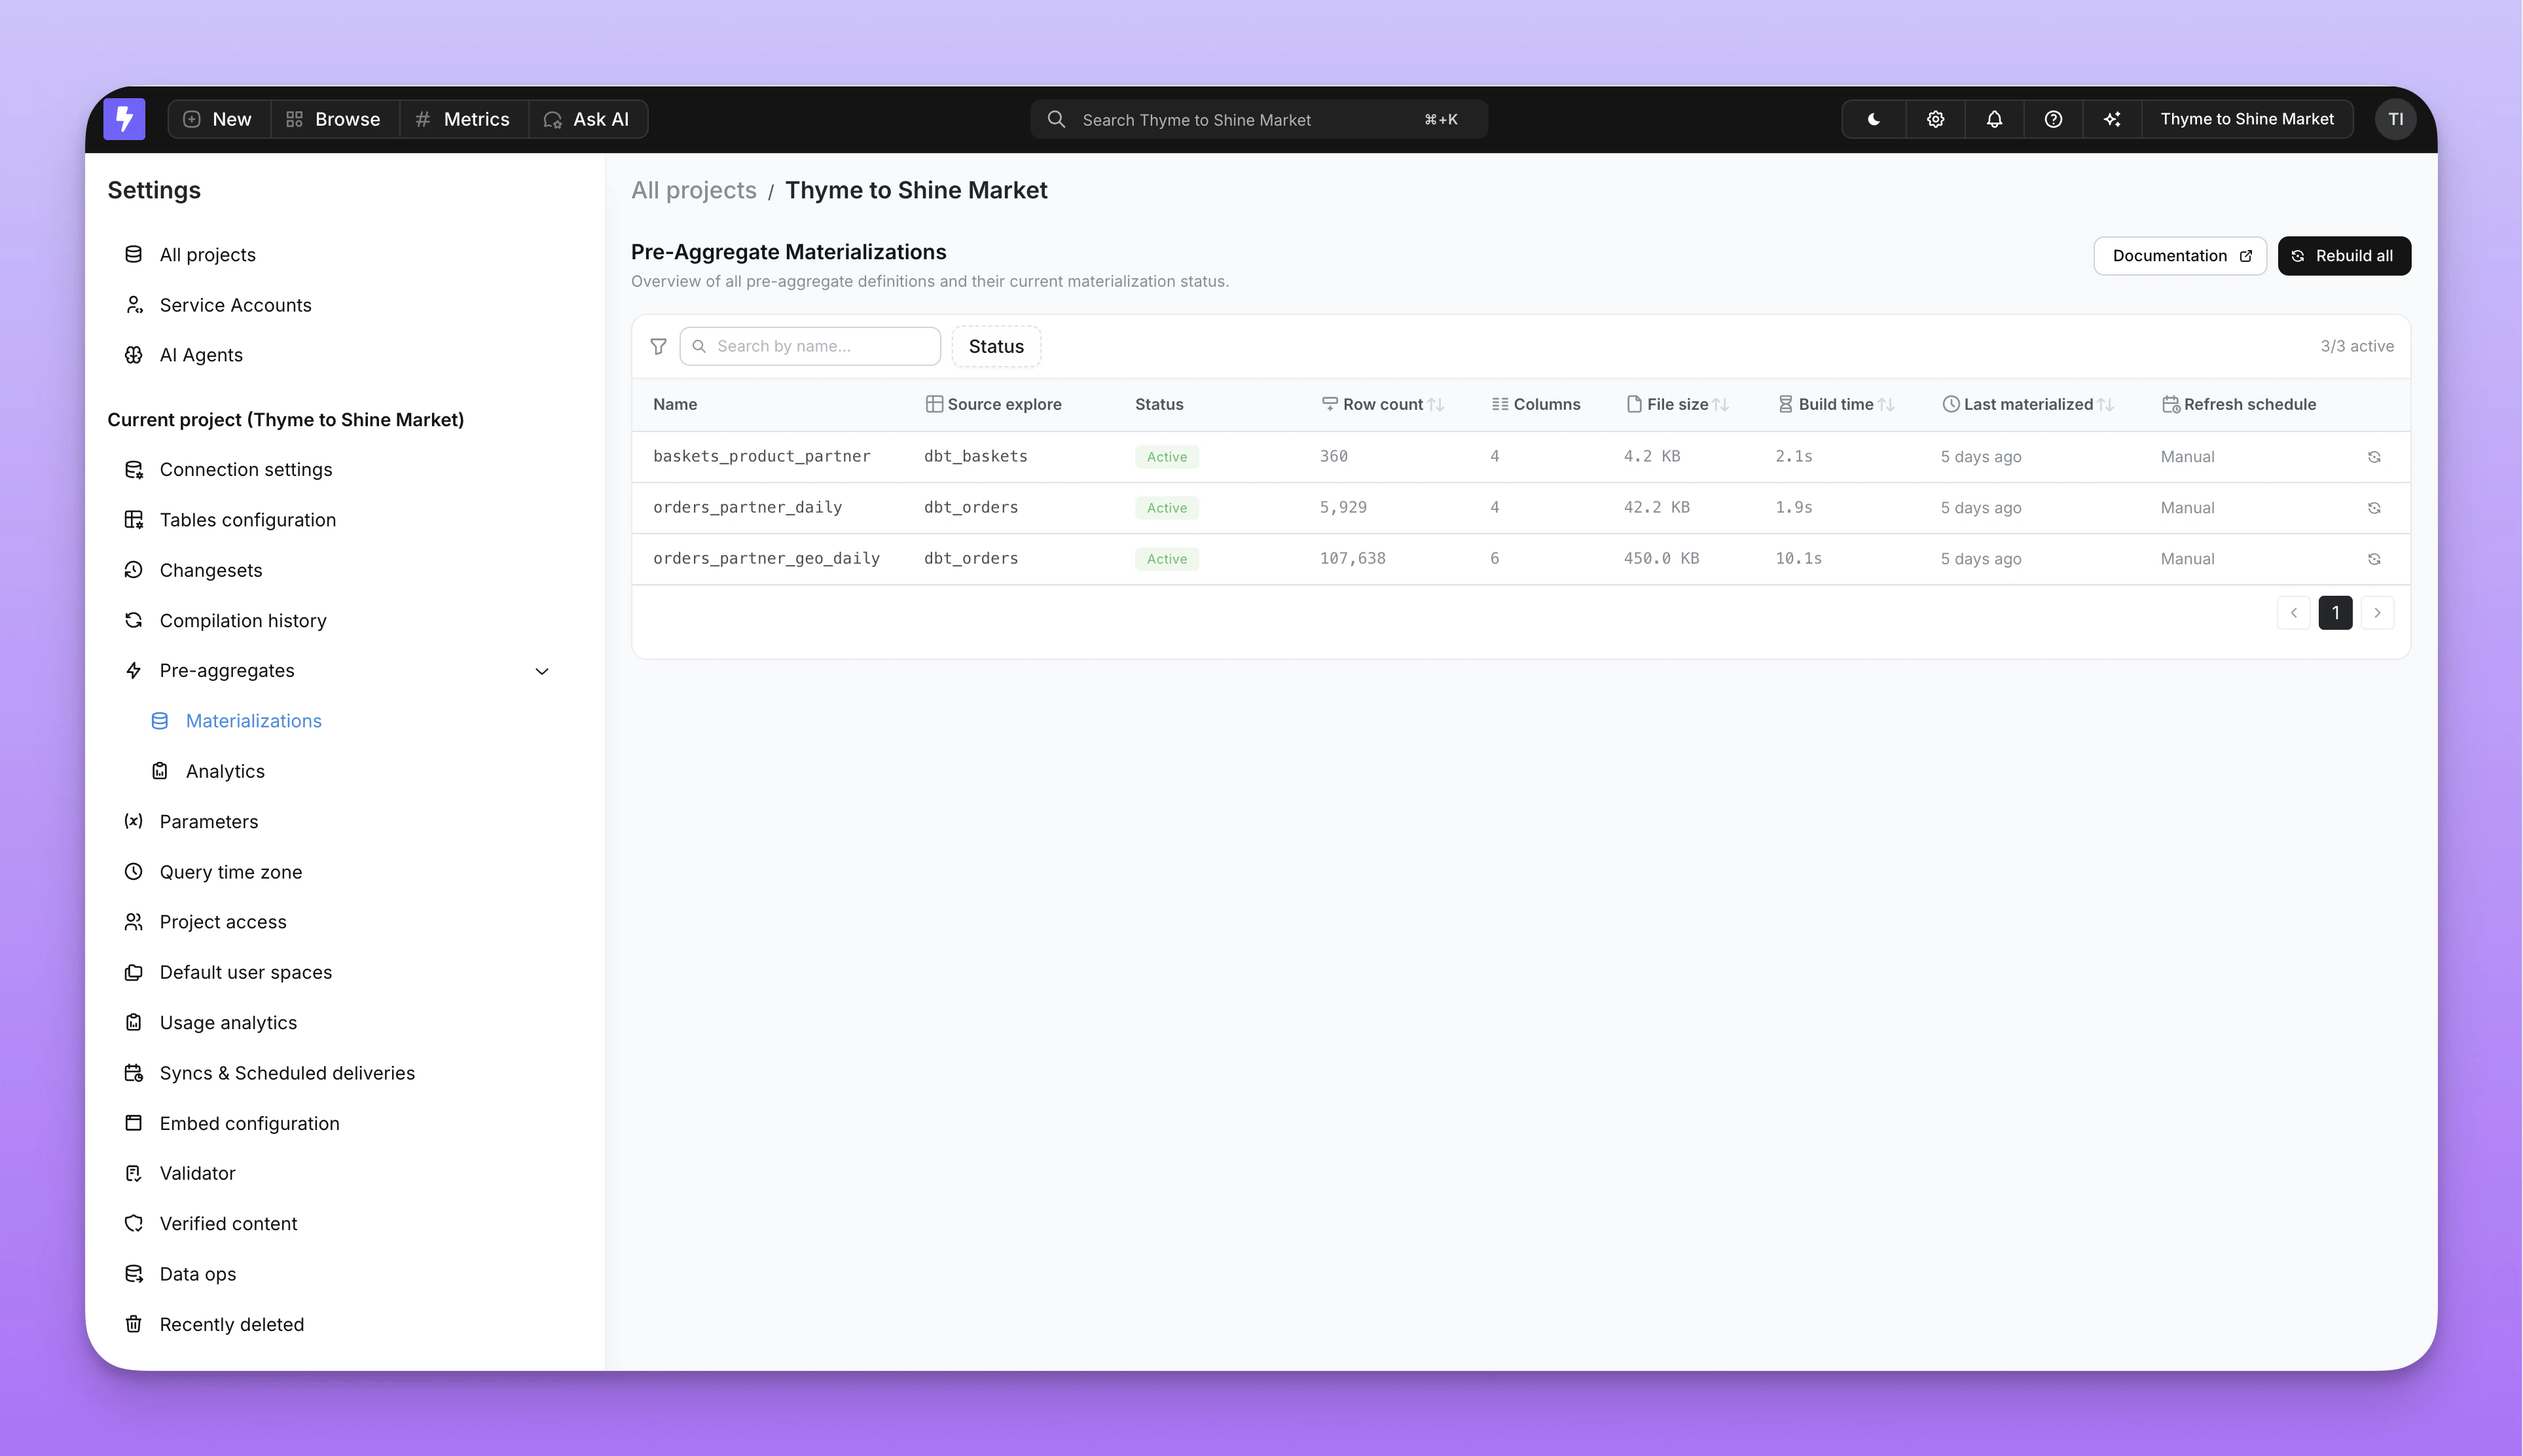
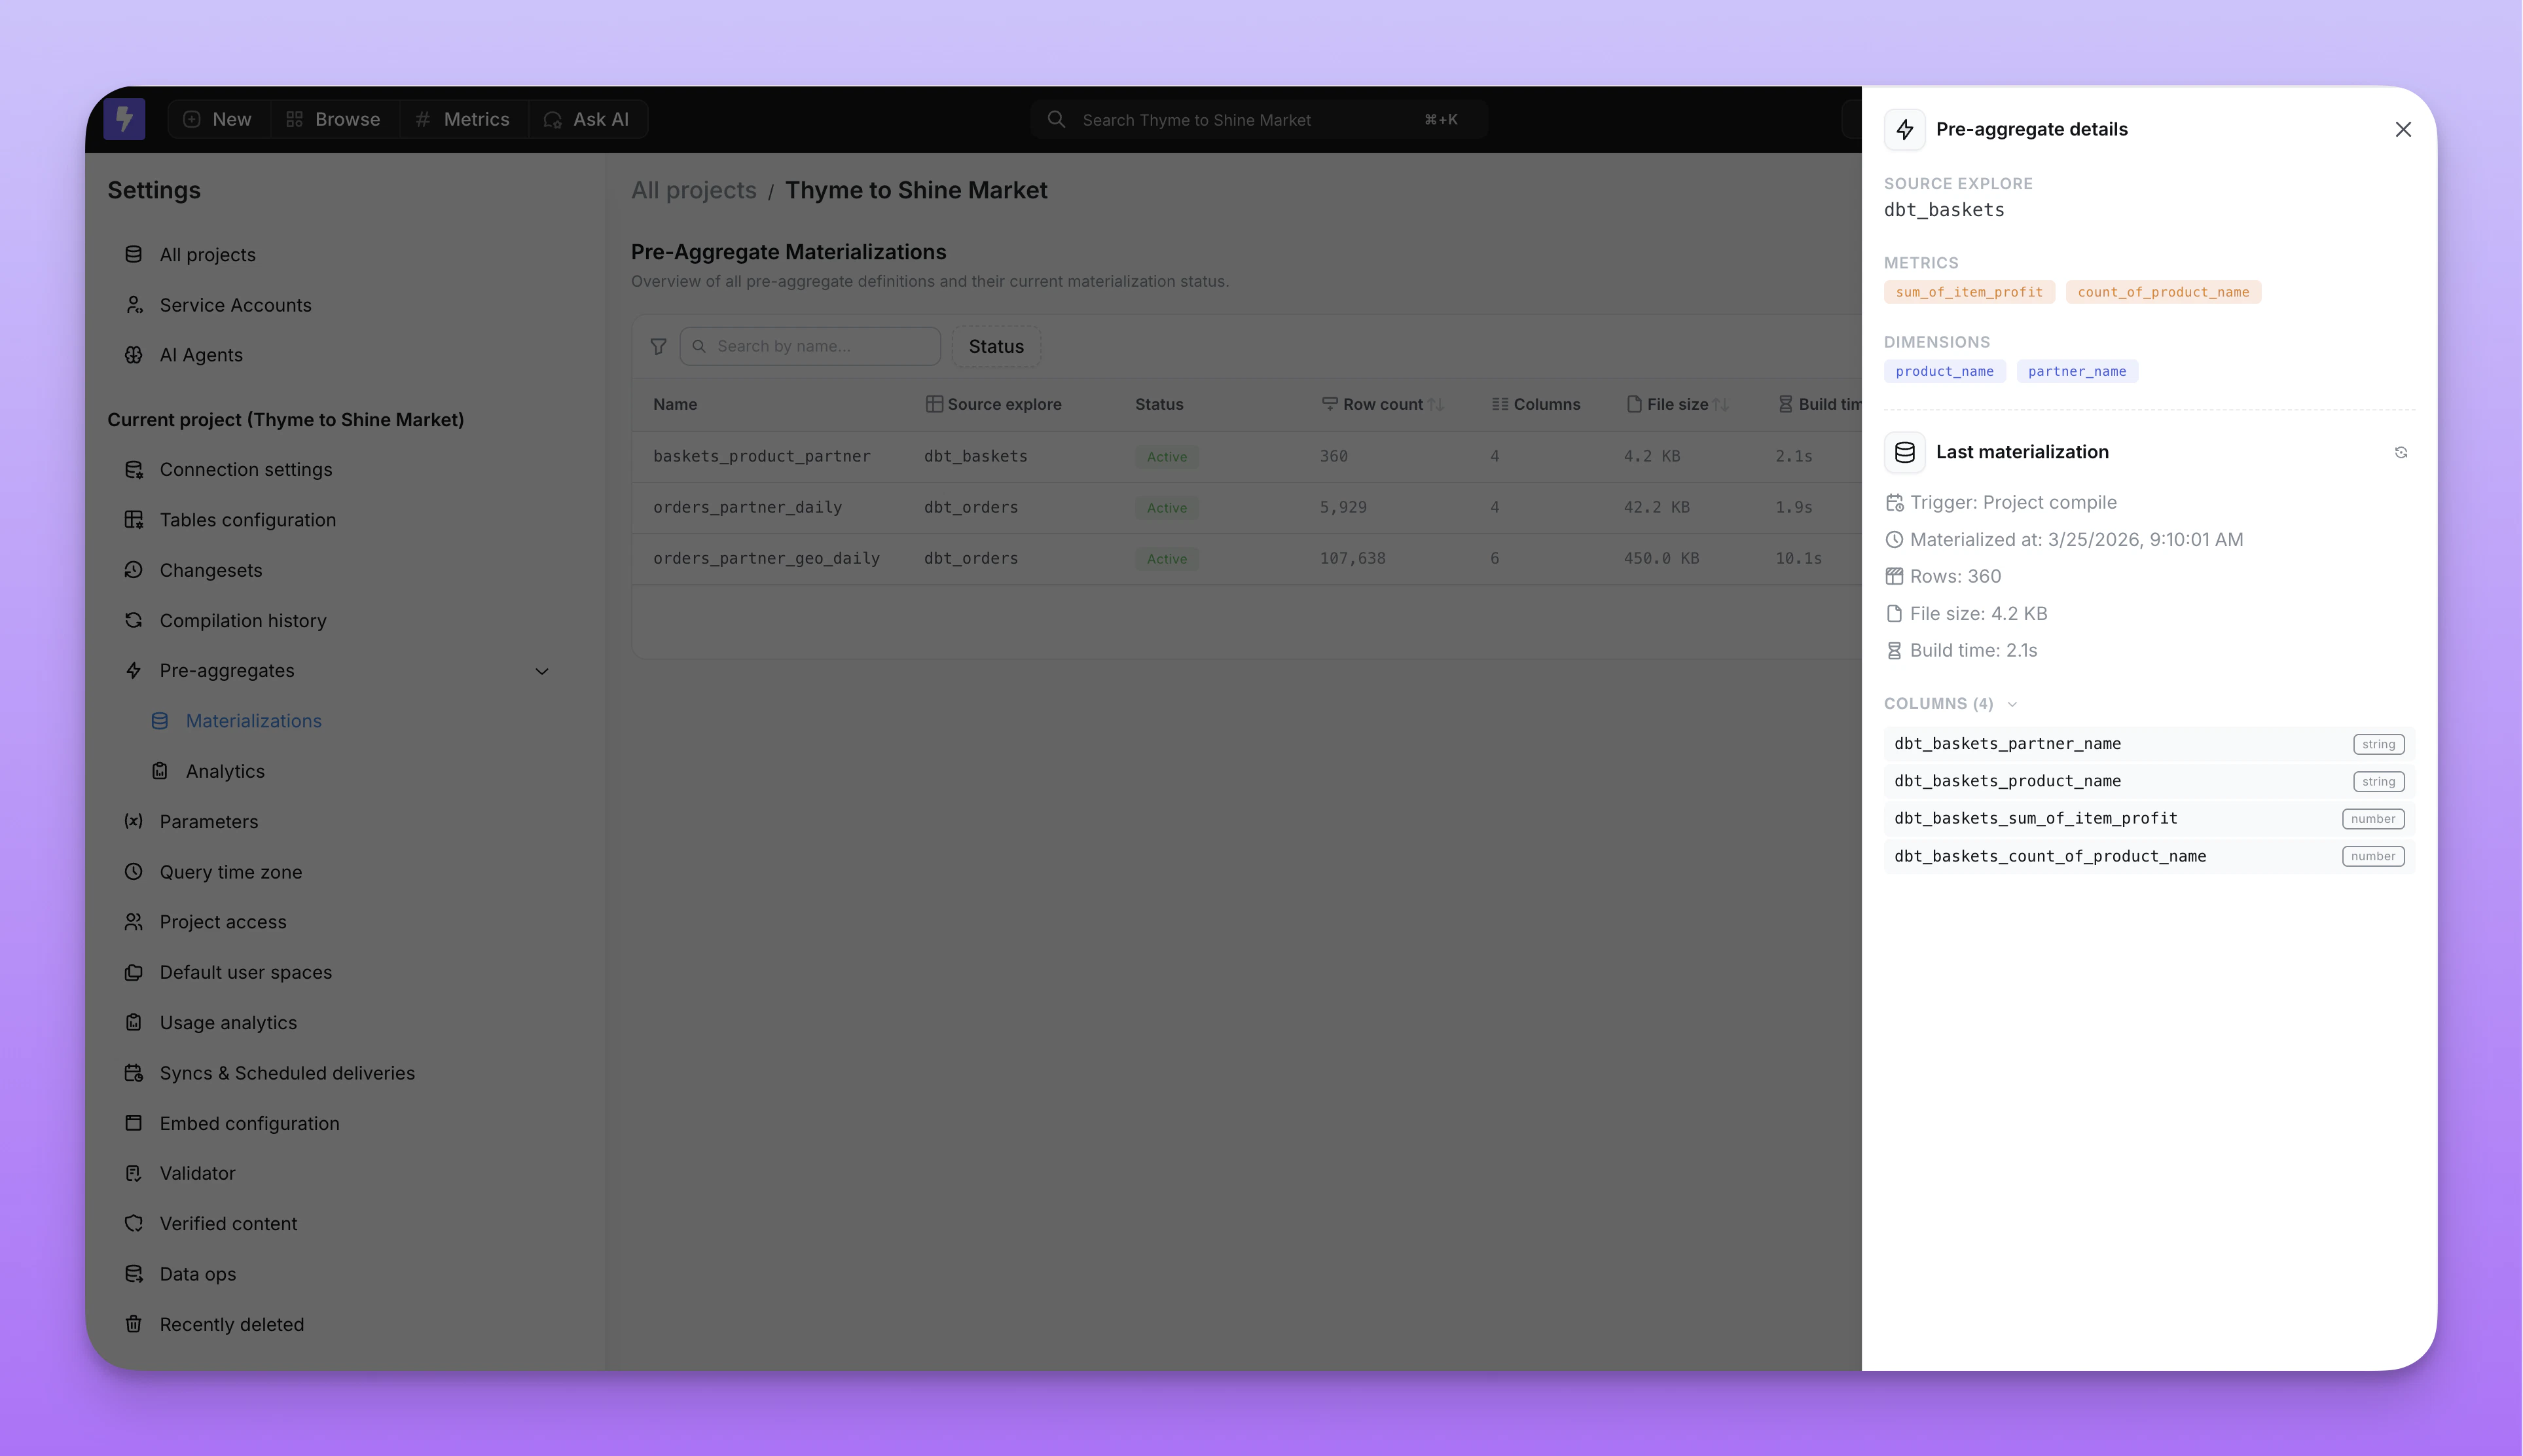
| Status | Meaning |
|---|---|
| Active | The materialization is live and serving matching queries. Only one materialization can be active per pre-aggregate at a time. |
| In progress | A new materialization is being built. The previous active materialization continues serving queries until the new one completes. |
| Failed | The materialization encountered an error. Check the error message for details. |

Hit and miss statistics
The Analytics tab tracks how often queries hit or miss pre-aggregates on a daily basis.
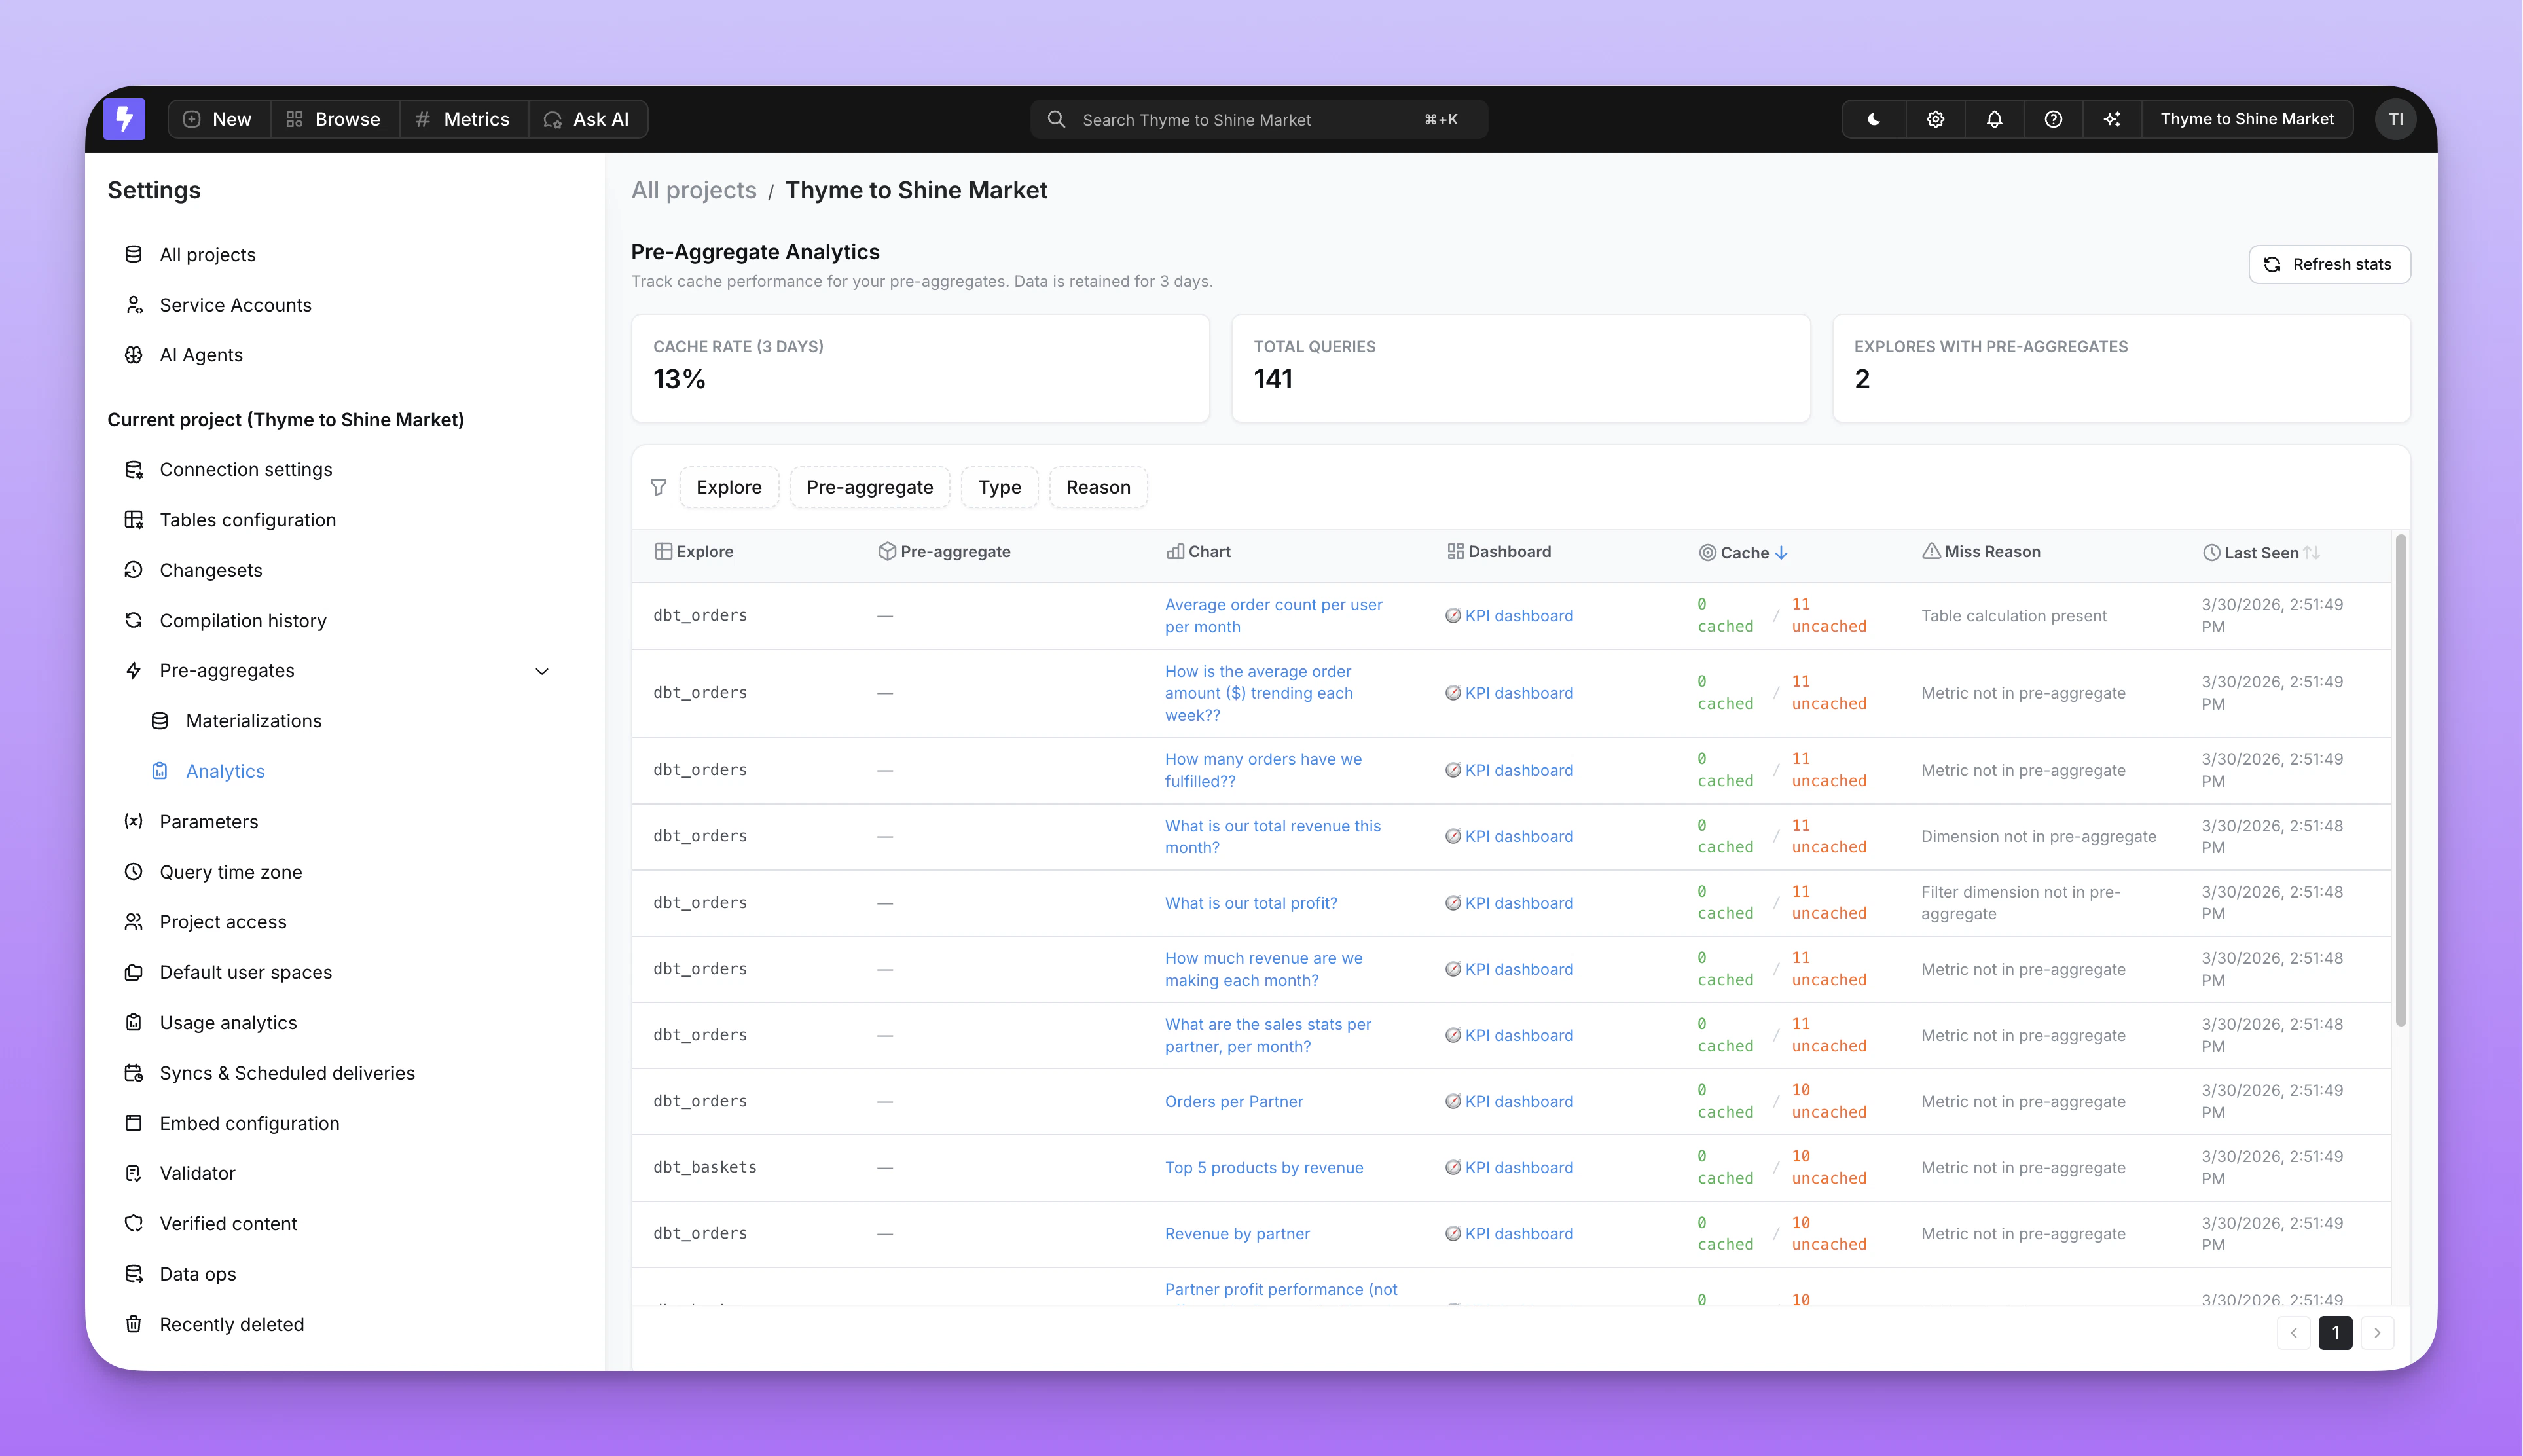
- Explore name — which explores are benefiting from pre-aggregates
- Query context — whether the query came from a chart, dashboard, or the explorer
- Chart or dashboard — which specific saved content is hitting or missing
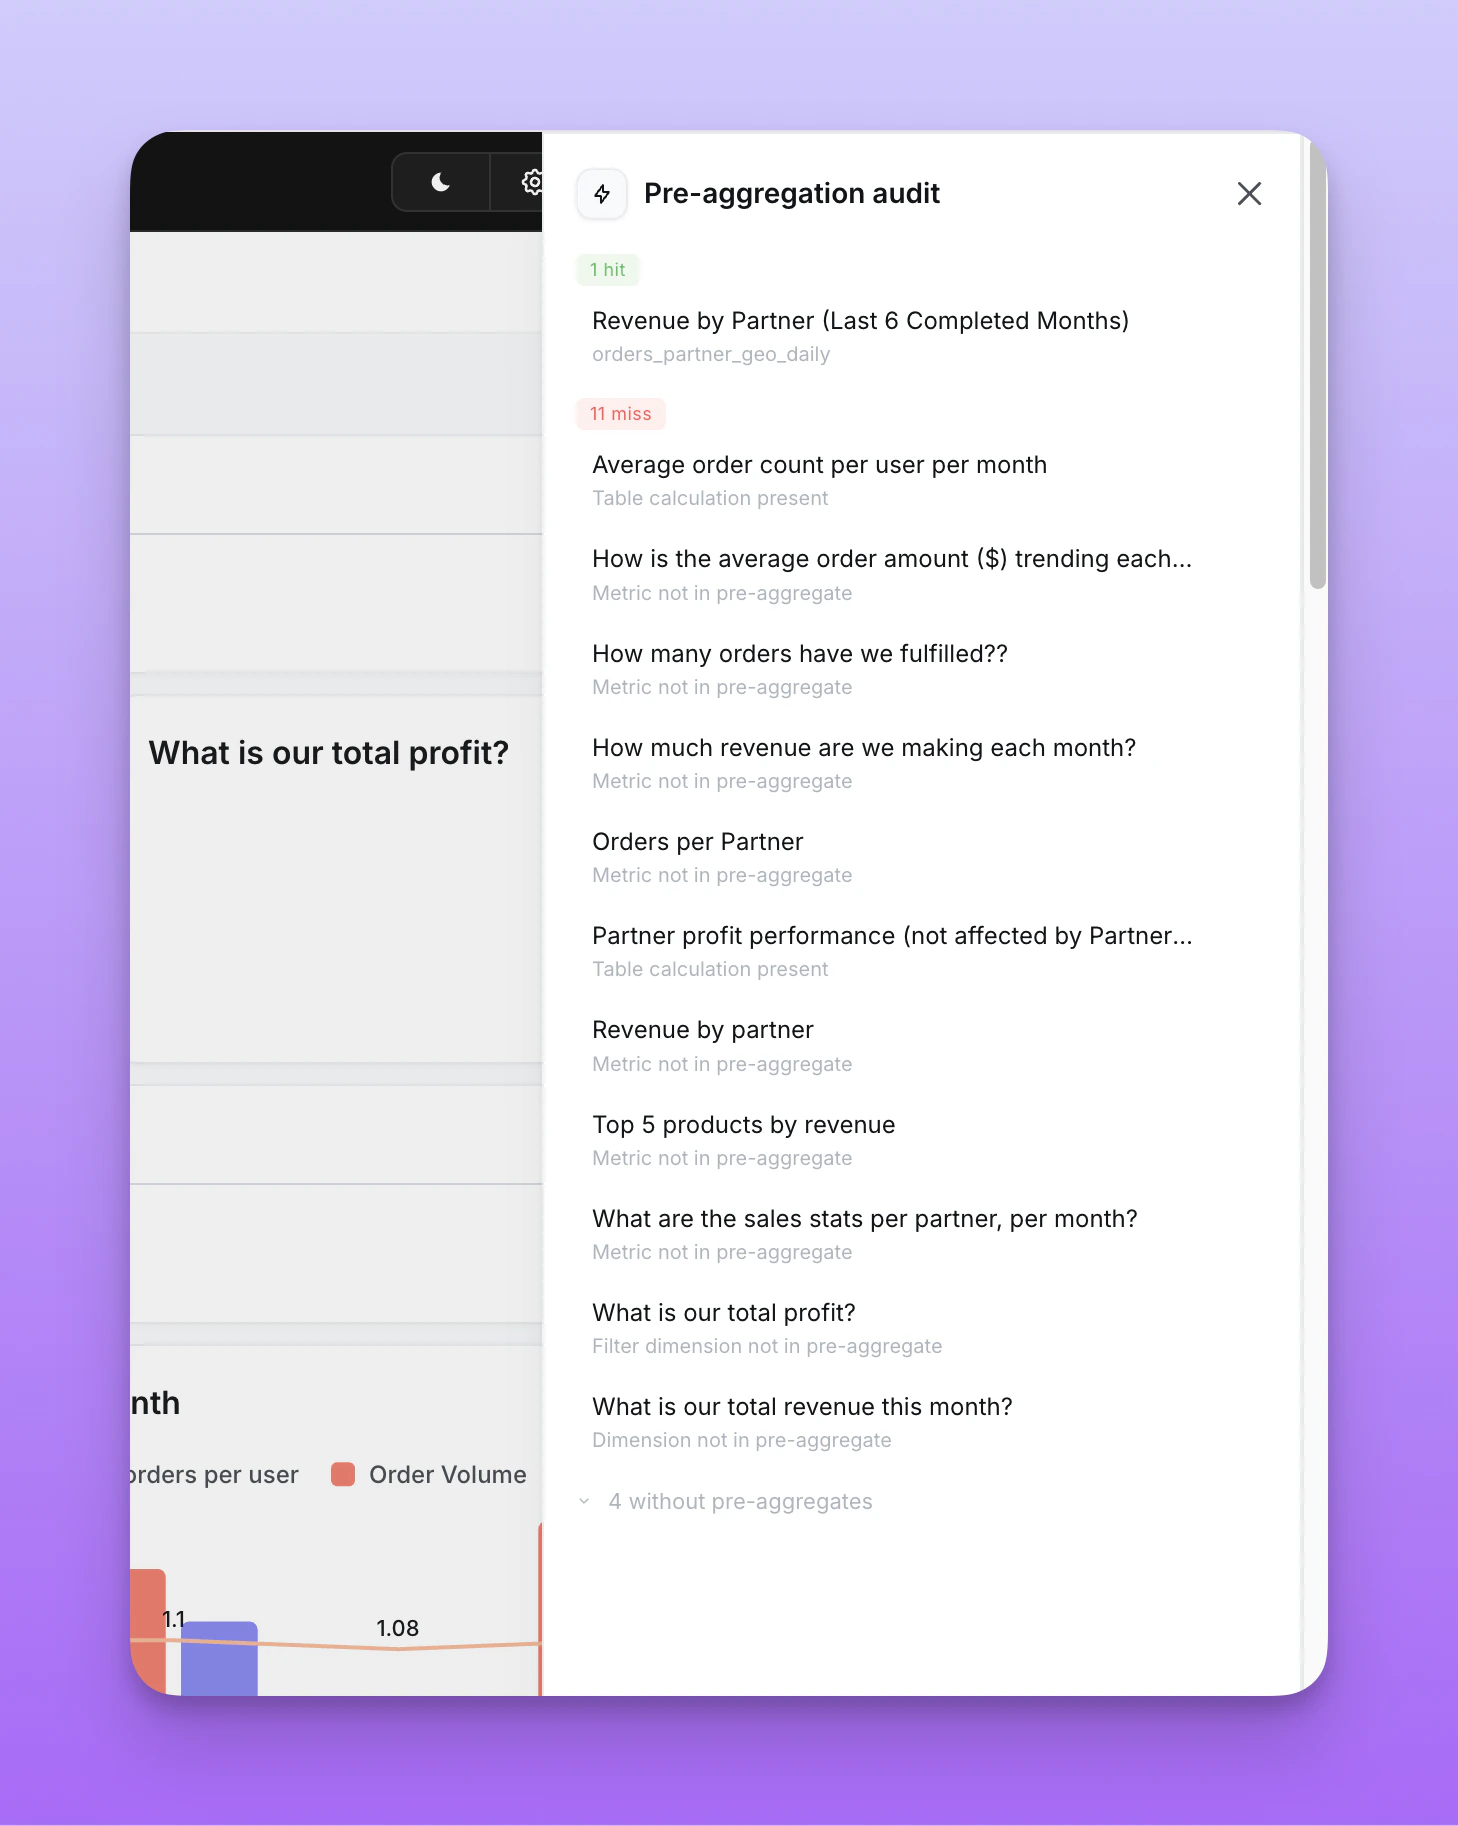
Why a query misses a pre-aggregate
When a query doesn’t match any pre-aggregate, Lightdash records the specific reason. Understanding these reasons helps you decide whether to adjust your pre-aggregate definition or accept the warehouse query.| Miss reason | What it means | How to fix it |
|---|---|---|
| No pre-aggregates defined | The explore has no pre-aggregates configured. | Add a pre_aggregates block to your dbt model. |
| Dimension not in pre-aggregate | The query includes a dimension not covered by any pre-aggregate. | Add the missing dimension to your pre-aggregate’s dimensions list. |
| Metric not in pre-aggregate | The query includes a metric not covered by any pre-aggregate. | Add the missing metric to your pre-aggregate’s metrics list. |
| Filter dimension not in pre-aggregate | A filter references a dimension not in the pre-aggregate. | Add the filter dimension to the dimensions list — even if it’s only used for filtering, not grouping. |
| Non-additive metric | The query includes a metric type that can’t be re-aggregated (for example, count_distinct or median). | This metric type is not supported. See supported metric types. |
| Custom SQL metric | A metric uses a custom SQL expression. | Custom SQL metrics are not supported by pre-aggregates. |
| Granularity too fine | The query requests a finer time granularity than the pre-aggregate provides (for example, hour on a day pre-aggregate). | Either lower the pre-aggregate’s granularity or accept the warehouse query for this use case. |
| Custom dimension present | The query uses a custom dimension. | Custom dimensions are not supported by pre-aggregates. |
| Custom metric present | The query uses a custom metric. | Custom metrics are not supported by pre-aggregates. |
| Table calculation present | The query includes table calculations. | Table calculations are not supported by pre-aggregates. |
| User bypass | The user explicitly bypassed the pre-aggregate cache. | No action needed — this is intentional. |
Dashboard pre-aggregate view
You can also monitor and manage pre-aggregates directly from any dashboard. Open the dashboard menu to access pre-aggregate options.
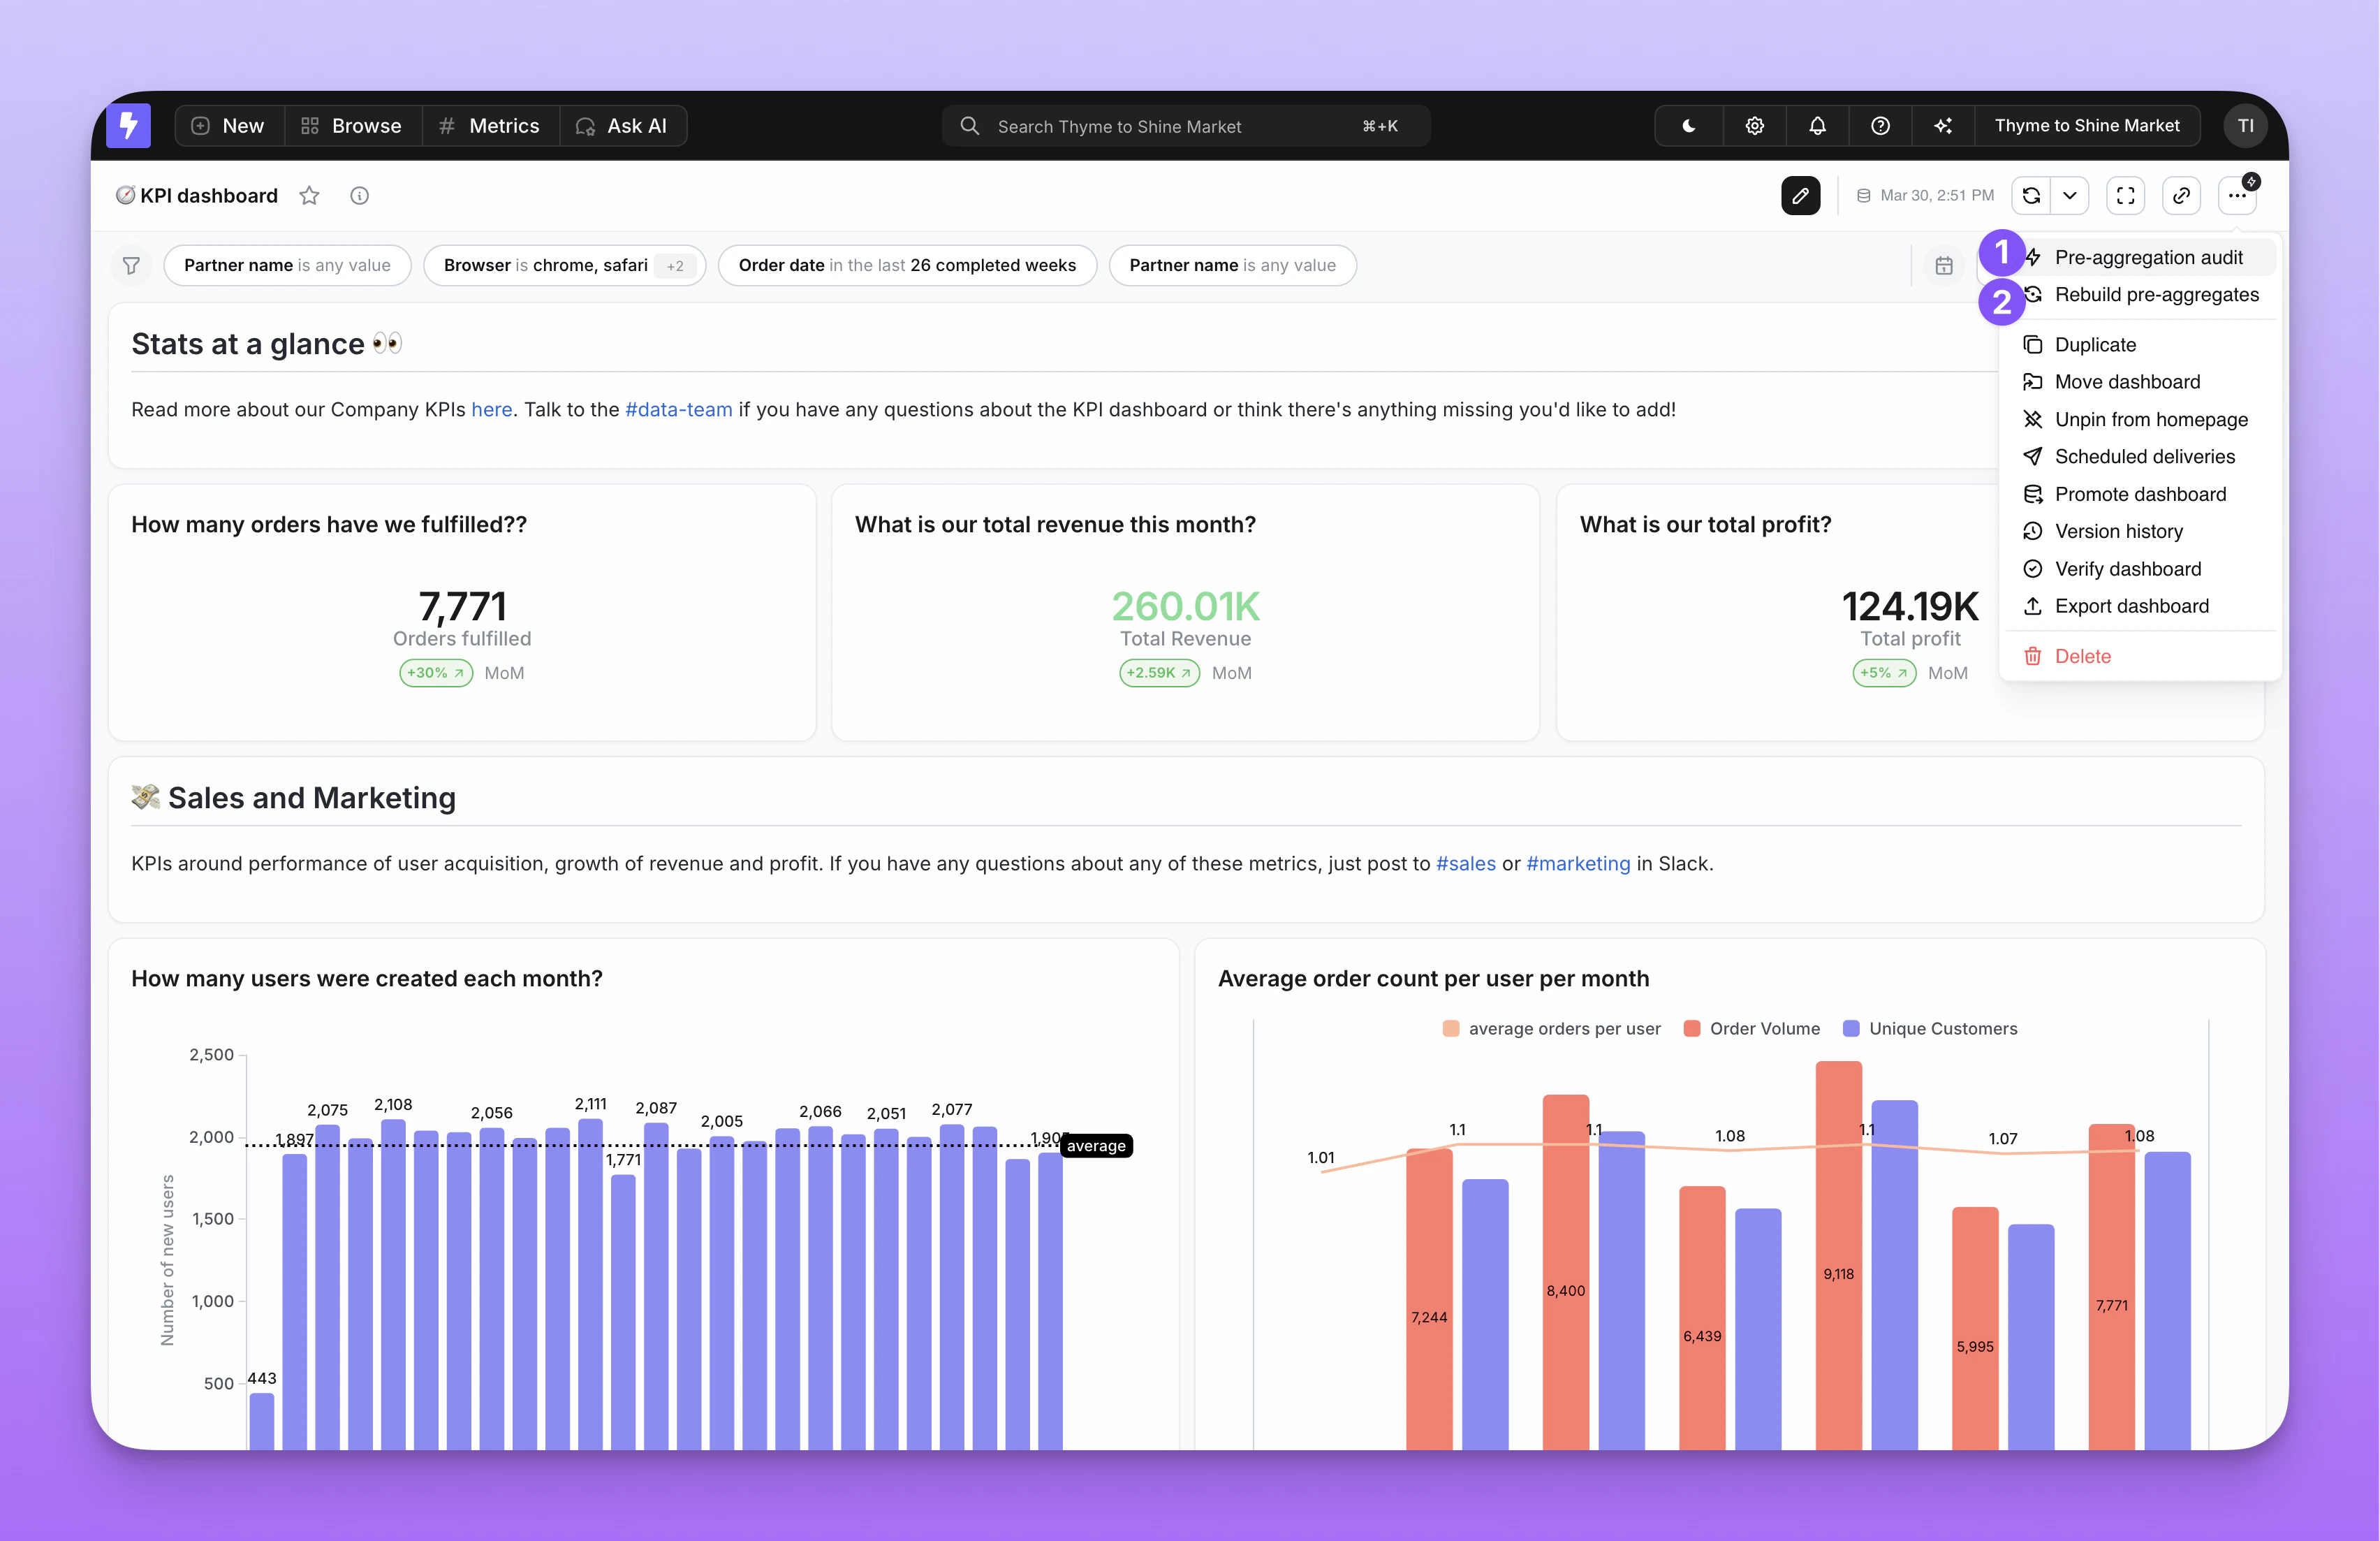
- Pre-aggregation audit — Shows which tiles in the dashboard are hitting or missing pre-aggregates, and why. Available to editors, developers, and admins.
- Rebuild pre-aggregates — Triggers a manual re-materialization for the pre-aggregates used by this dashboard. Available to developers and admins only.
