

Temporary filters
A temporary filter applies only to your session: you won’t change the dashboard for anyone else who comes to look at it. To make a filter stick for everyone, use a saved filter.To restrict access to temporary filters, hide the
Add filters button on a dashboard. In edit mode, toggle the eye icon next to the Add filters dropdown. When hidden, viewers are restricted to the filters set up in dashboard edit mode.- Open your dashboard.
- Click
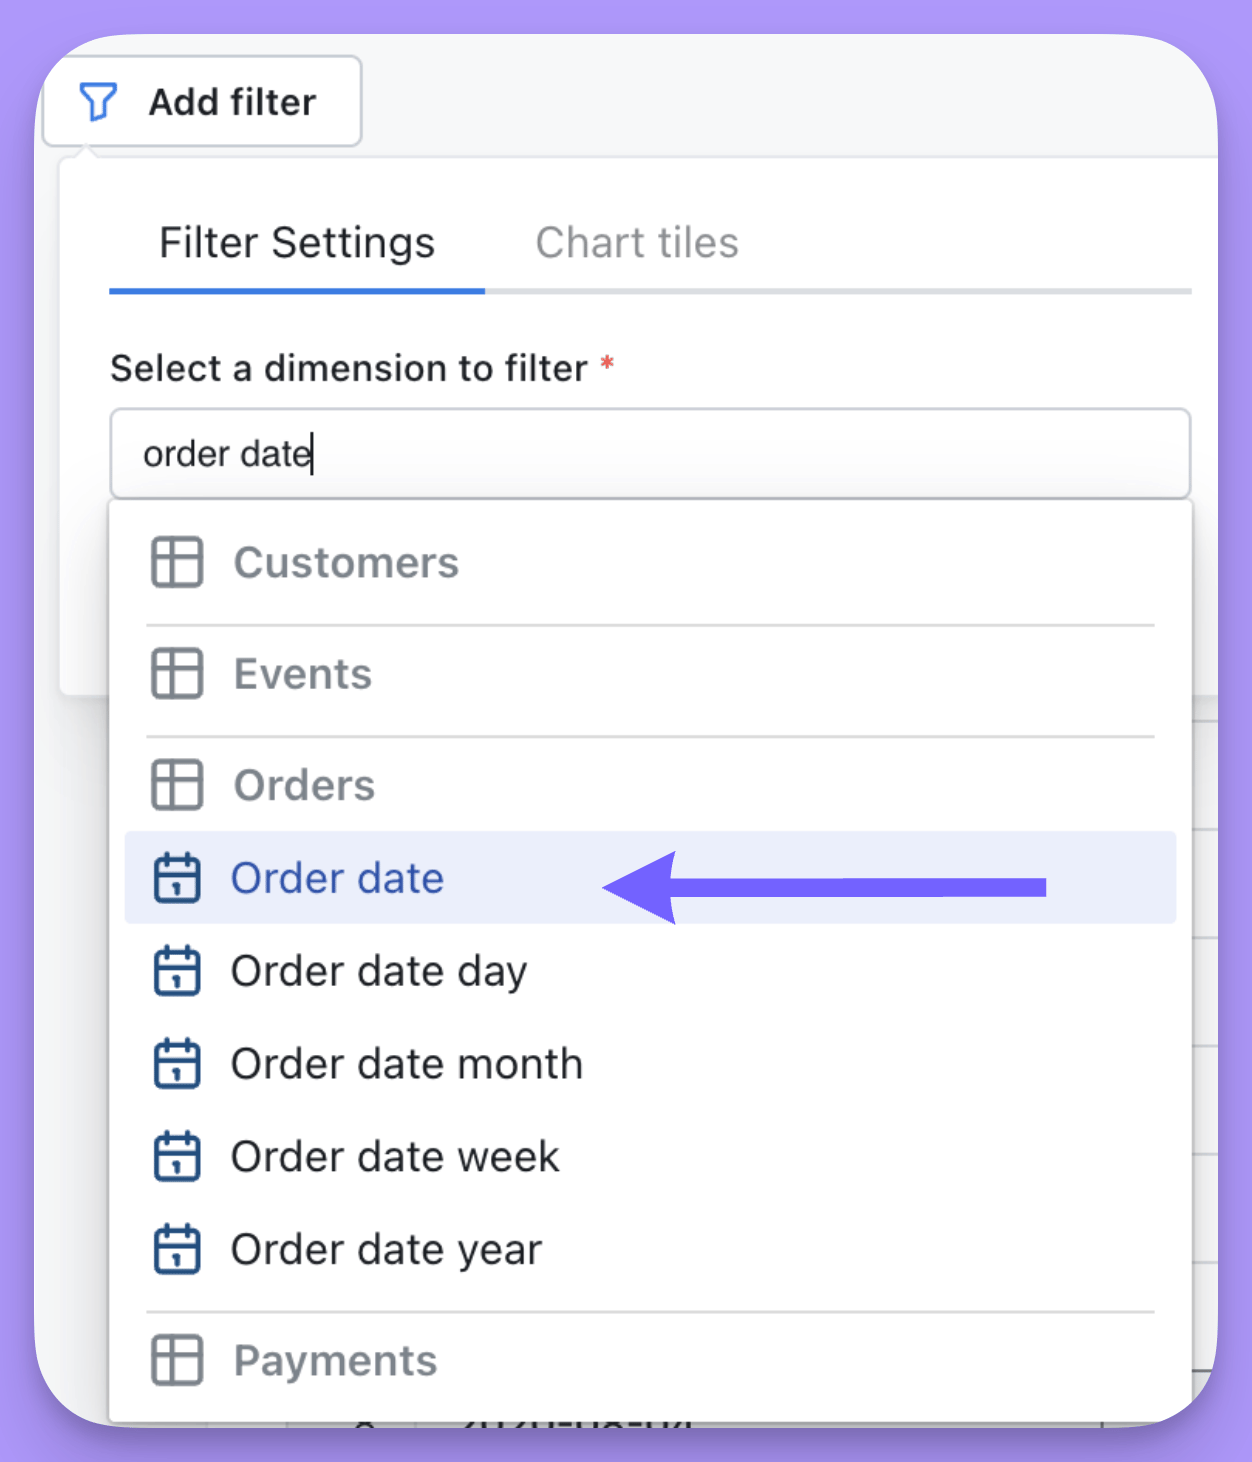
Add filter, then specify the field to filter on and the value to filter by.
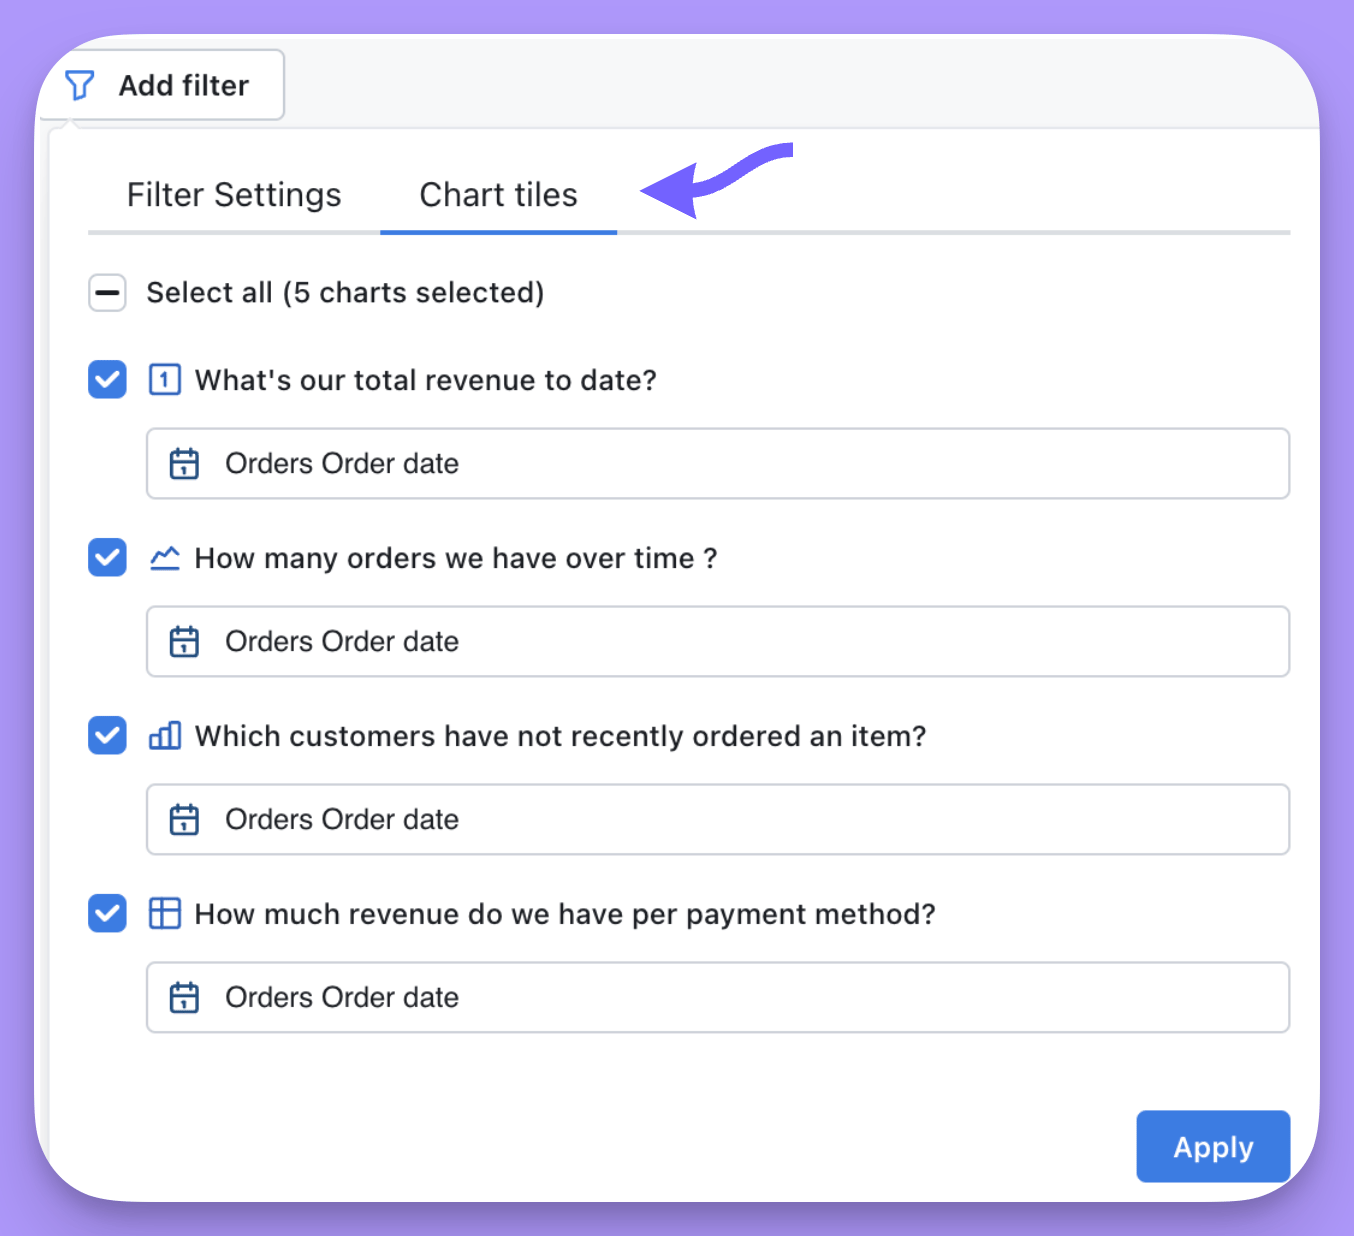
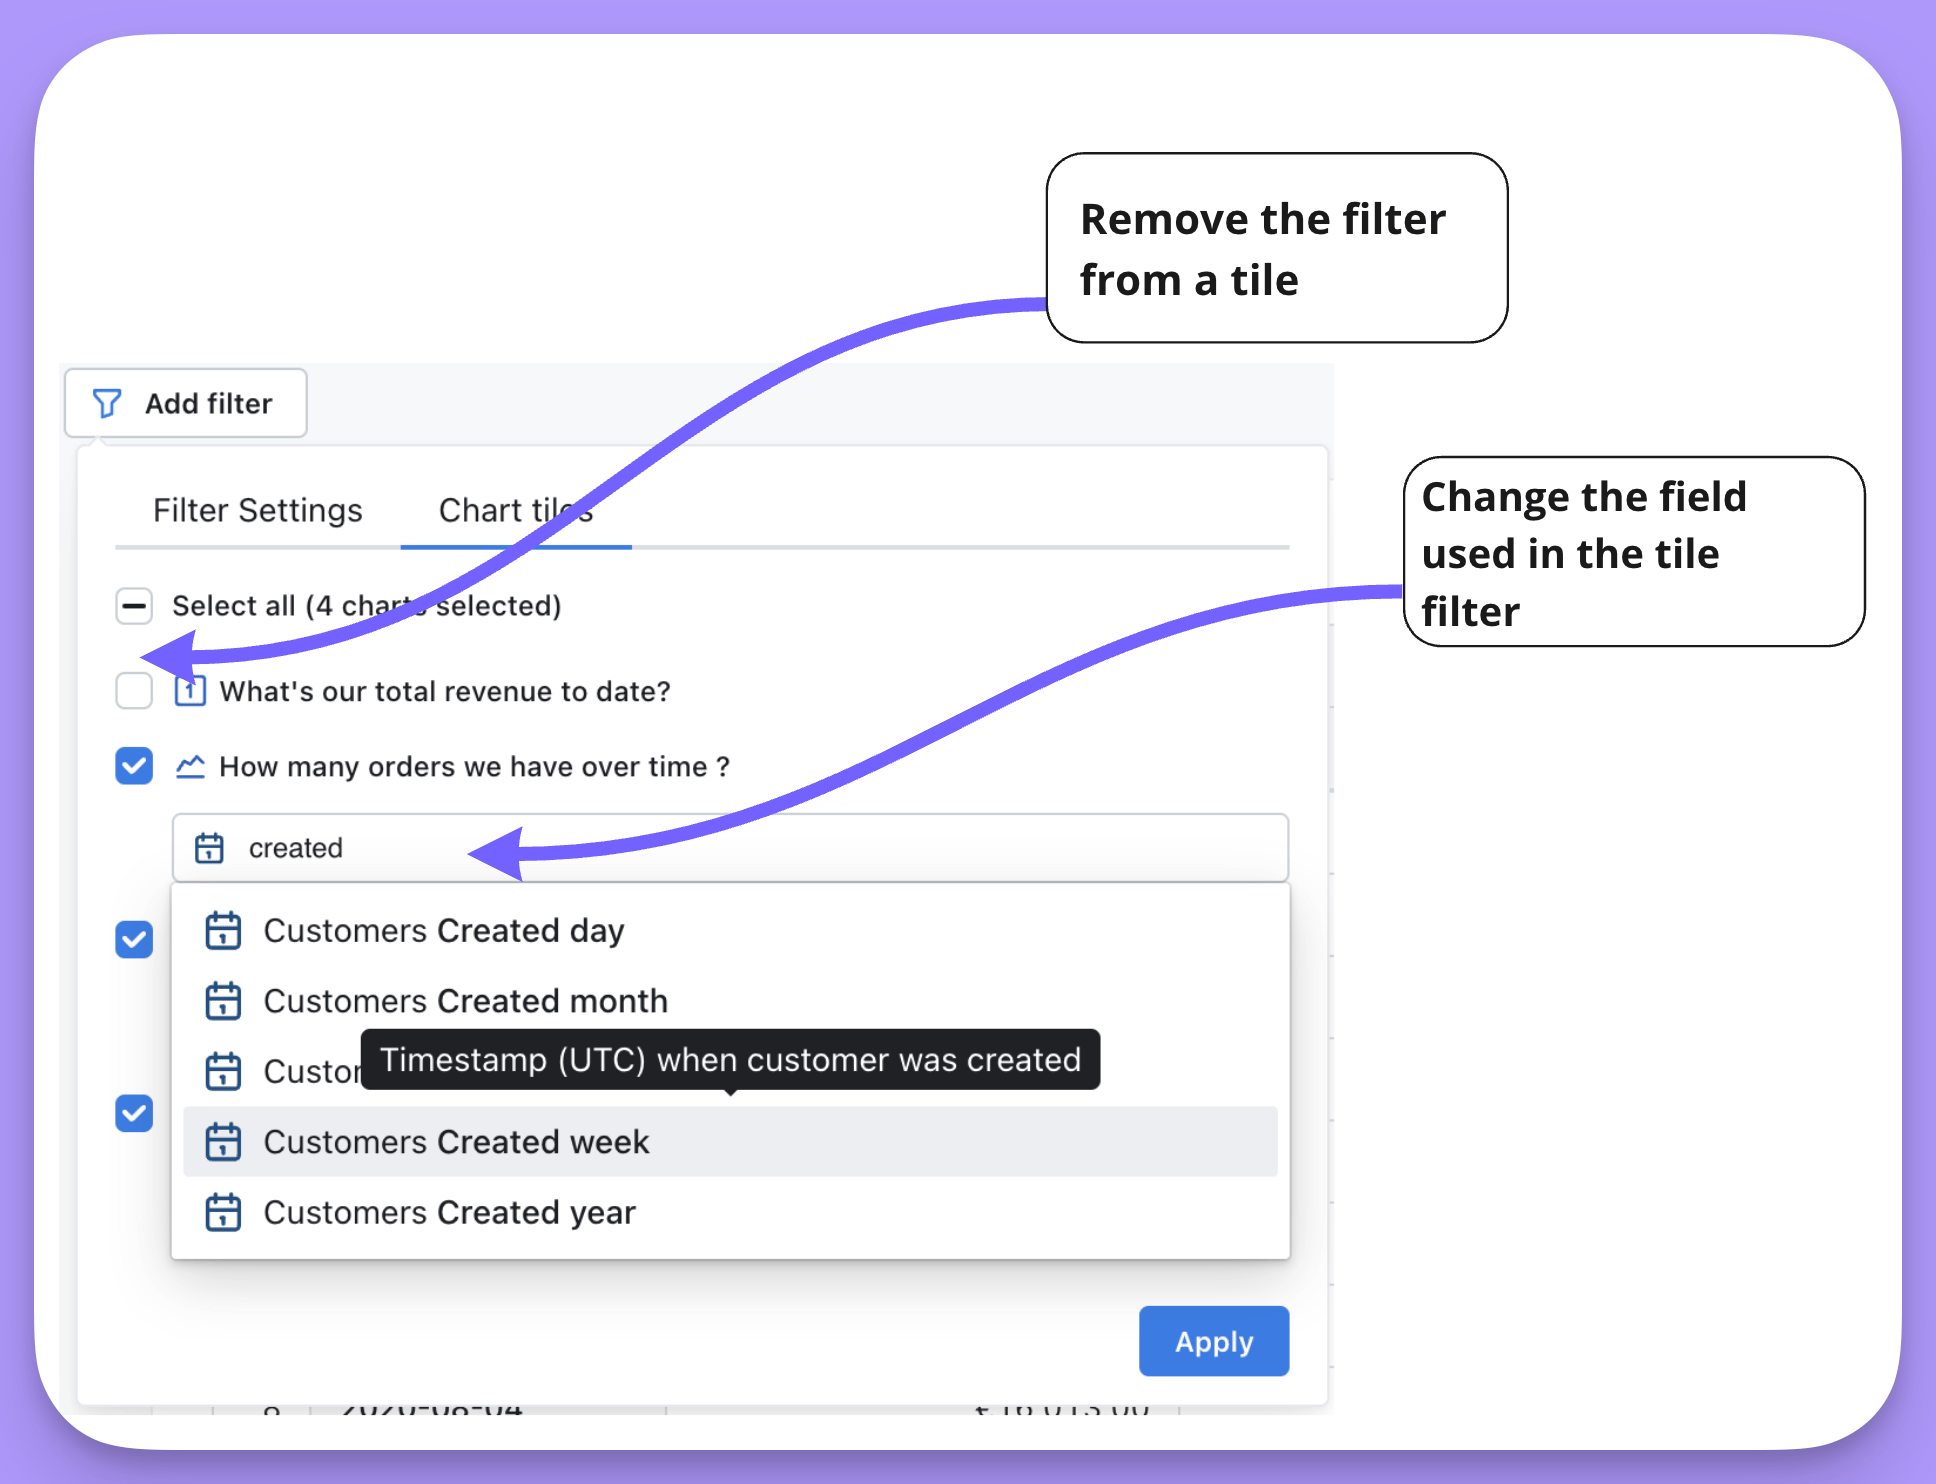
- To adjust which tiles the filter applies to, open the
Tilestab.
- Your filters appear at the top of the dashboard.

Values for temporary and overridden saved filters are reverted when entering dashboard edit mode.
Saved filters
A saved filter is part of the dashboard: anyone who opens it sees the filter applied.- Open your dashboard.
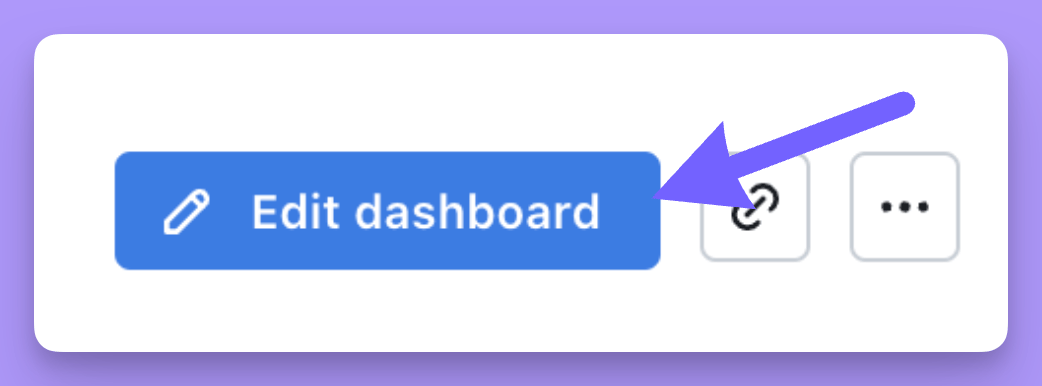
- Make sure you’re in edit mode — if you’re not, you’ll see the
Edit dashboardbutton.
- Click
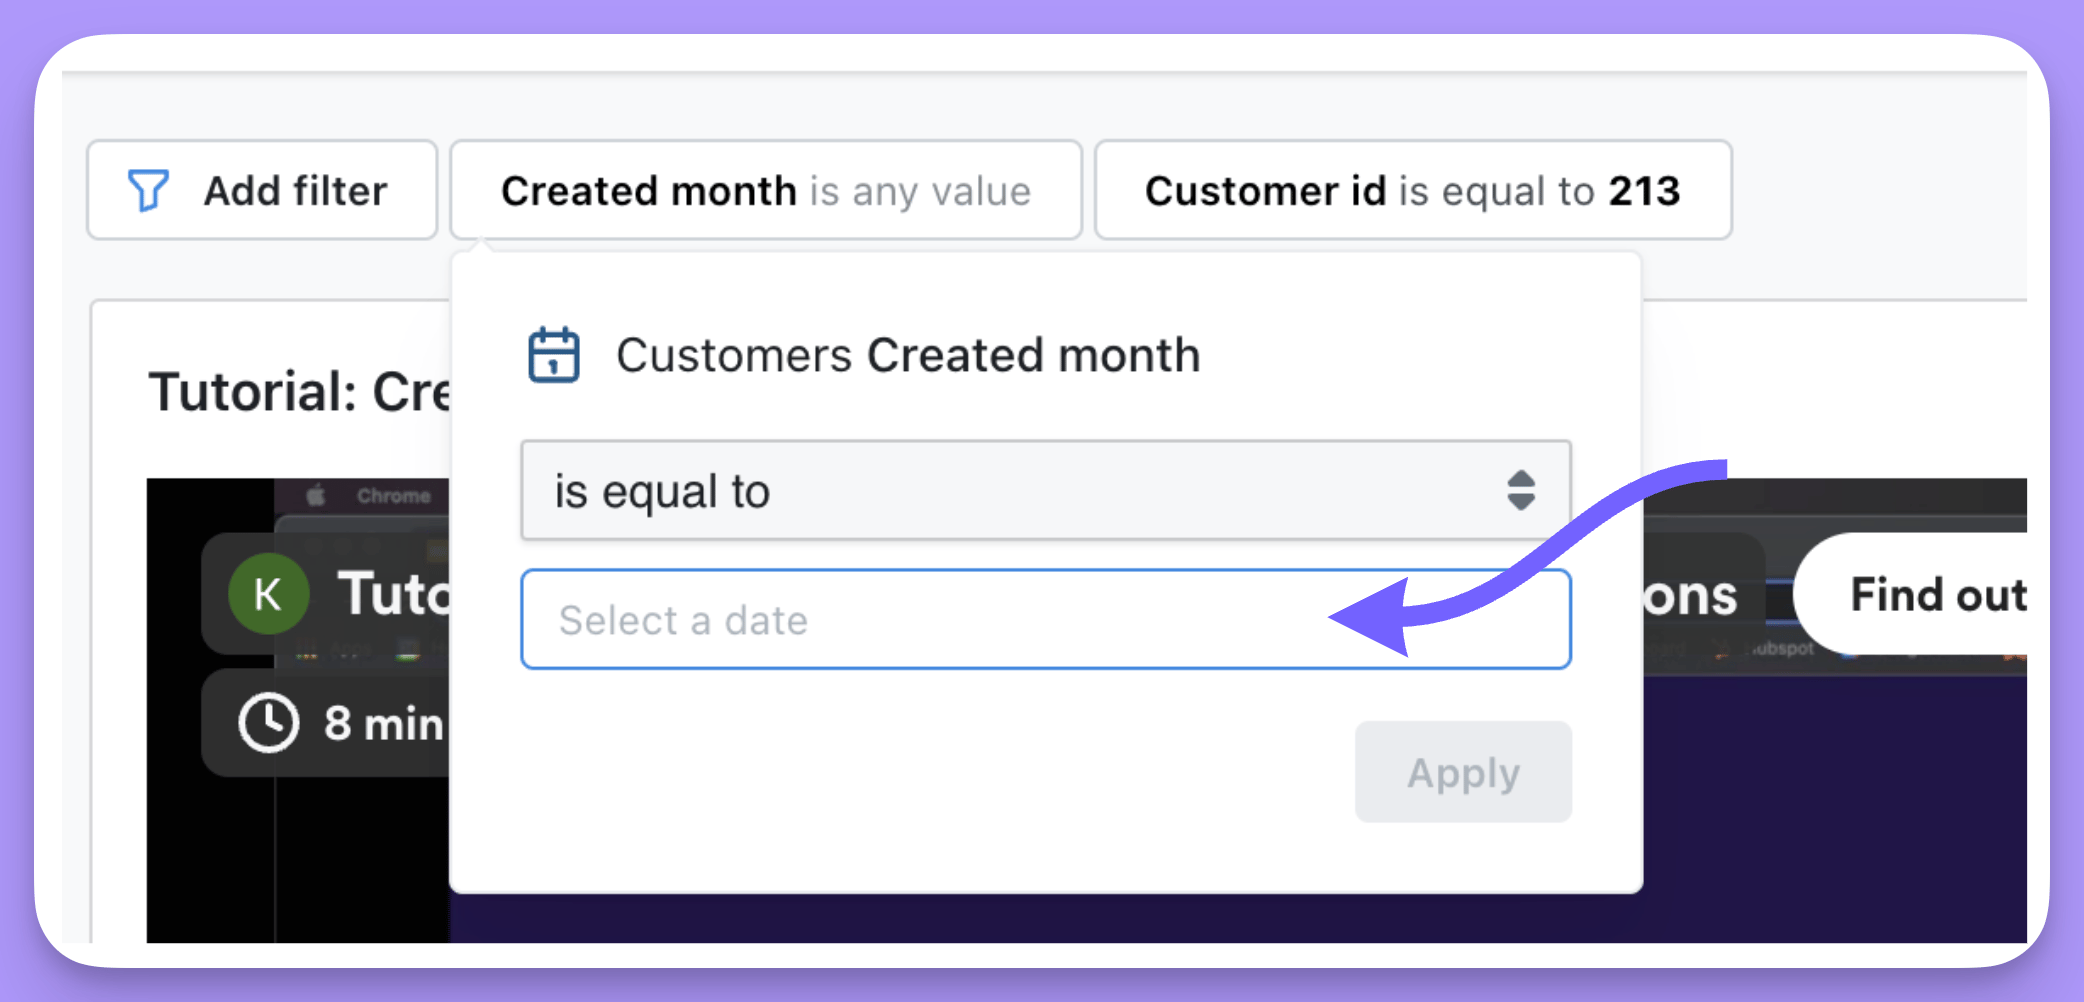
Add filter, then specify the dimension or metric to filter on.
- Leave the value blank, or specify one.
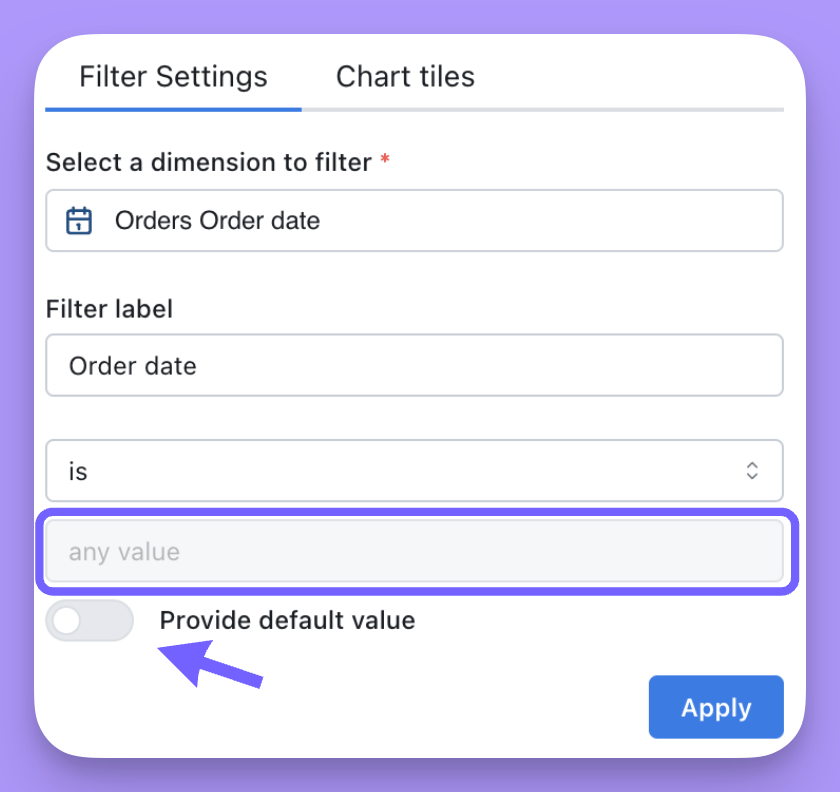
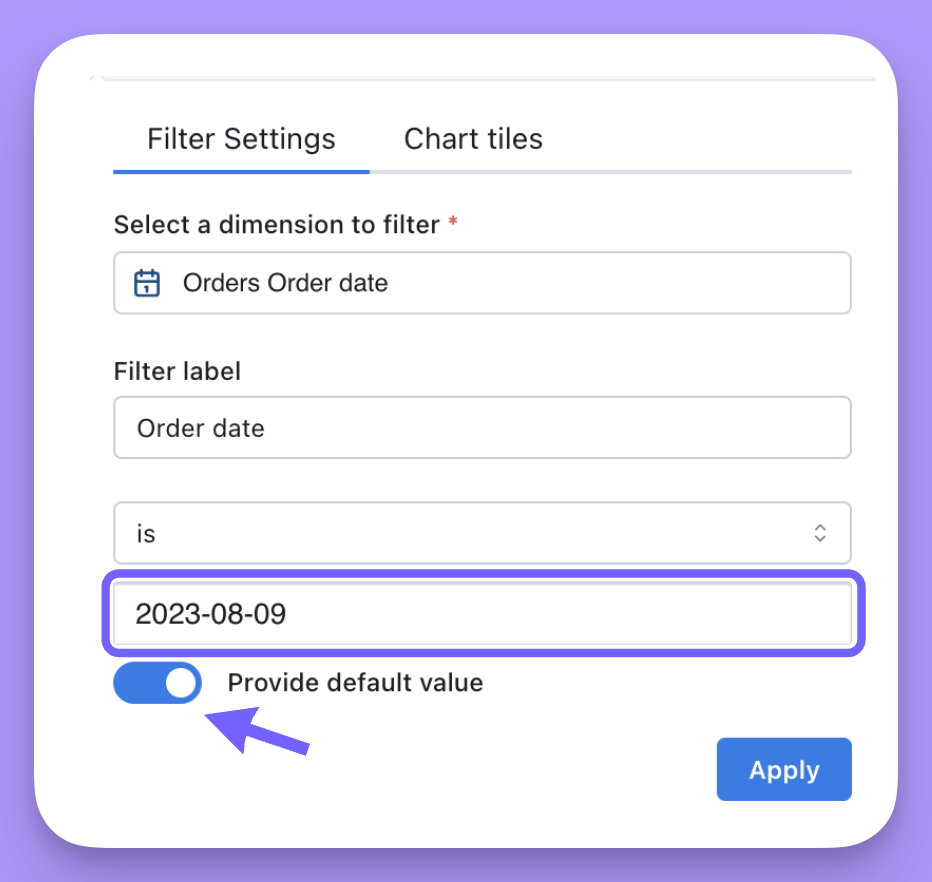
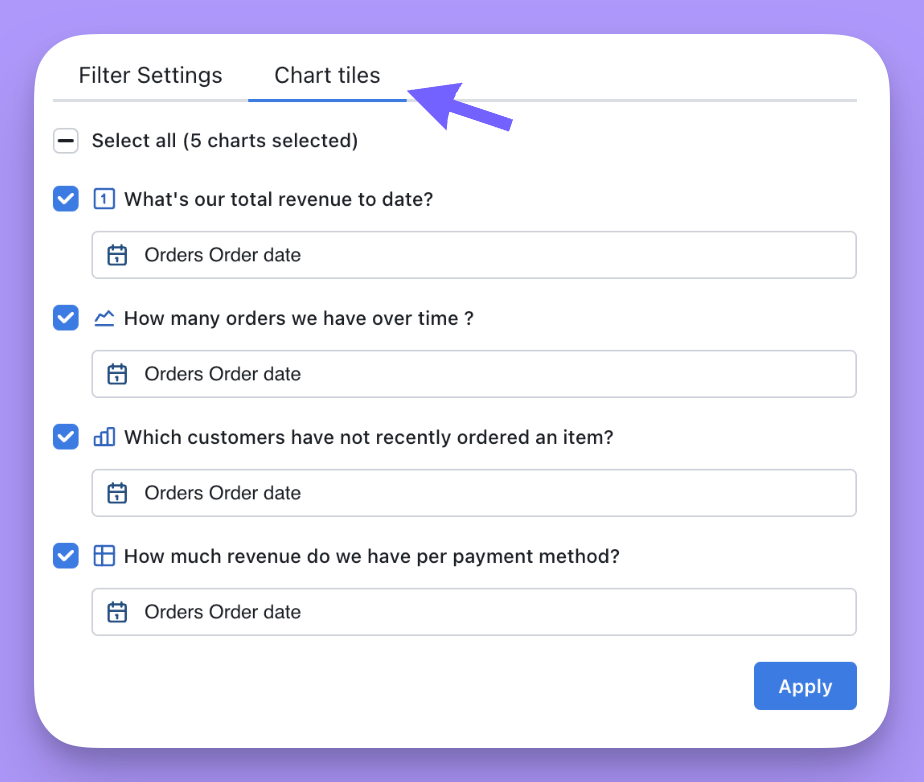
- To adjust which tiles the filter applies to, open the
Tilestab.
- Click
Apply, and the filter appears at the top of your dashboard.
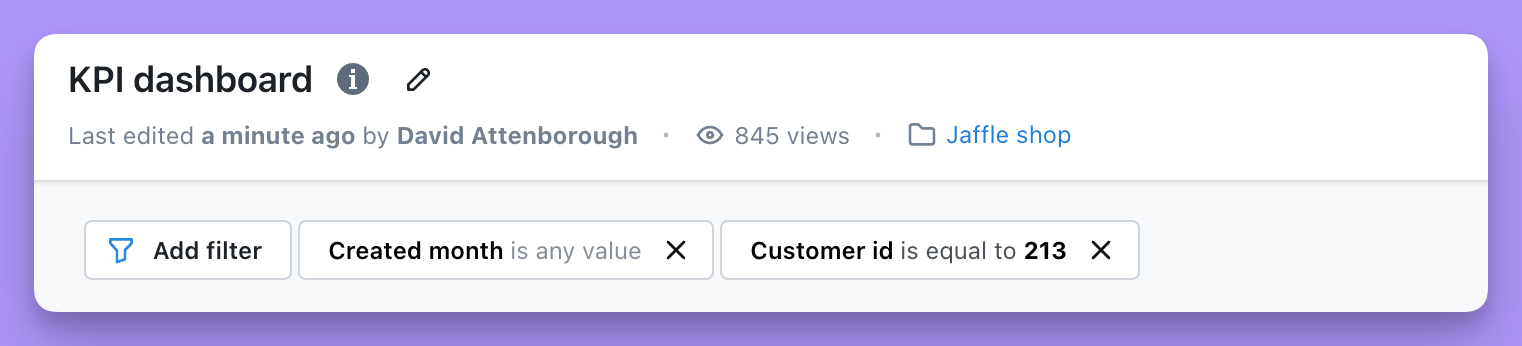
- Once you have all the filters you want, hit
Save.

To add saved filters to a dashboard, you must be an
editor or an admin for your project.Filtering charts created in the SQL runner
Dashboard filters apply to SQL runner charts as well as charts from the Explore view. How you create them depends on what’s on the dashboard. On a dashboard with both Explore and SQL runner charts, create filters exactly as above — choose a field and create the filter. Then, in the Chart tiles tab, apply the filter to a SQL chart tile and choose the column it should apply to. On a dashboard with only SQL runner tiles, filters work from columns rather than semantic fields:- Choose a column from the list of all columns available across all charts.
- Choose a filter label to give the filter a recognizable name.
- Choose the filter operator and values as you would for any other filter.
How dashboard filters interact with chart filters
Dashboard filters override filters applied in a saved chart on the same field. For example, a chart for Sales in Asia is filtered tocountry is China, India, Japan. On the dashboard you add a filter country is India. The saved chart’s filter is removed and the dashboard filter applies instead, so the tile is filtered to country is India.
Dates work the same way. If the saved chart includes only orders completed on or after April 3rd 2024, and you add a dashboard filter for orders completed on or after August 1st 2024, the dashboard filter wins and the tile shows orders completed on or after August 1st 2024.
This carries into exploring:
- Explore from here on a dashboard tile keeps the filters you saw on the dashboard. Filters overridden in the dashboard stay overridden; filters the dashboard didn’t touch are the same as in the original chart.
- Edit on the chart instead shows the original chart filters.
Required filters and filter requirement groups
Dashboard filters can be marked as required, so the dashboard won’t load any data until a viewer picks a value. You can also combine several filters into a requirement group: viewers must set at least one of them, but any will do. Take a Sales overview dashboard that queries all historic orders, where loading it unfiltered is slow and expensive. We want viewers to always pick a Payment method, plus at least one of Order status or Order date, before any queries run.Marking a single filter as required
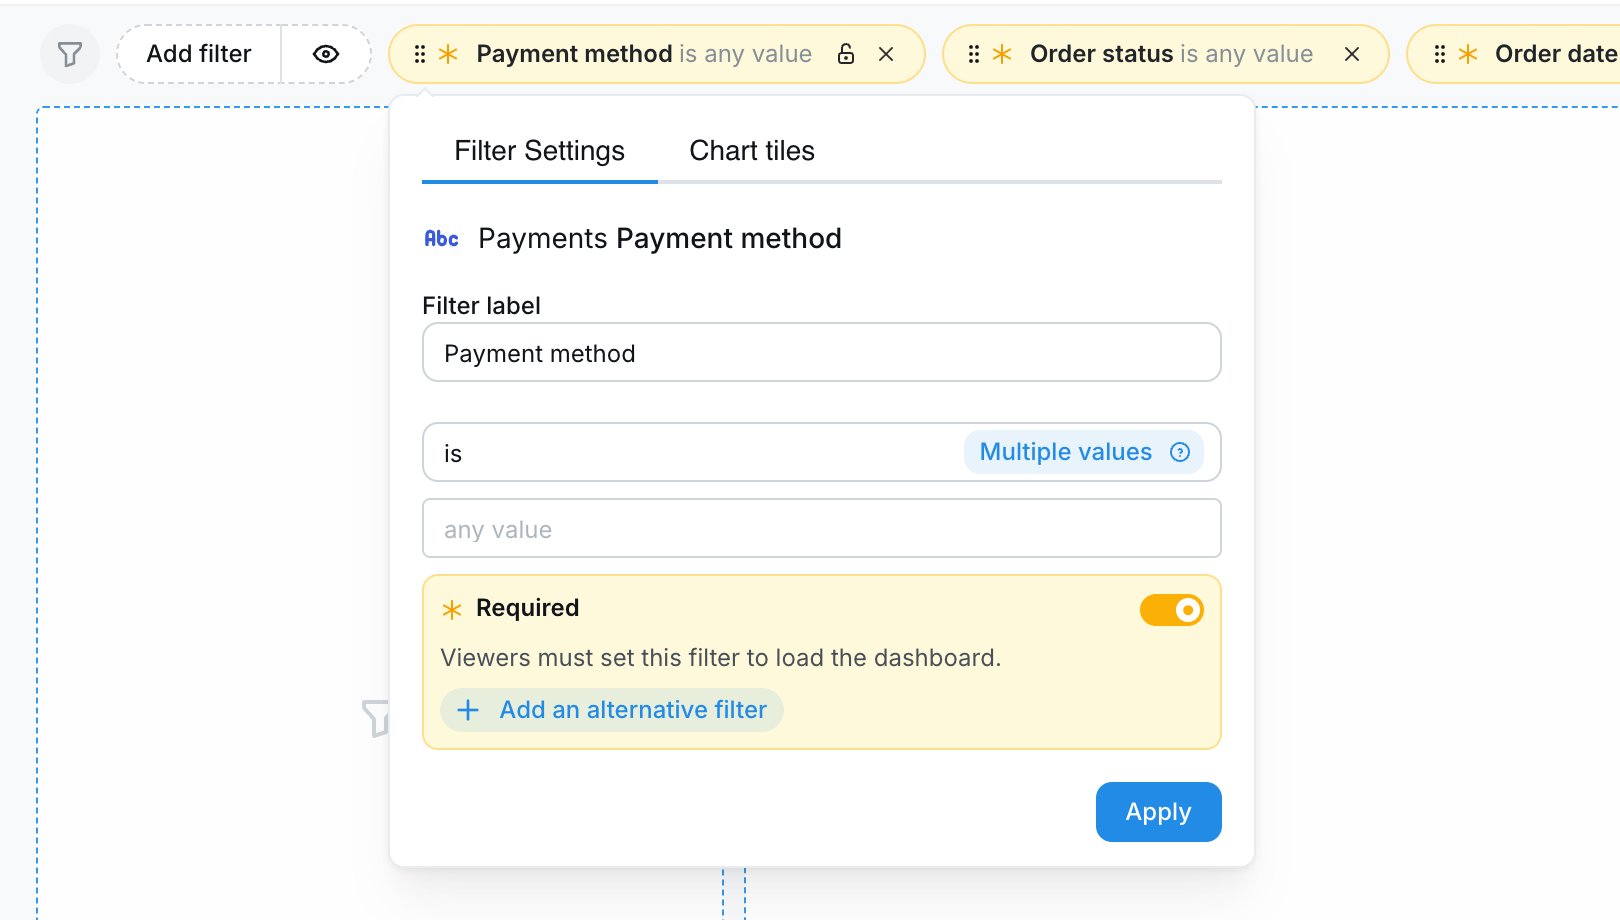
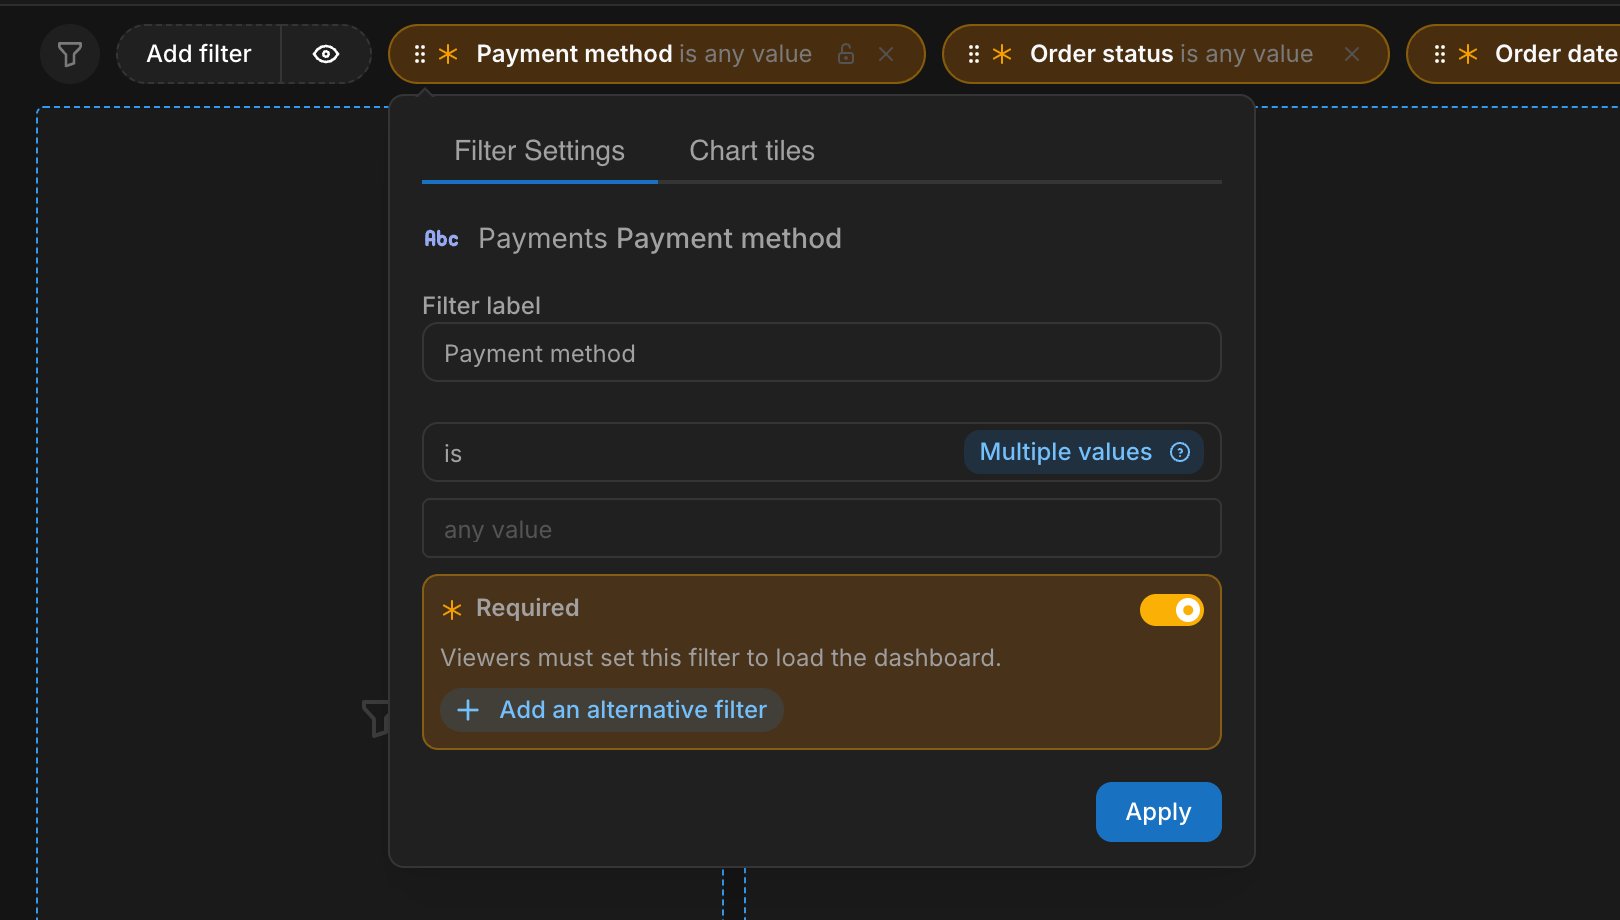
While editing the dashboard, open thePayment method filter’s popover and switch on the Required toggle. Required filters must start empty, so the toggle can’t be combined with a default value.
Combining filters into a requirement group
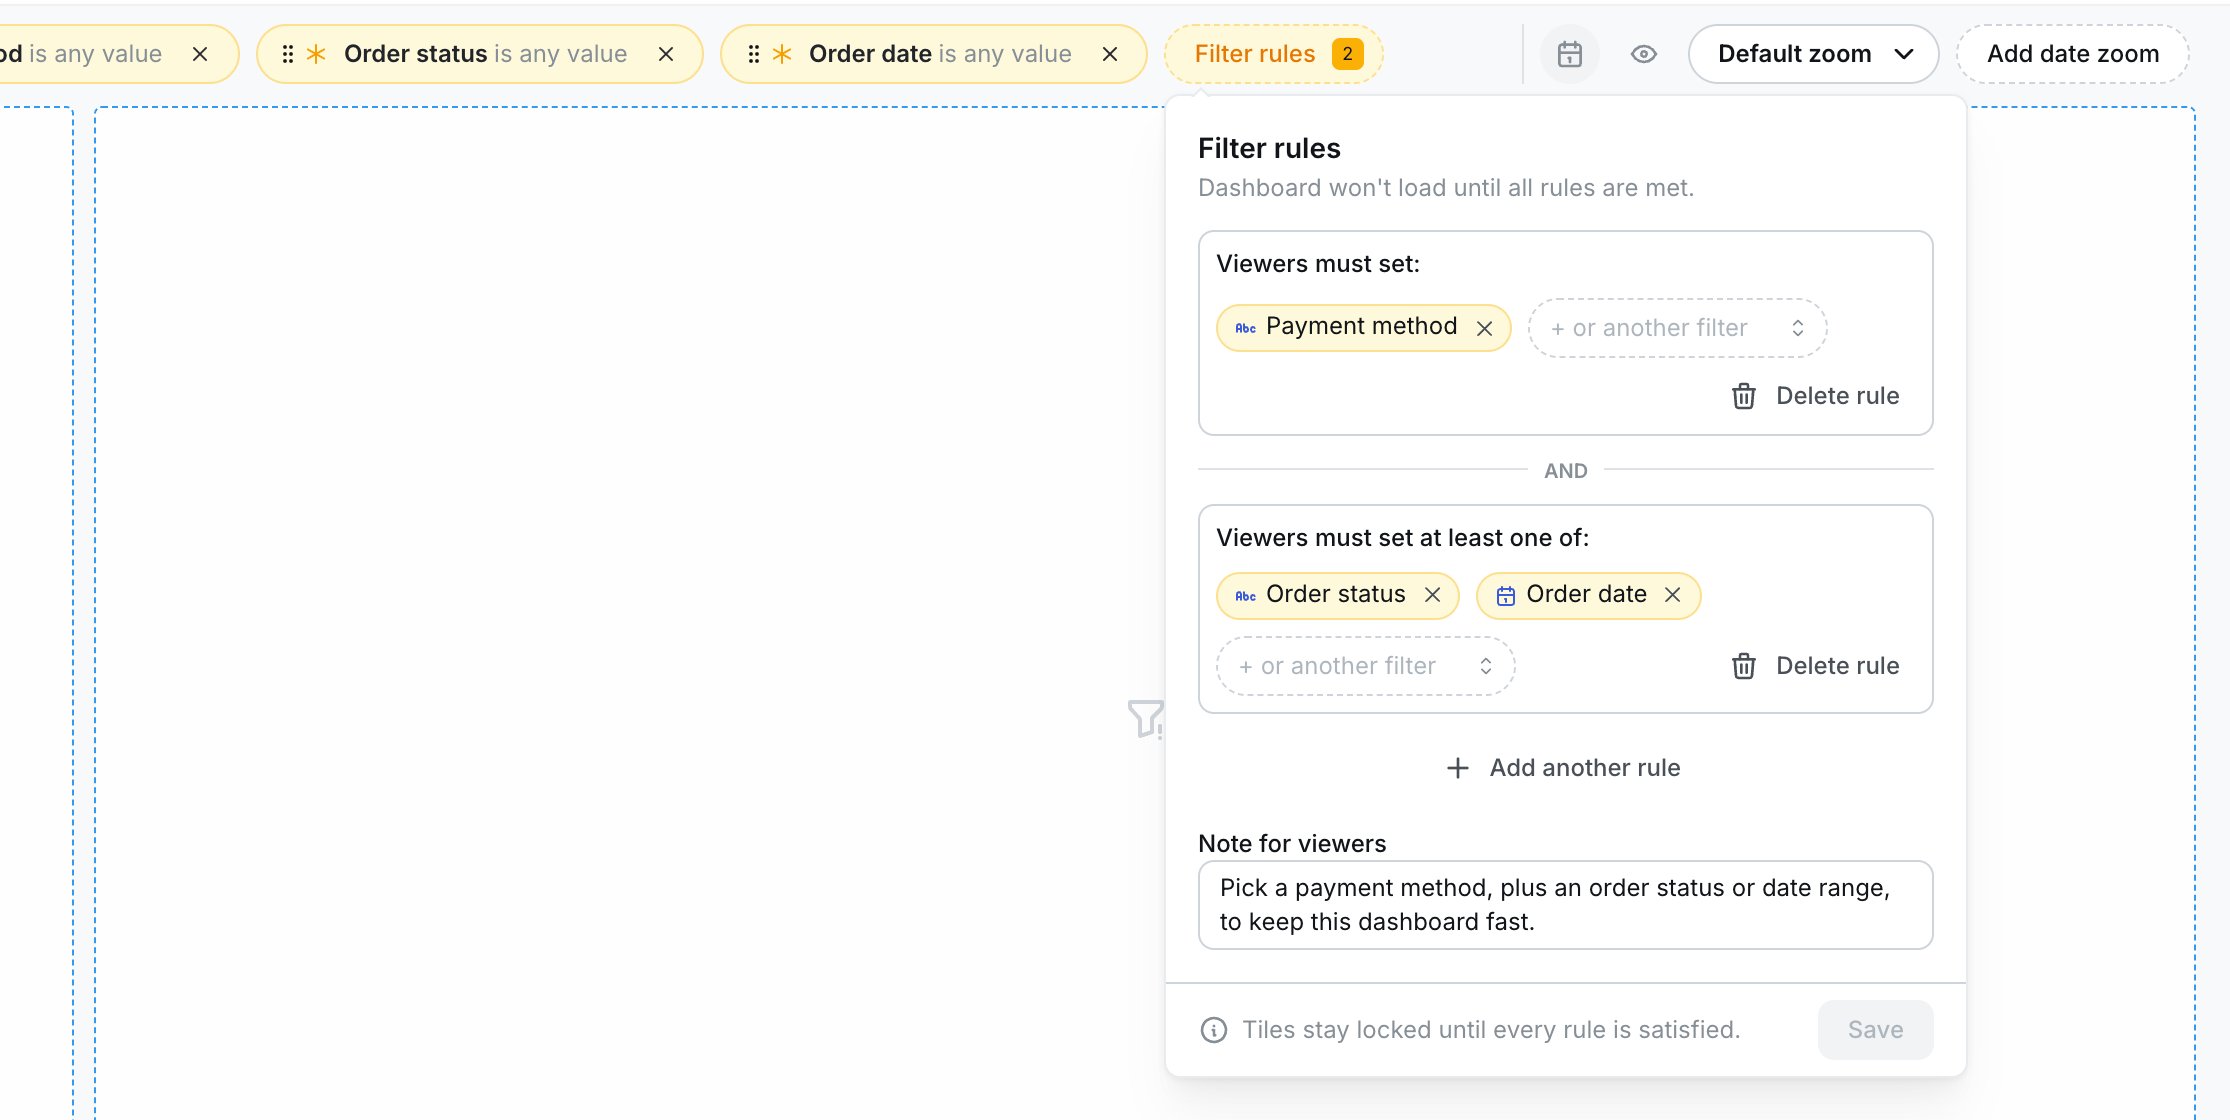
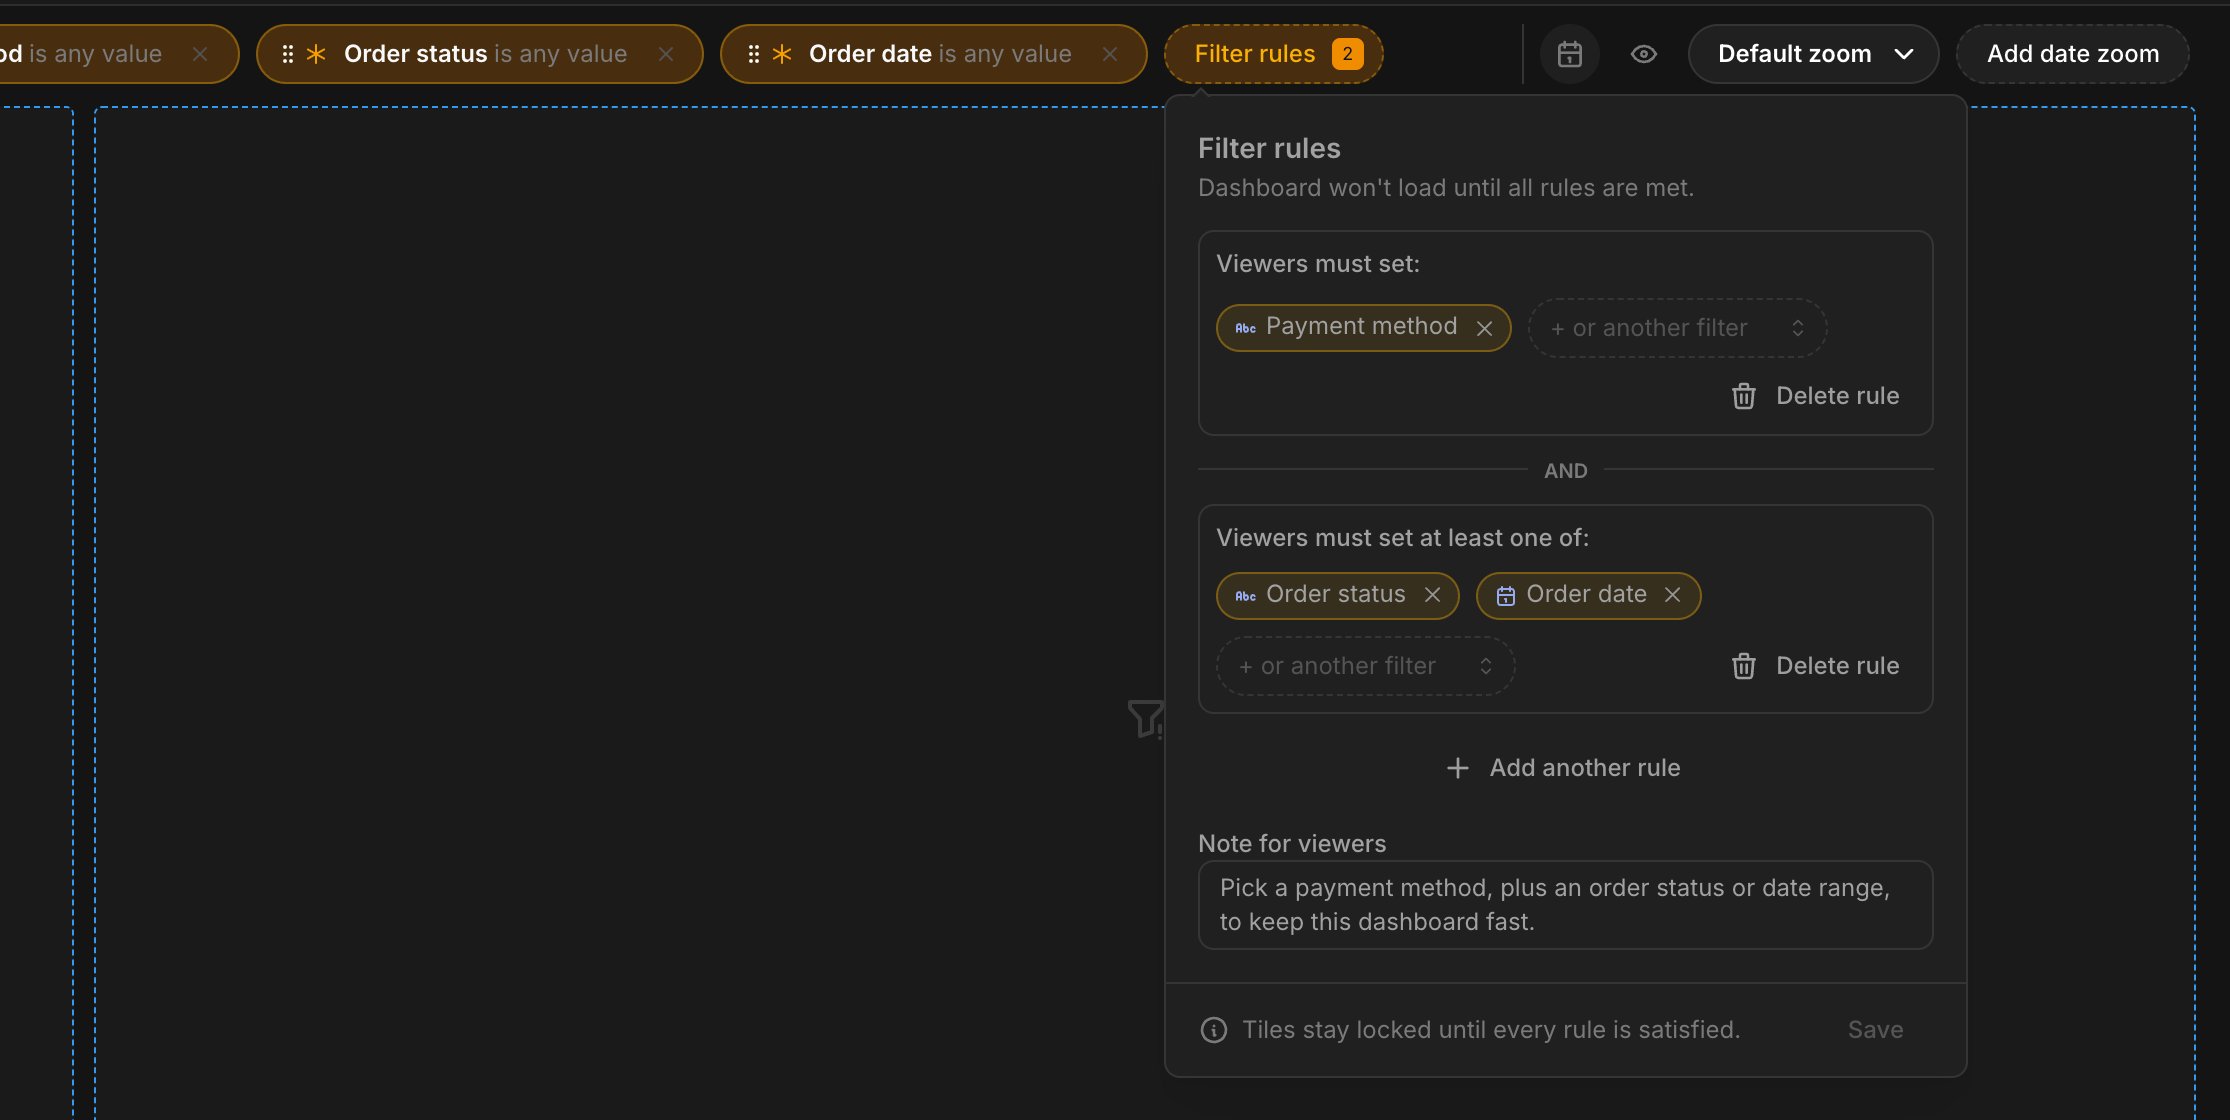
The “Order status or Order date” half of the example needs a requirement group. Open the Filter rules popover next to the filter bar, where every rule is managed in one place:- Click Add another rule, pick
Order status, then addOrder dateto the same rule. One filter makes a plain required filter; more make an “at least one of” group. Filters with a default value, or already in another rule, can’t be picked. - Optionally, write a Note for viewers explaining why the filters are required. Ours says: “Pick a payment method, plus an order status or date range, to keep this dashboard fast.”
- Click Save in the popover, then save the dashboard.
What viewers see
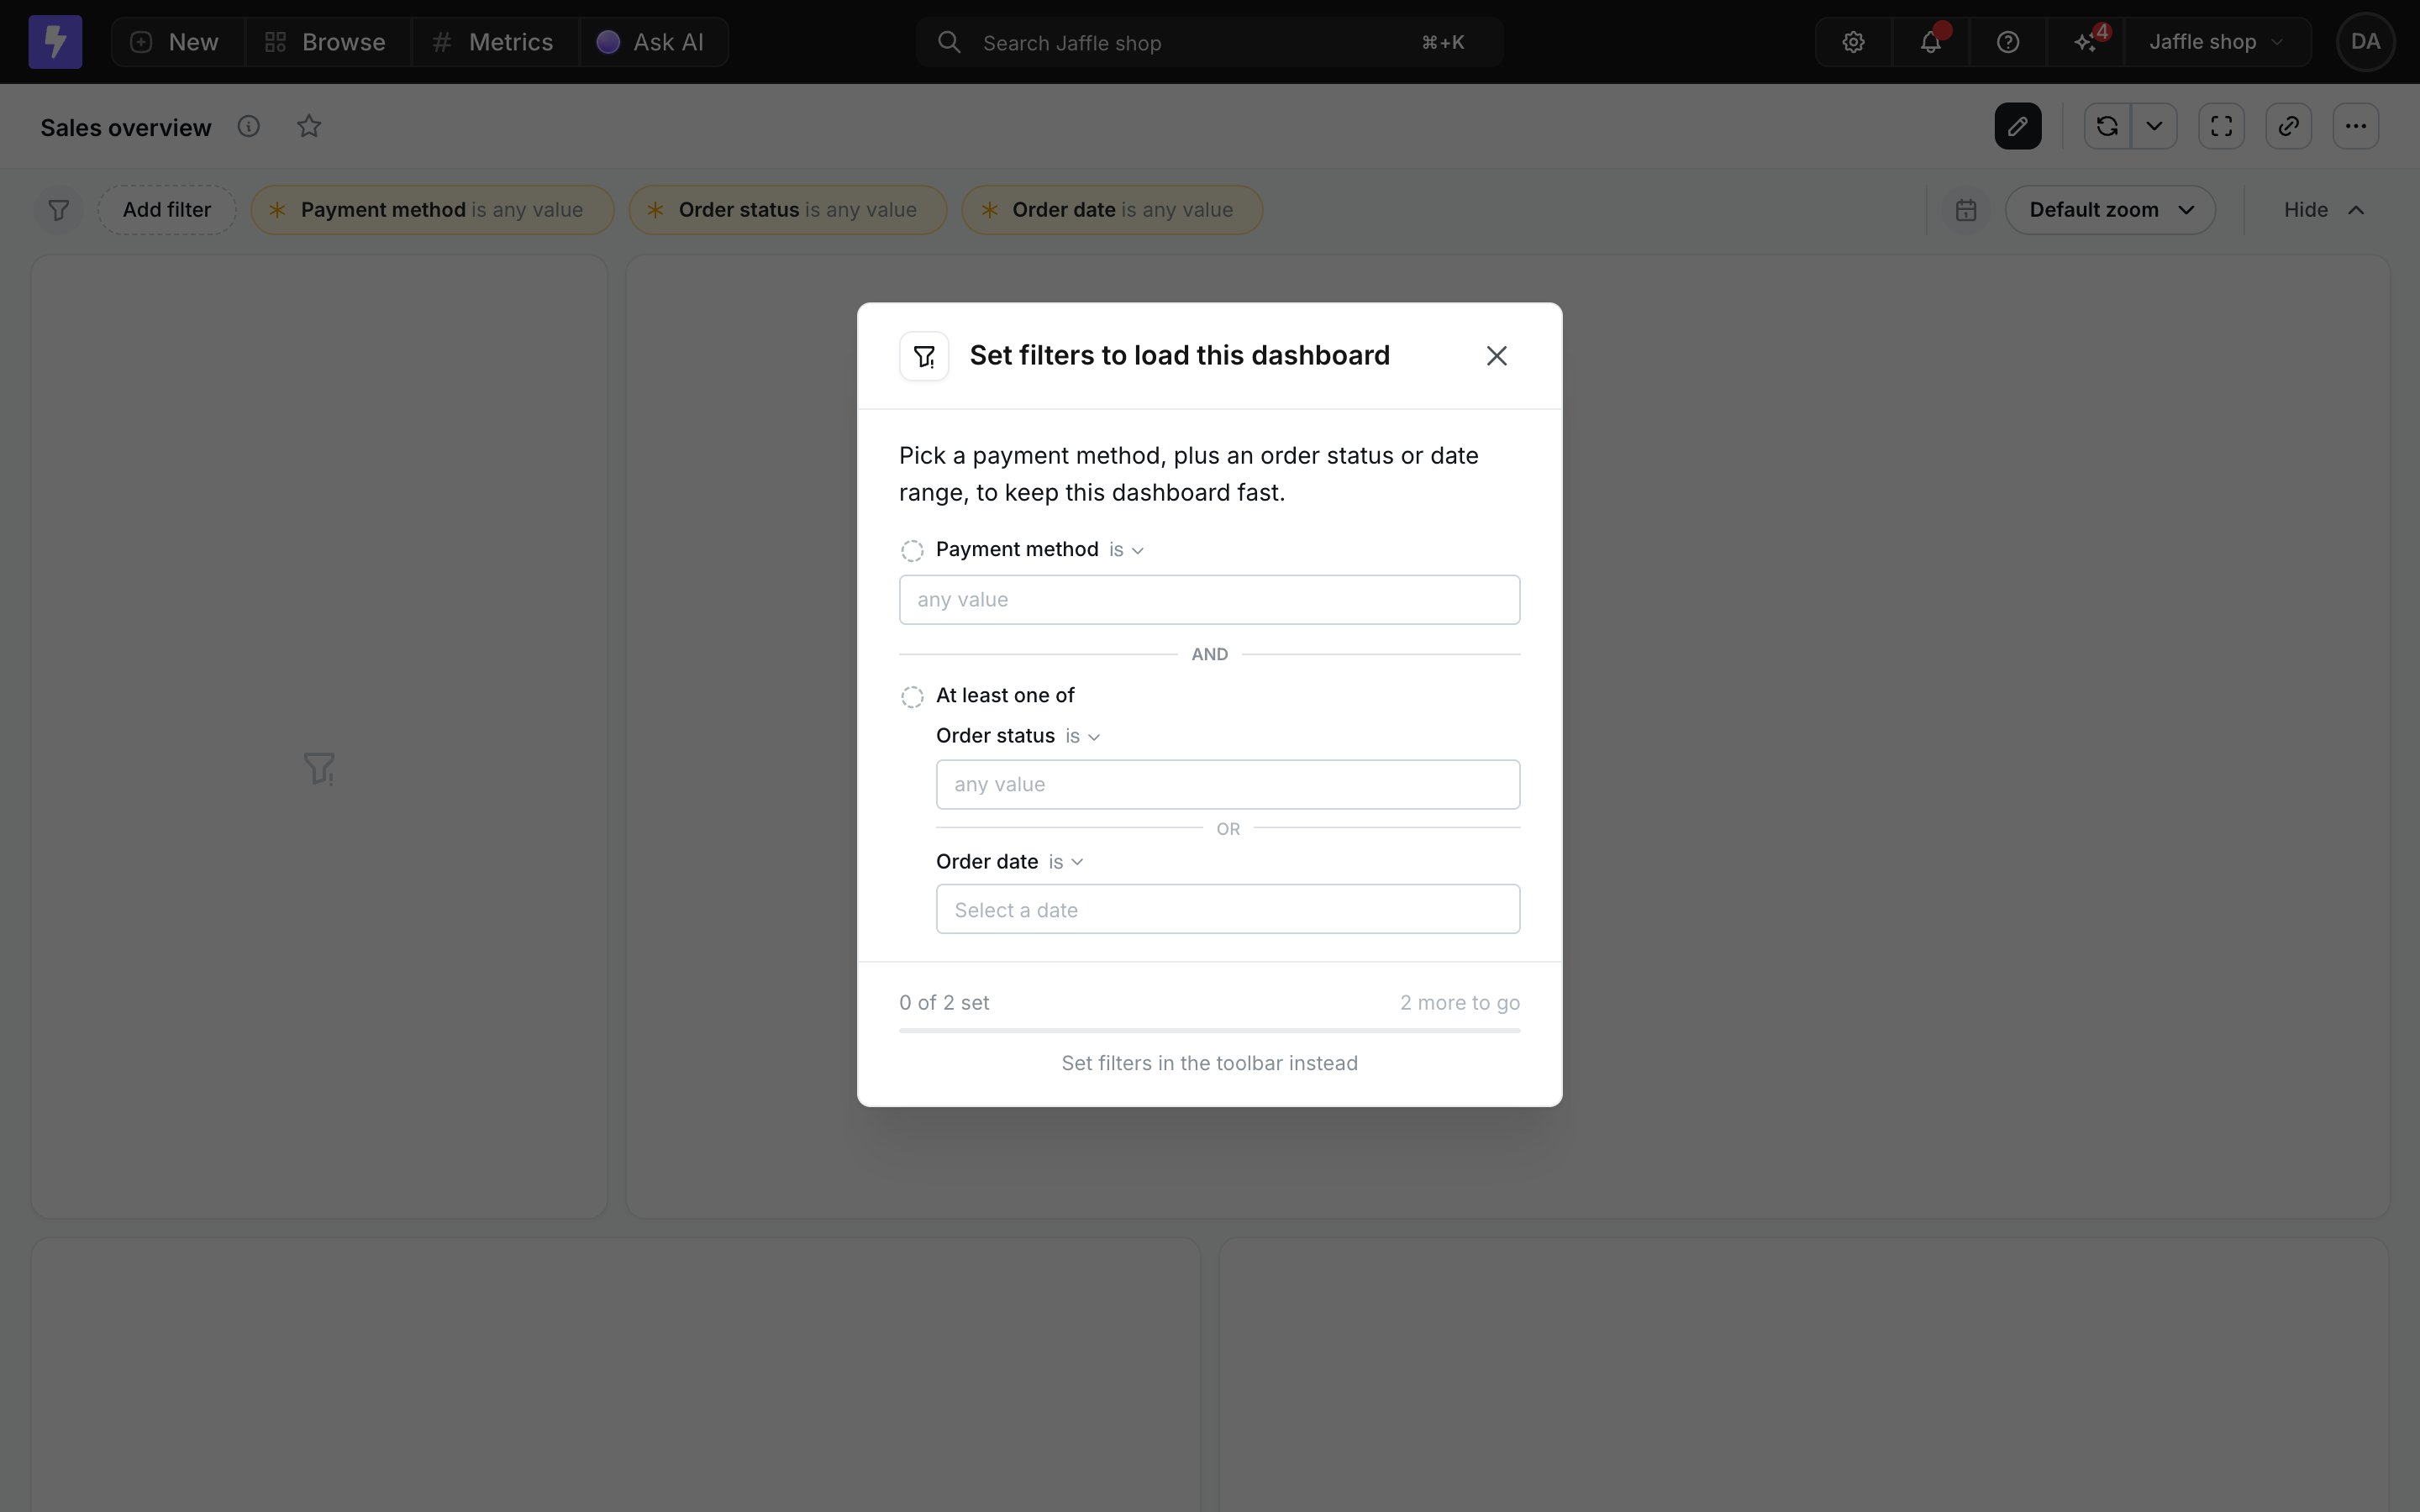
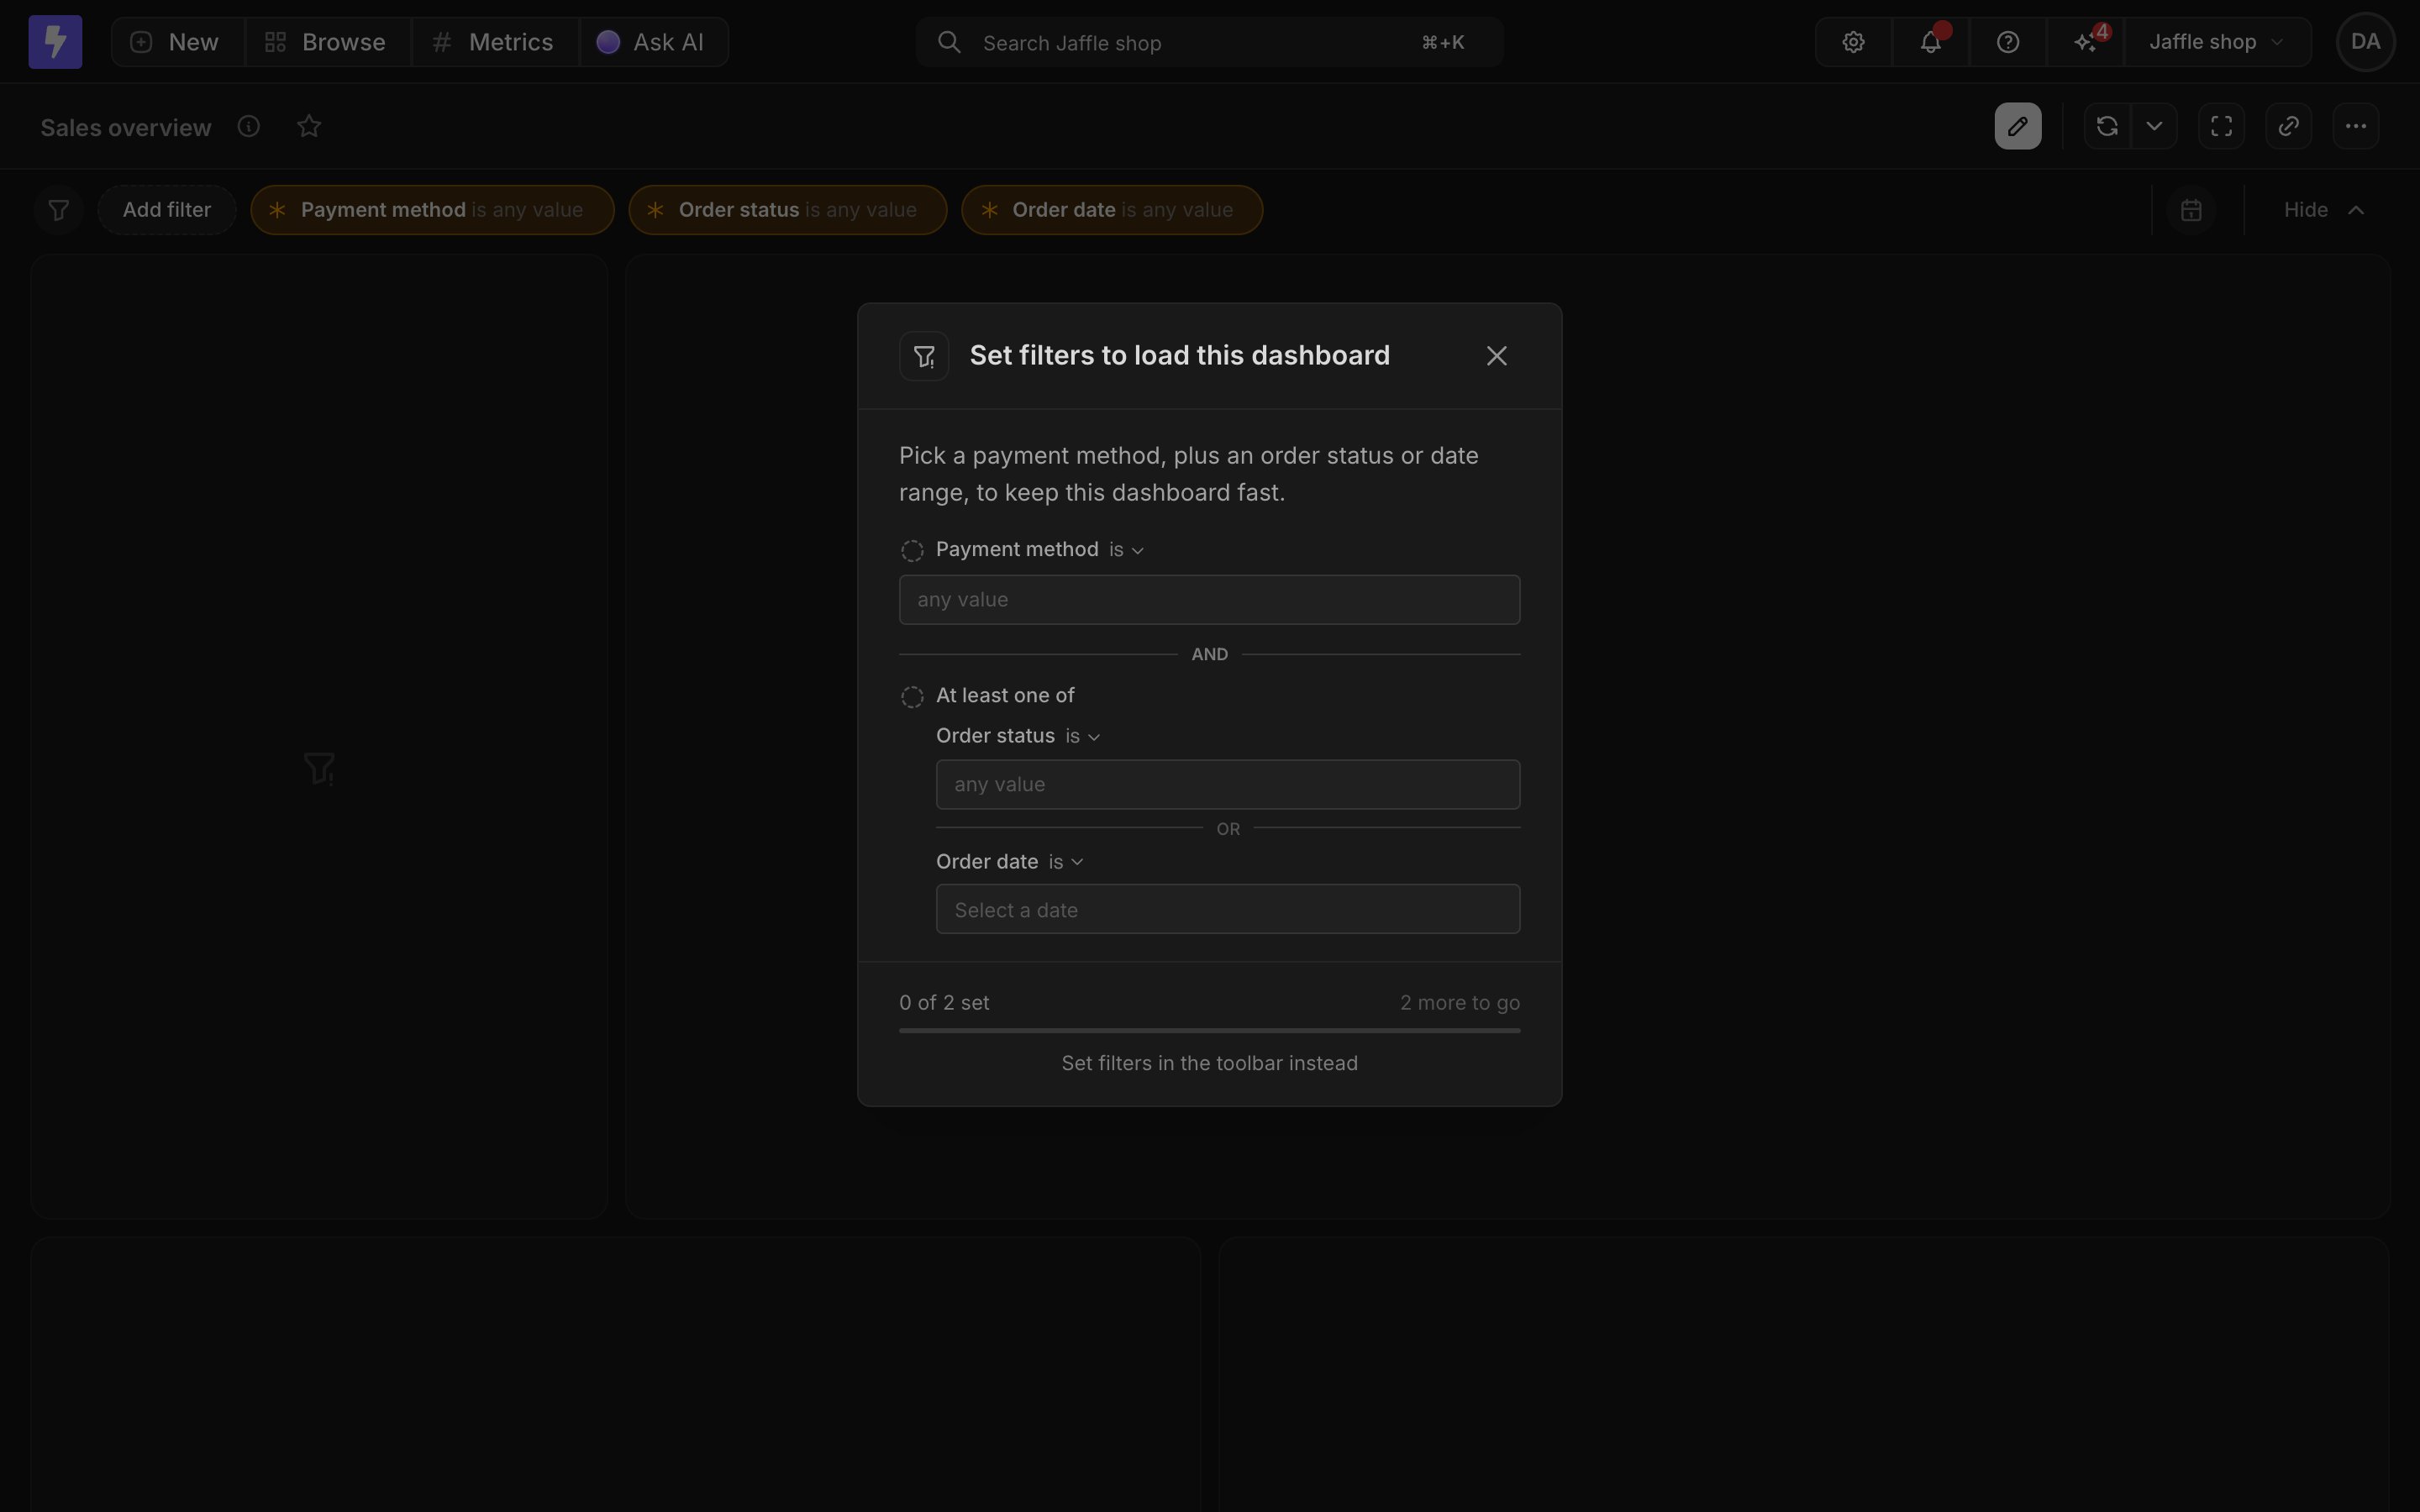
While any rule is unmet, chart tiles stay locked. The dashboard shows a guided setup card with a picker for each filter and your note as its subtitle. On the example dashboard, viewers get one picker forPayment method, an “at least one of” section for Order status and Order date, and a progress indicator showing how many rules are still unmet:
is null, is not null, in the current, not in the current, in all periods to date). On dashboards with tabs, a rule only locks the tabs its filters apply to.
Required filters in dashboards-as-code
Here’s the same example in dashboard YAML: a required filter hasrequired: true, filters sharing a requiredGroupId form an “at least one of” group, and the viewer note lives on the dashboard config as requiredFiltersNote.
Locking dashboard filters
Lock a saved dashboard filter to guarantee that the dashboard always runs with a specific value — a region, a tenant, or a date range that every viewer should stay inside. A locked filter behaves the same way for everyone: viewers see what’s filtered, but they can’t change the value, and URL or embed overrides targeting the same field are ignored. Use a locked filter when you want to:- Ship a dashboard that is permanently scoped (for example, “EMEA Sales”) and stop viewers from accidentally changing the scope.
- Prevent someone from sharing a link with an override that hides or changes a filter you rely on.
- Enforce a filter value on an embedded dashboard regardless of what the embedding application passes in
externalFilters.
How to lock a filter
You need to be aneditor or admin to lock a filter.
- Open the dashboard and click Edit dashboard.
- Hover over the filter chip you want to lock. An open padlock button appears next to the x.
- Click the padlock. The icon switches to a closed lock and stays visible at rest.
- Click Save on the dashboard to persist the change.
What viewers see
In view mode, a locked filter chip shows a closed-lock indicator on the right. Clicking the chip does nothing, and a tooltip explains that the filter is locked. The locked value still applies to every tile that uses the filter’s field, exactly like a normal saved filter.How locking interacts with overrides
Locked filters take precedence over every override mechanism:- URL overrides. When a link contains
?filters=or?tempFilters=targeting a locked field, Lightdash drops the override on load, cleans up the URL, and shows the viewer a one-time toast explaining that the override was ignored. - Embed
externalFilters. When an embed JWT passesexternalFilterstargeting a locked field, Lightdash uses the dashboard’s saved locked value and ignores the override. - Required and locked together. A filter that is both
Requiredandlockedmust have a value in edit mode. Clearing the value disables Apply with the message “A locked, required filter must have a value”.
The override-stripping behaviour runs regardless of whether the feature flag is on, so dashboards with locked filters stay safe even if the flag is later turned off.
Empty default dashboard filters
You can save a dashboard filter that is active but has no value picked yet — for example acountry is filter with no country selected. This is an “unset default”: a filter control that appears in the dashboard filter bar so viewers can fill it in, without pre-committing to a value.
Empty non-required filters behave like this:
- They render in the filter bar as
is any value. - They do not override chart-level filters on the same field. If a saved chart is filtered to
countryisIndiaand the dashboard has an emptycountryfilter, tiles keep theIndiafilter until a viewer picks a value in the dashboard. As soon as a viewer selects a value, normal dashboard-overrides-chart behavior resumes. - They survive
lightdash uploadand are not flagged bylightdash lint— an empty active filter in dashboard YAML is a valid configuration.
in the current, not in the current) are not treated as empty, because they get their period from a unit-of-time setting rather than a value. They apply to tiles like any other configured filter.
To strip a chart-level filter from a tile, mark the dashboard filter as required, give it an explicit default value, or remove the filter from the saved chart. An empty dashboard filter won’t do it.
Sharing a dashboard with filter overrides
To share a dashboard with custom filters applied, you have to be in view mode. From there, either apply temporary filters and share the link with those filters applied, or save the filter changes for everybody and share the link with the new defaults. The rules for sharing dashboards with filters applied:- When adding a temporary filter in view mode, you can change the filter’s values — field, value, operator, and which tiles it applies to — but not the filter type, so a temporary filter can’t become a saved filter.
- When overriding a saved filter in view mode, you can only change the value and operator; the field and tile configuration stay as they are.
- In edit mode, when you change a saved filter to override its default value, the ‘override’ status is removed once you click Apply.
Seeing which tiles have filters applied
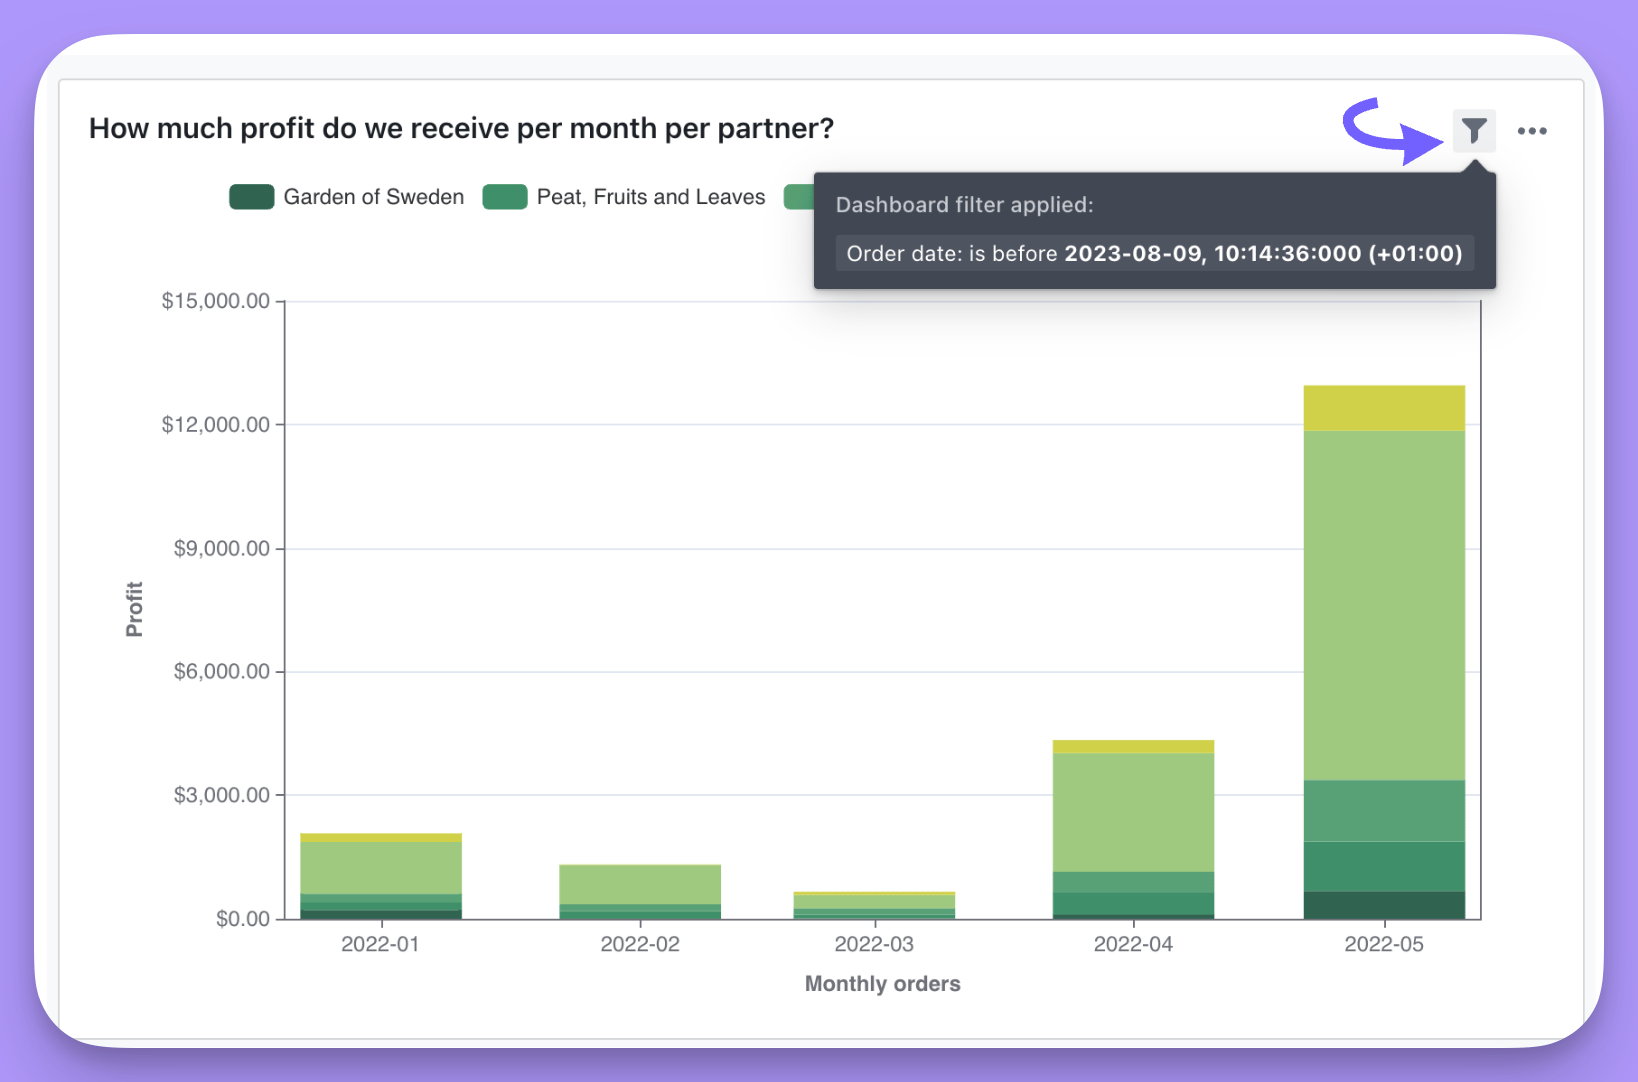
A tile with a filter applied shows the textdashboard filter applied. Hover over it to see which filters were applied to that tile.
Filter value autocomplete
When determining possible values for a dashboard filter, Lightdash takes into account all relevant filters, including those applied to fields from joined tables. Take these payments, orders, and customers models:- Filtering on a field from the
paymentsmodel considers filters applied to fields from thepayments,orders, andcustomersmodels. - Filtering on a field from the
ordersmodel considers filters applied to fields from theordersandcustomersmodels. - Filtering on a field from the
customersmodel considers filters applied to fields from thecustomersmodel.
Filtering a dashboard from the URL
A dashboard URL can carry values for its saved filters, so a link opens the dashboard already filtered. You can set up a dimension so that clicking a value sends the reader to a dashboard filtered by what they clicked — a sales dashboard listing your most profitable partners, for instance, where clicking a partner name opens a second dashboard showing that partner’s KPIs. Here’s what it looks like once it’s set up:- Open the dashboard you want to filter dynamically.
- Add a value to the filter you want to drive from the URL.
- Copy the URL shown after applying the filter. It looks like this:

The
?filters= key in the URL is followed by a URL-encoded JSON object. To read it, run it through a URL decoder.- Replace the filter value you chose in step 2 with
${ value.formatted | url_encode }to make it dynamic. In the example, the value isPlant+Paradise(highlighted in the image). - Paste that URL into the YAML file for the model you’re working in. See an example in our demo project.