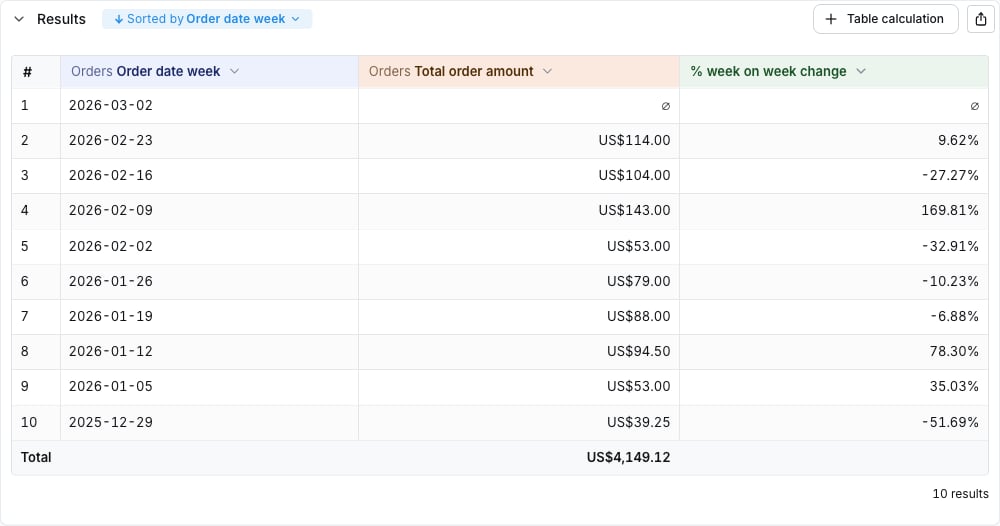
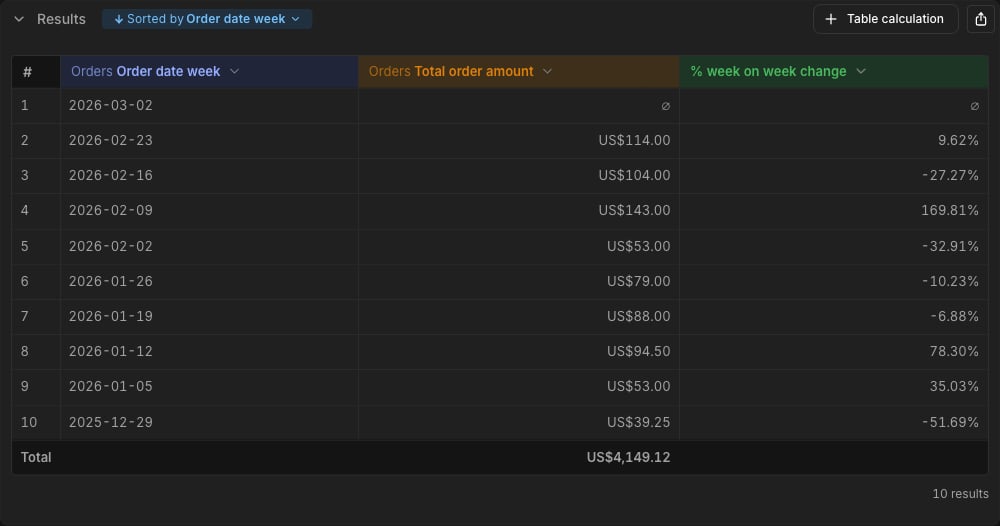
- Formula: a spreadsheet-style syntax that reads like Google Sheets. The default mode for new table calculations.
- SQL: raw SQL.
When to use table calculations
The Lightdash semantic layer allows you to define metrics and dimensions that can be reused across your organization. This creates consistency and saves time by establishing standard definitions everyone can rely on. Sometimes the predefined metrics and dimensions aren’t quite enough, and you might need to perform additional calculations for specific visualizations, create specialized metrics for particular analyses, or build custom logic to better communicate your insights.How Table Calculations Help
Table calculations work as an additional computational layer that builds on top of:- Semantic layer metrics and dimensions (your standard definitions)
- Custom metrics and dimensions (created at the BI layer)
- Other table calculations (you can even stack them)
Creating table calculations
Before you create a table calculation, you need to add some dimensions and/or metrics to your results table. Table calculations work with whatever data you’ve already pulled into your results table - they can reference the dimensions and metrics you’ve selected, as well as other table calculations you’ve built from those same underlying fields. Think of it like building with blocks: you start with your base dimensions and metrics, then you can stack table calculations on top of those, and even build new calculations that reference the ones you’ve already created.Using quick calculations
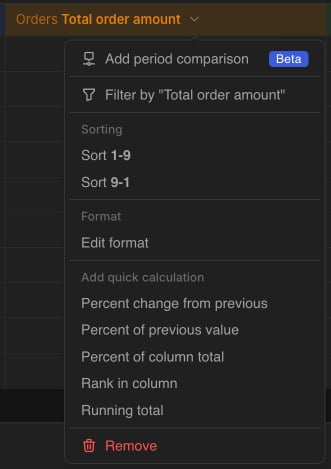
Quick calculations are shortcuts to the most common table calculations, these are only available to metrics in the contextual menu in the results table.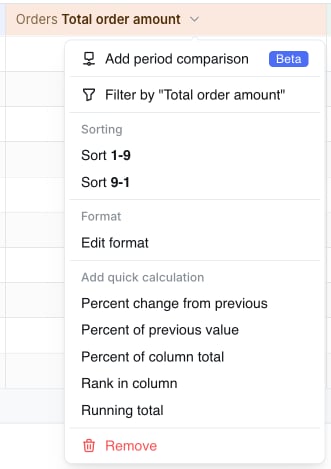
Using custom table calculations
Once you’ve got some data in your results table, you can create a table calculation by clicking on the+ Table calculation in the Results tab of the Explore view:


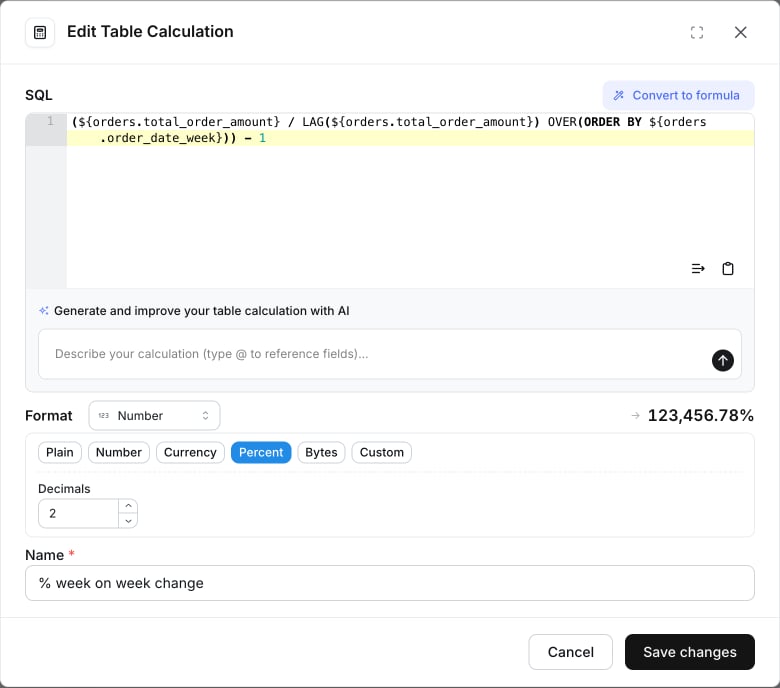
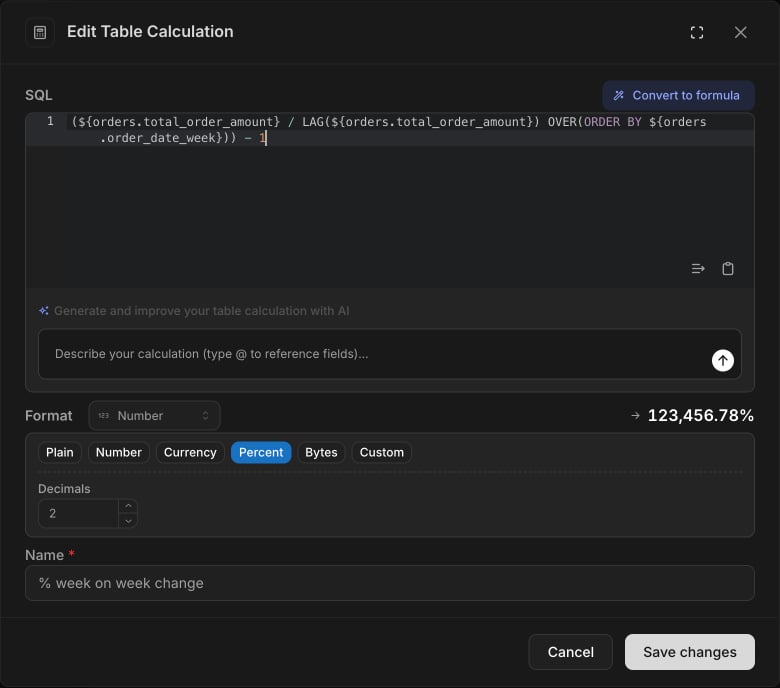
Write the SQL for your table calculation in the pop-up box
Your table calculation is defined using raw SQL that you write up in this pop up box. If you’re not sure what to write here, you can check out some of our table calculation SQL templates. To reference the metrics and dimensions in your results table, you can either use the autocomplete, or you can manually write the full field name using the format${table_name.field_name}.
Using table calculation functions
In addition to writing raw SQL, you can use built-in functions that simplify common table calculation patterns. These functions compile to SQL window functions automatically, so you don’t need to writeLAG, LEAD, or ROW_NUMBER by hand.
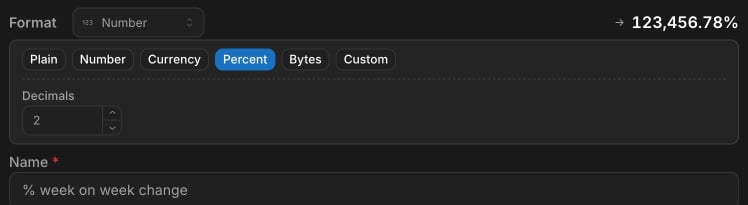
Update the format of your table calculation (if needed)
If needed, you can update the format of your table calculation — percent, currency, number with custom prefix/suffix — in the Format section of the modal, just below the SQL editor.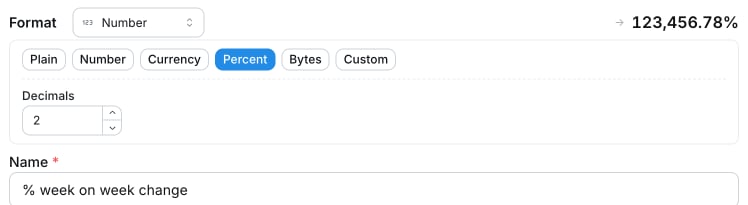
Choose how totals are calculated (if needed)
Use the Totals setting in the table calculation modal to control how Lightdash calculates grand totals, column totals, pivot row totals, and subtotals for the calculation.
You can choose a different mode for each table calculation in the same table. For example, use Formula for a profit-margin ratio and Sum of rows for an adjustment applied to every row.
Formula mode can only produce a total when Lightdash can evaluate the calculation at the aggregated total grain. If a calculation references dimensions, other table calculations, or window logic, use Sum of rows to total its row-level results.
To edit or remove your table calculation, open the column dropdown
Click the chevron next to the table calculation column header in the results table. From there you can Edit calculation to reopen the modal, or Remove to drop it.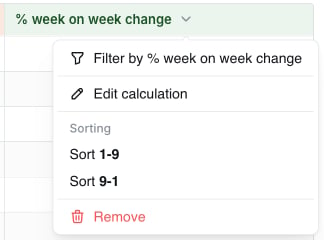
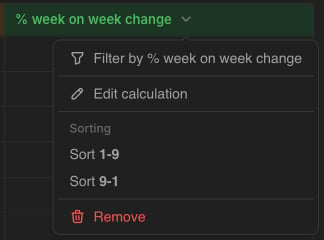
Table calculation execution and limitations
The processing order:- Raw data filtering happens first - Dimension and metric filters are applied to your base data.
- All table calculations run - Using this filtered dataset, all calculations are performed.
- Table calculation filters apply last - Only then are rows hidden based on calculated values.
Key limitations
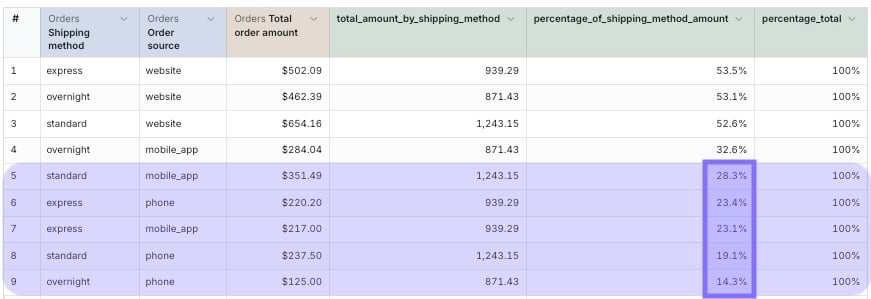
Since all calculations are performed before filtering, table calculation filters only hide rows without affecting the underlying calculations. For example: You use table calculations to calculate thepercentage_of_shipping_method_amount, then filter to hide rows below 30%. The filtered rows (shown in purple) will disappear but the percentage_total calculation still shows 100% even though the visible percentages in the percentage_of_shipping_method_amount column no longer add up to 100%.