

Plan before you build
A dashboard is easier to build — and much easier to read — if you can answer three questions first. Who is this dashboard for? Does your audience already know the subject, or do they need context to reach your point? Add whatever context they’ll need: acronyms that want clarifying, or a note about whether a rising number is good or bad. What is this dashboard trying to accomplish? Do you want your audience to take an action, or to know something they didn’t know before, and what information do they need to do it? Write a clear summary of the purpose and put it in the dashboard’s description, then outline the questions each tile should answer. How will you build it? Match the data you have to that outline of questions, and work out which metrics and dimensions you’ll use — including whether they exist yet.Create a dashboard
On the nav bar, click New to create a new dashboard.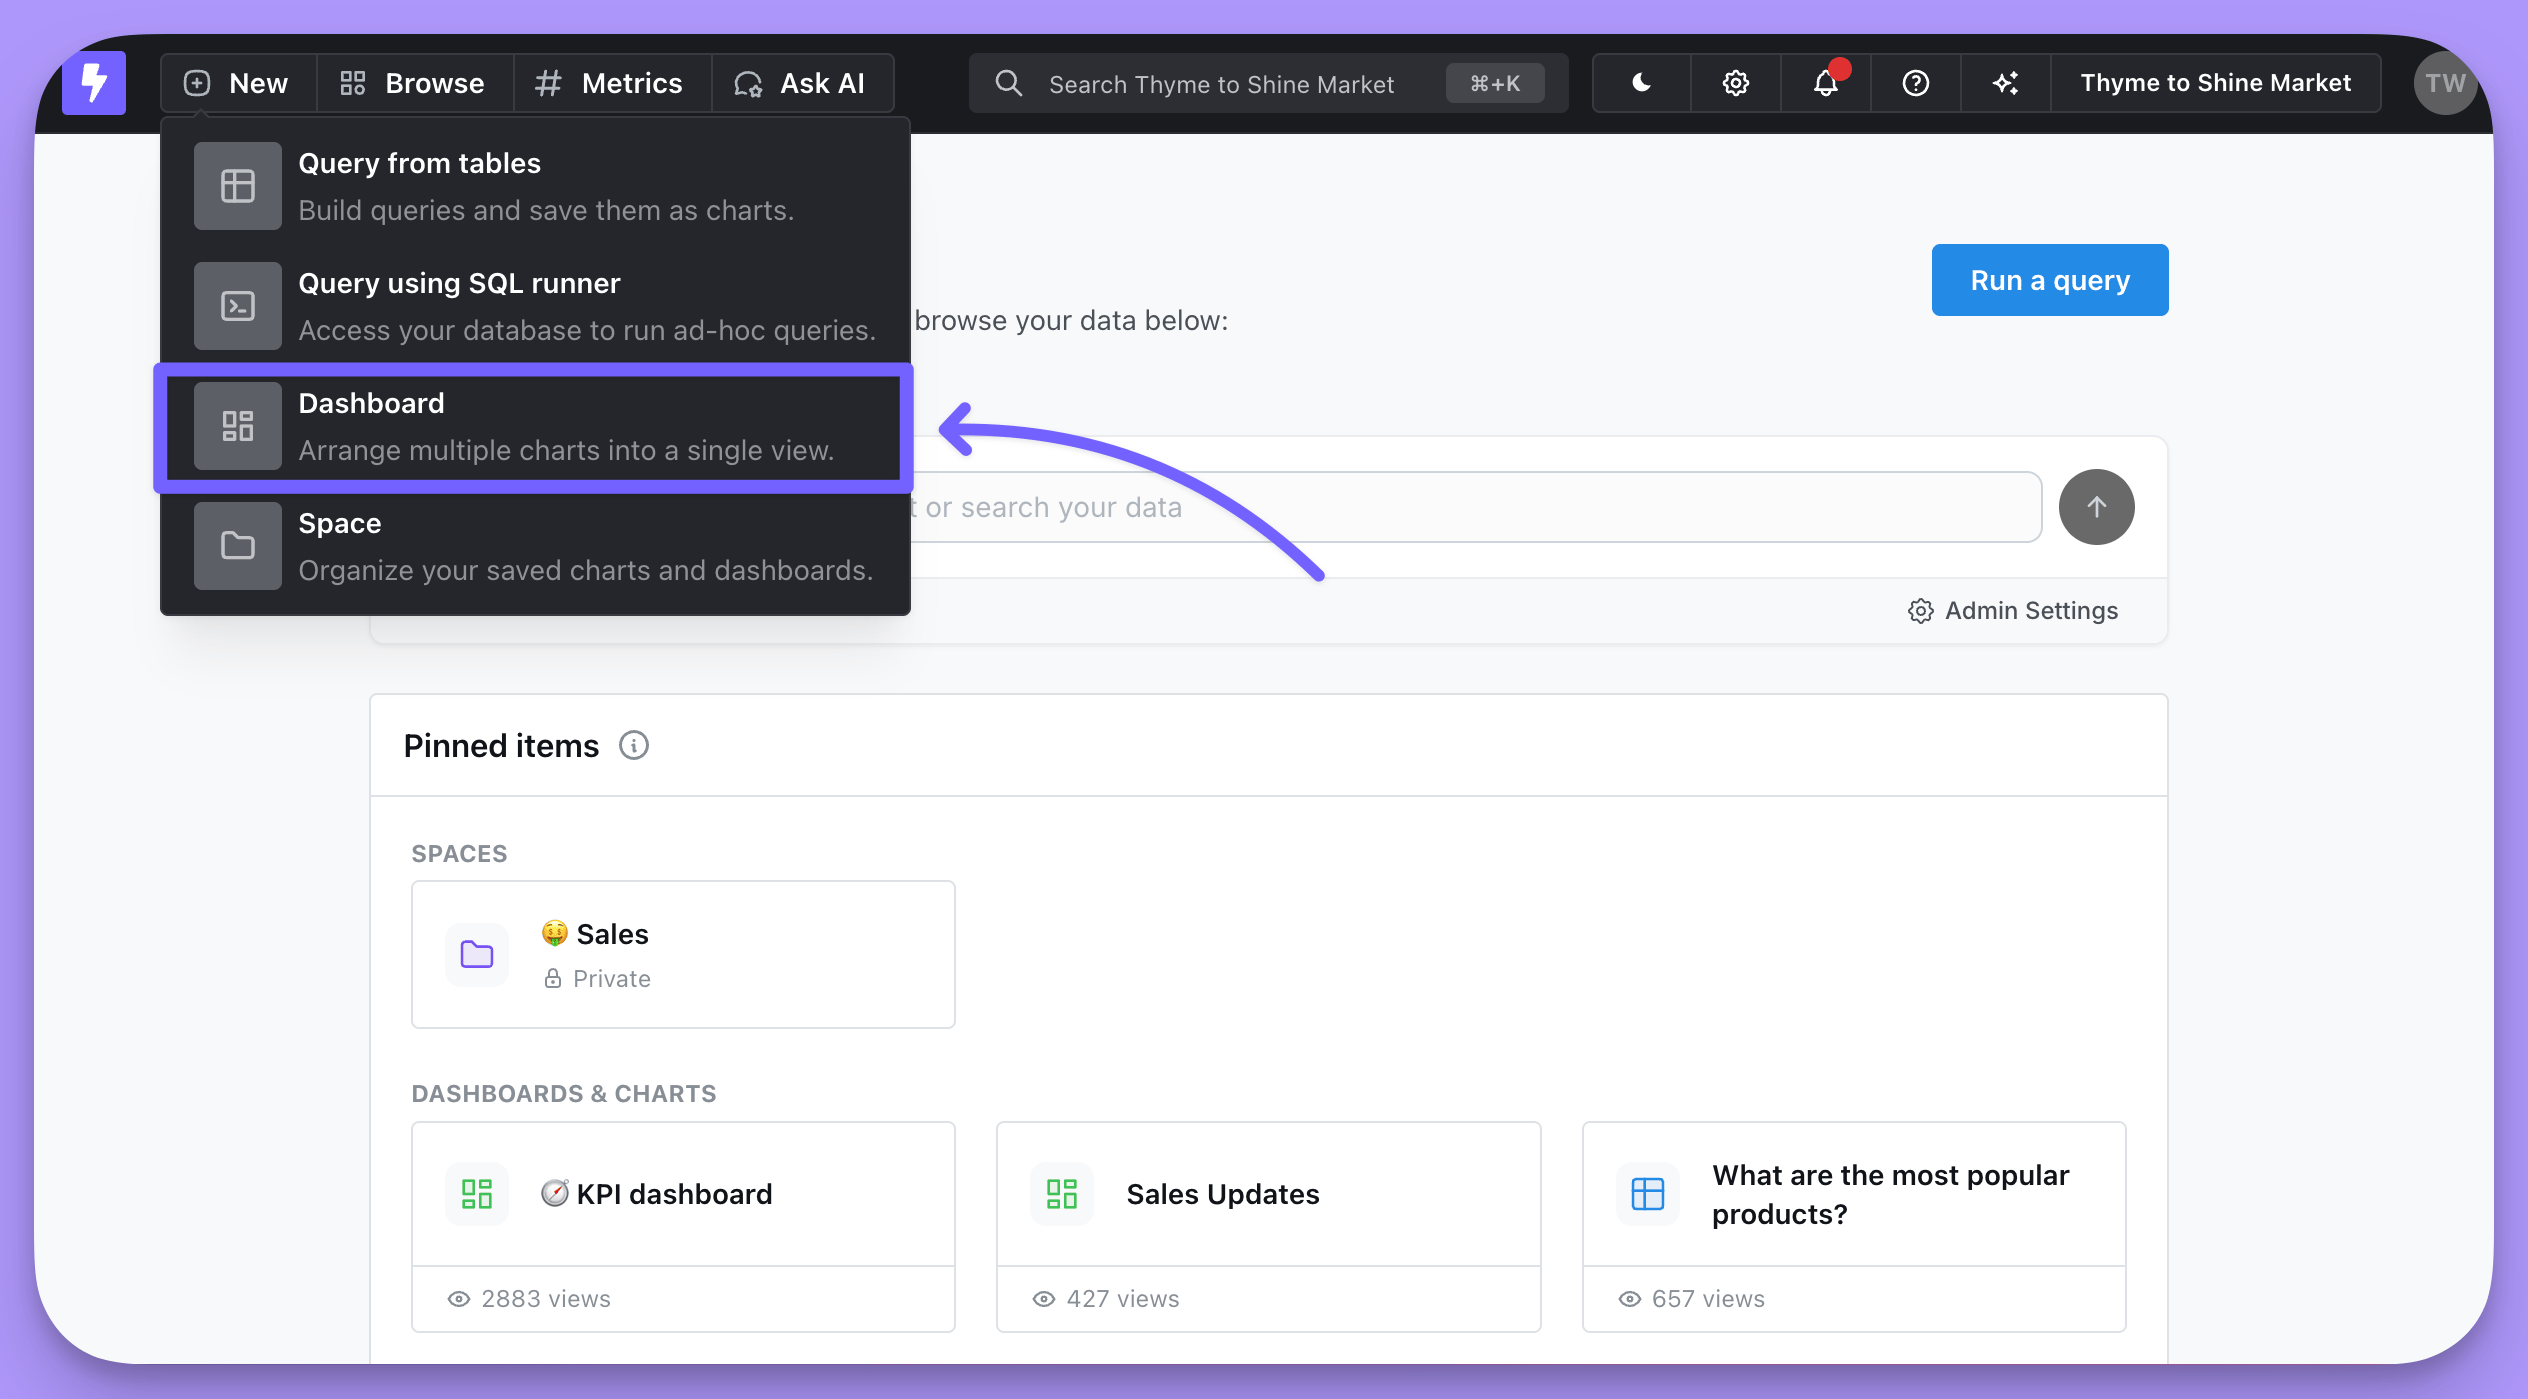
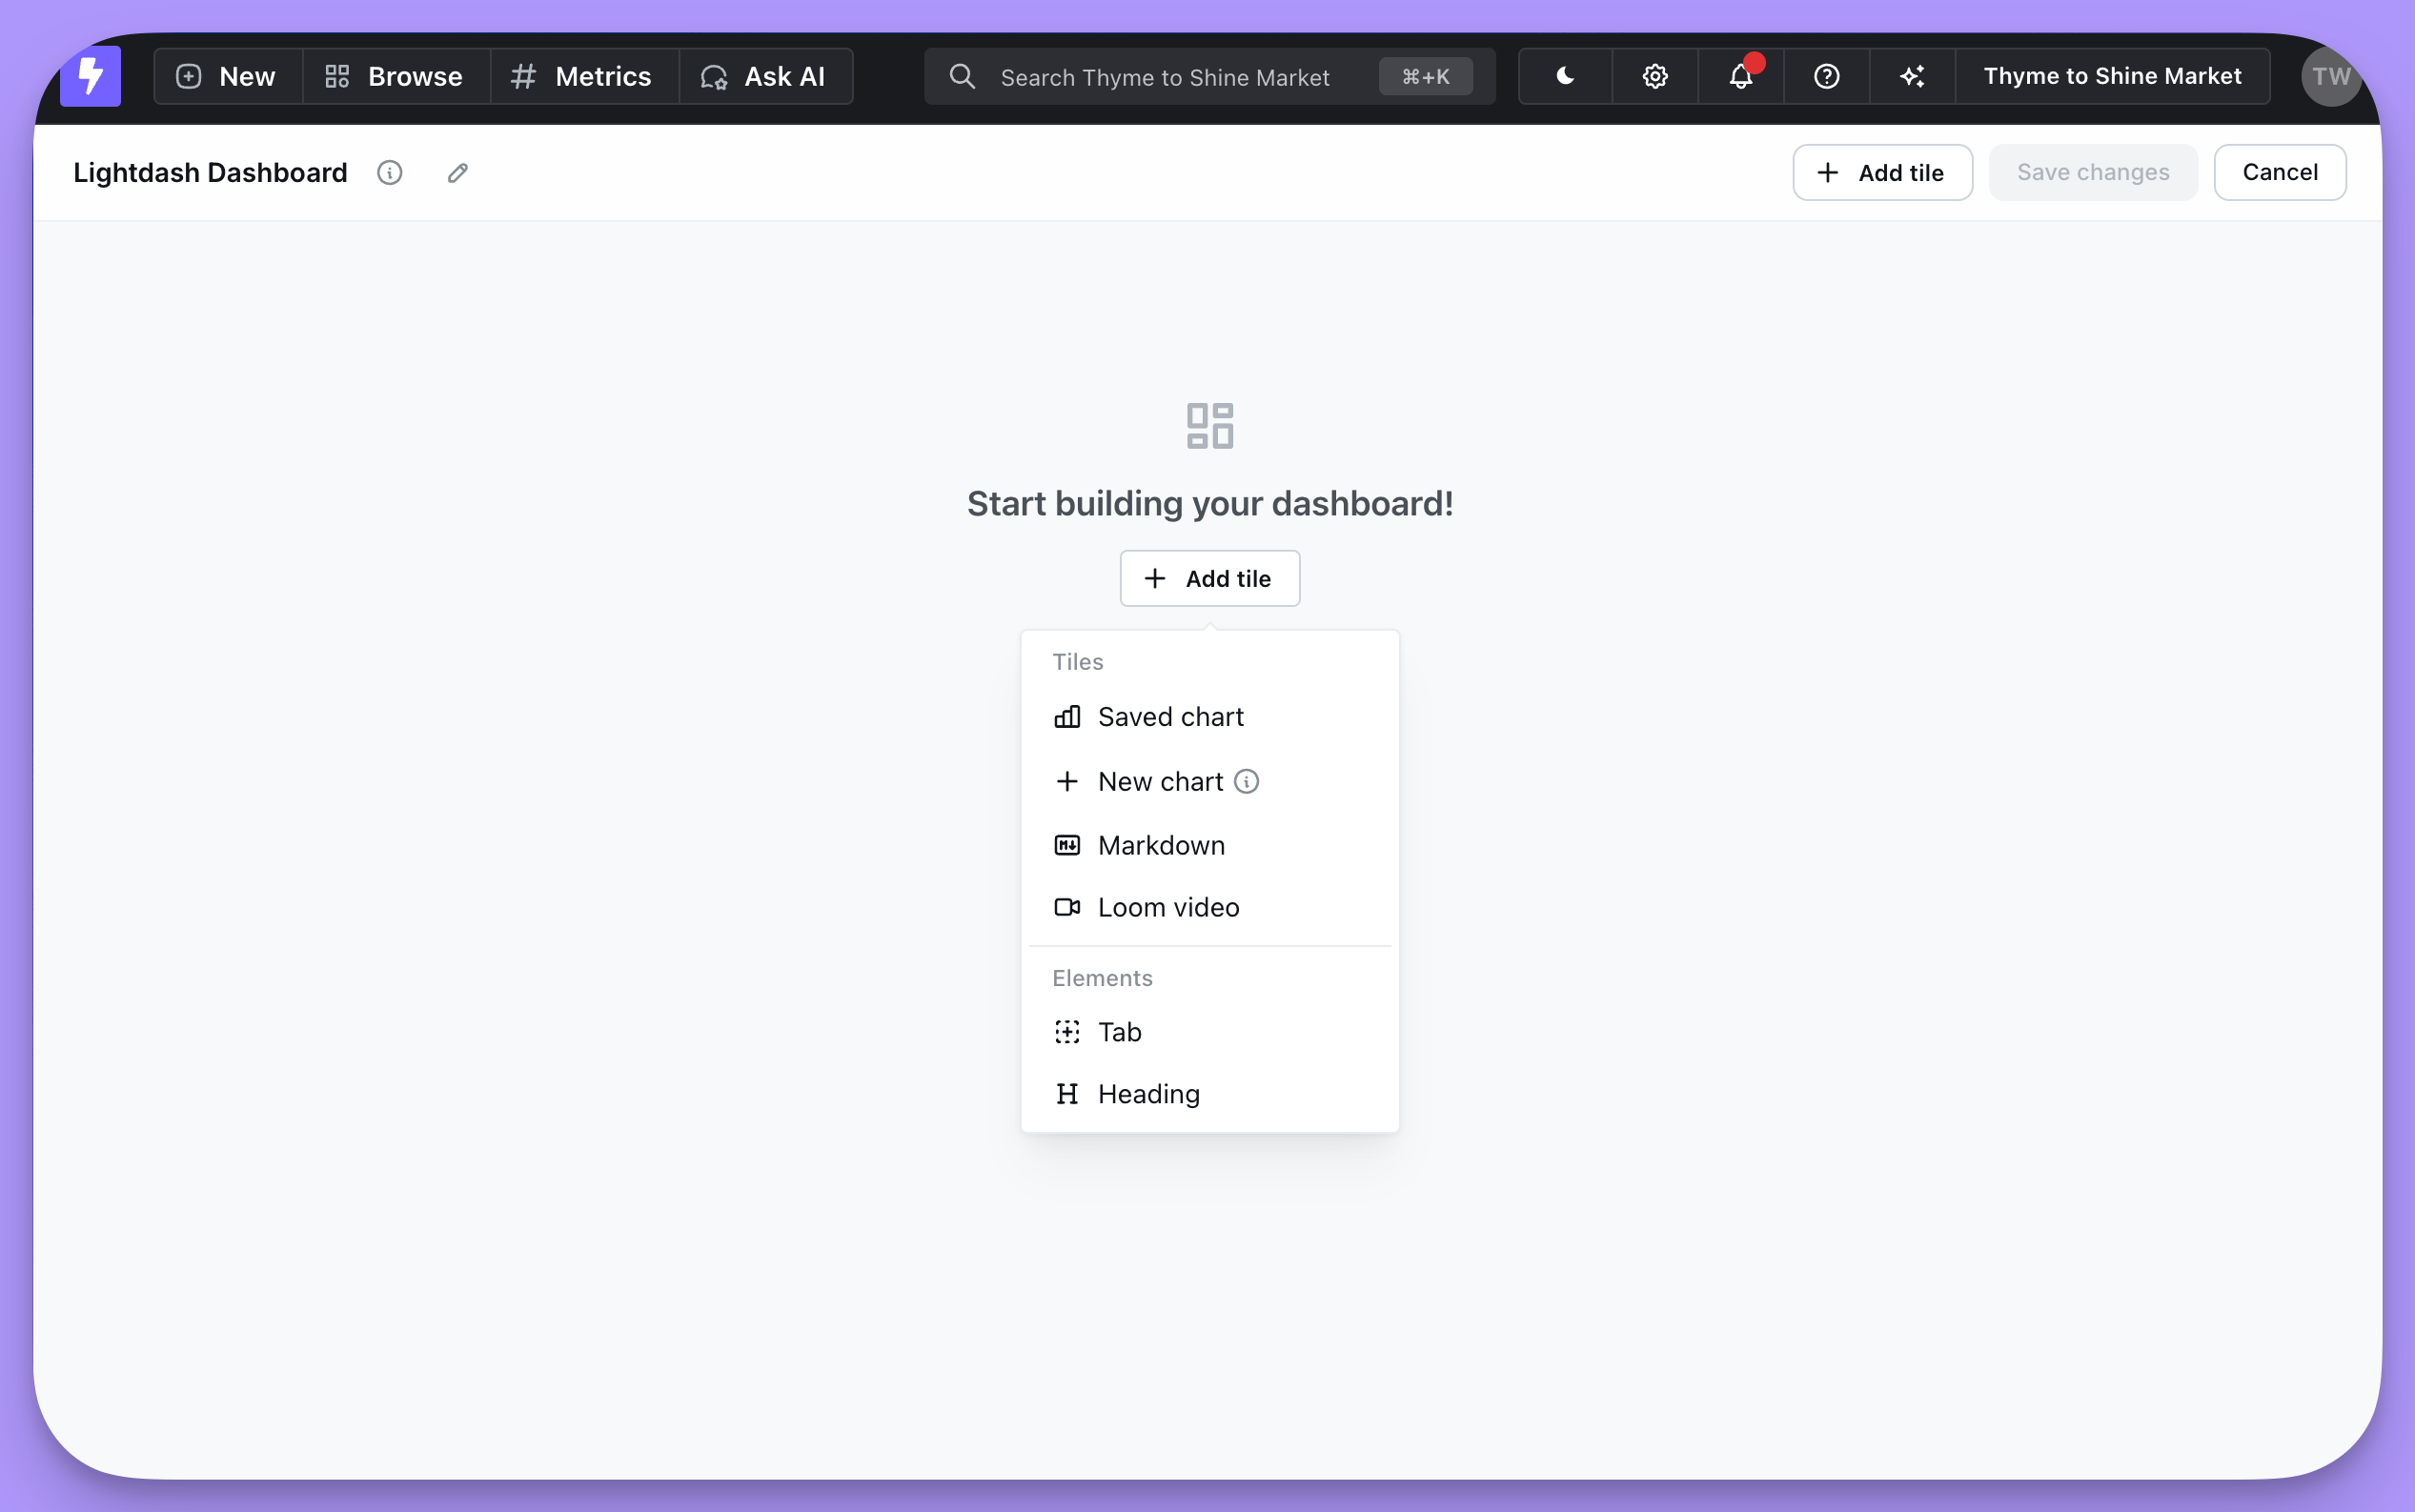
Add charts
You can create a new chart from within your dashboard, or add an existing one.Create a new chart
Creating charts from within a dashboard keeps your spaces and projects free of charts that are only used once. Click Add tile, then New chart, and you’ll be taken to the chart builder. Once you save the chart it appears at the bottom of your dashboard.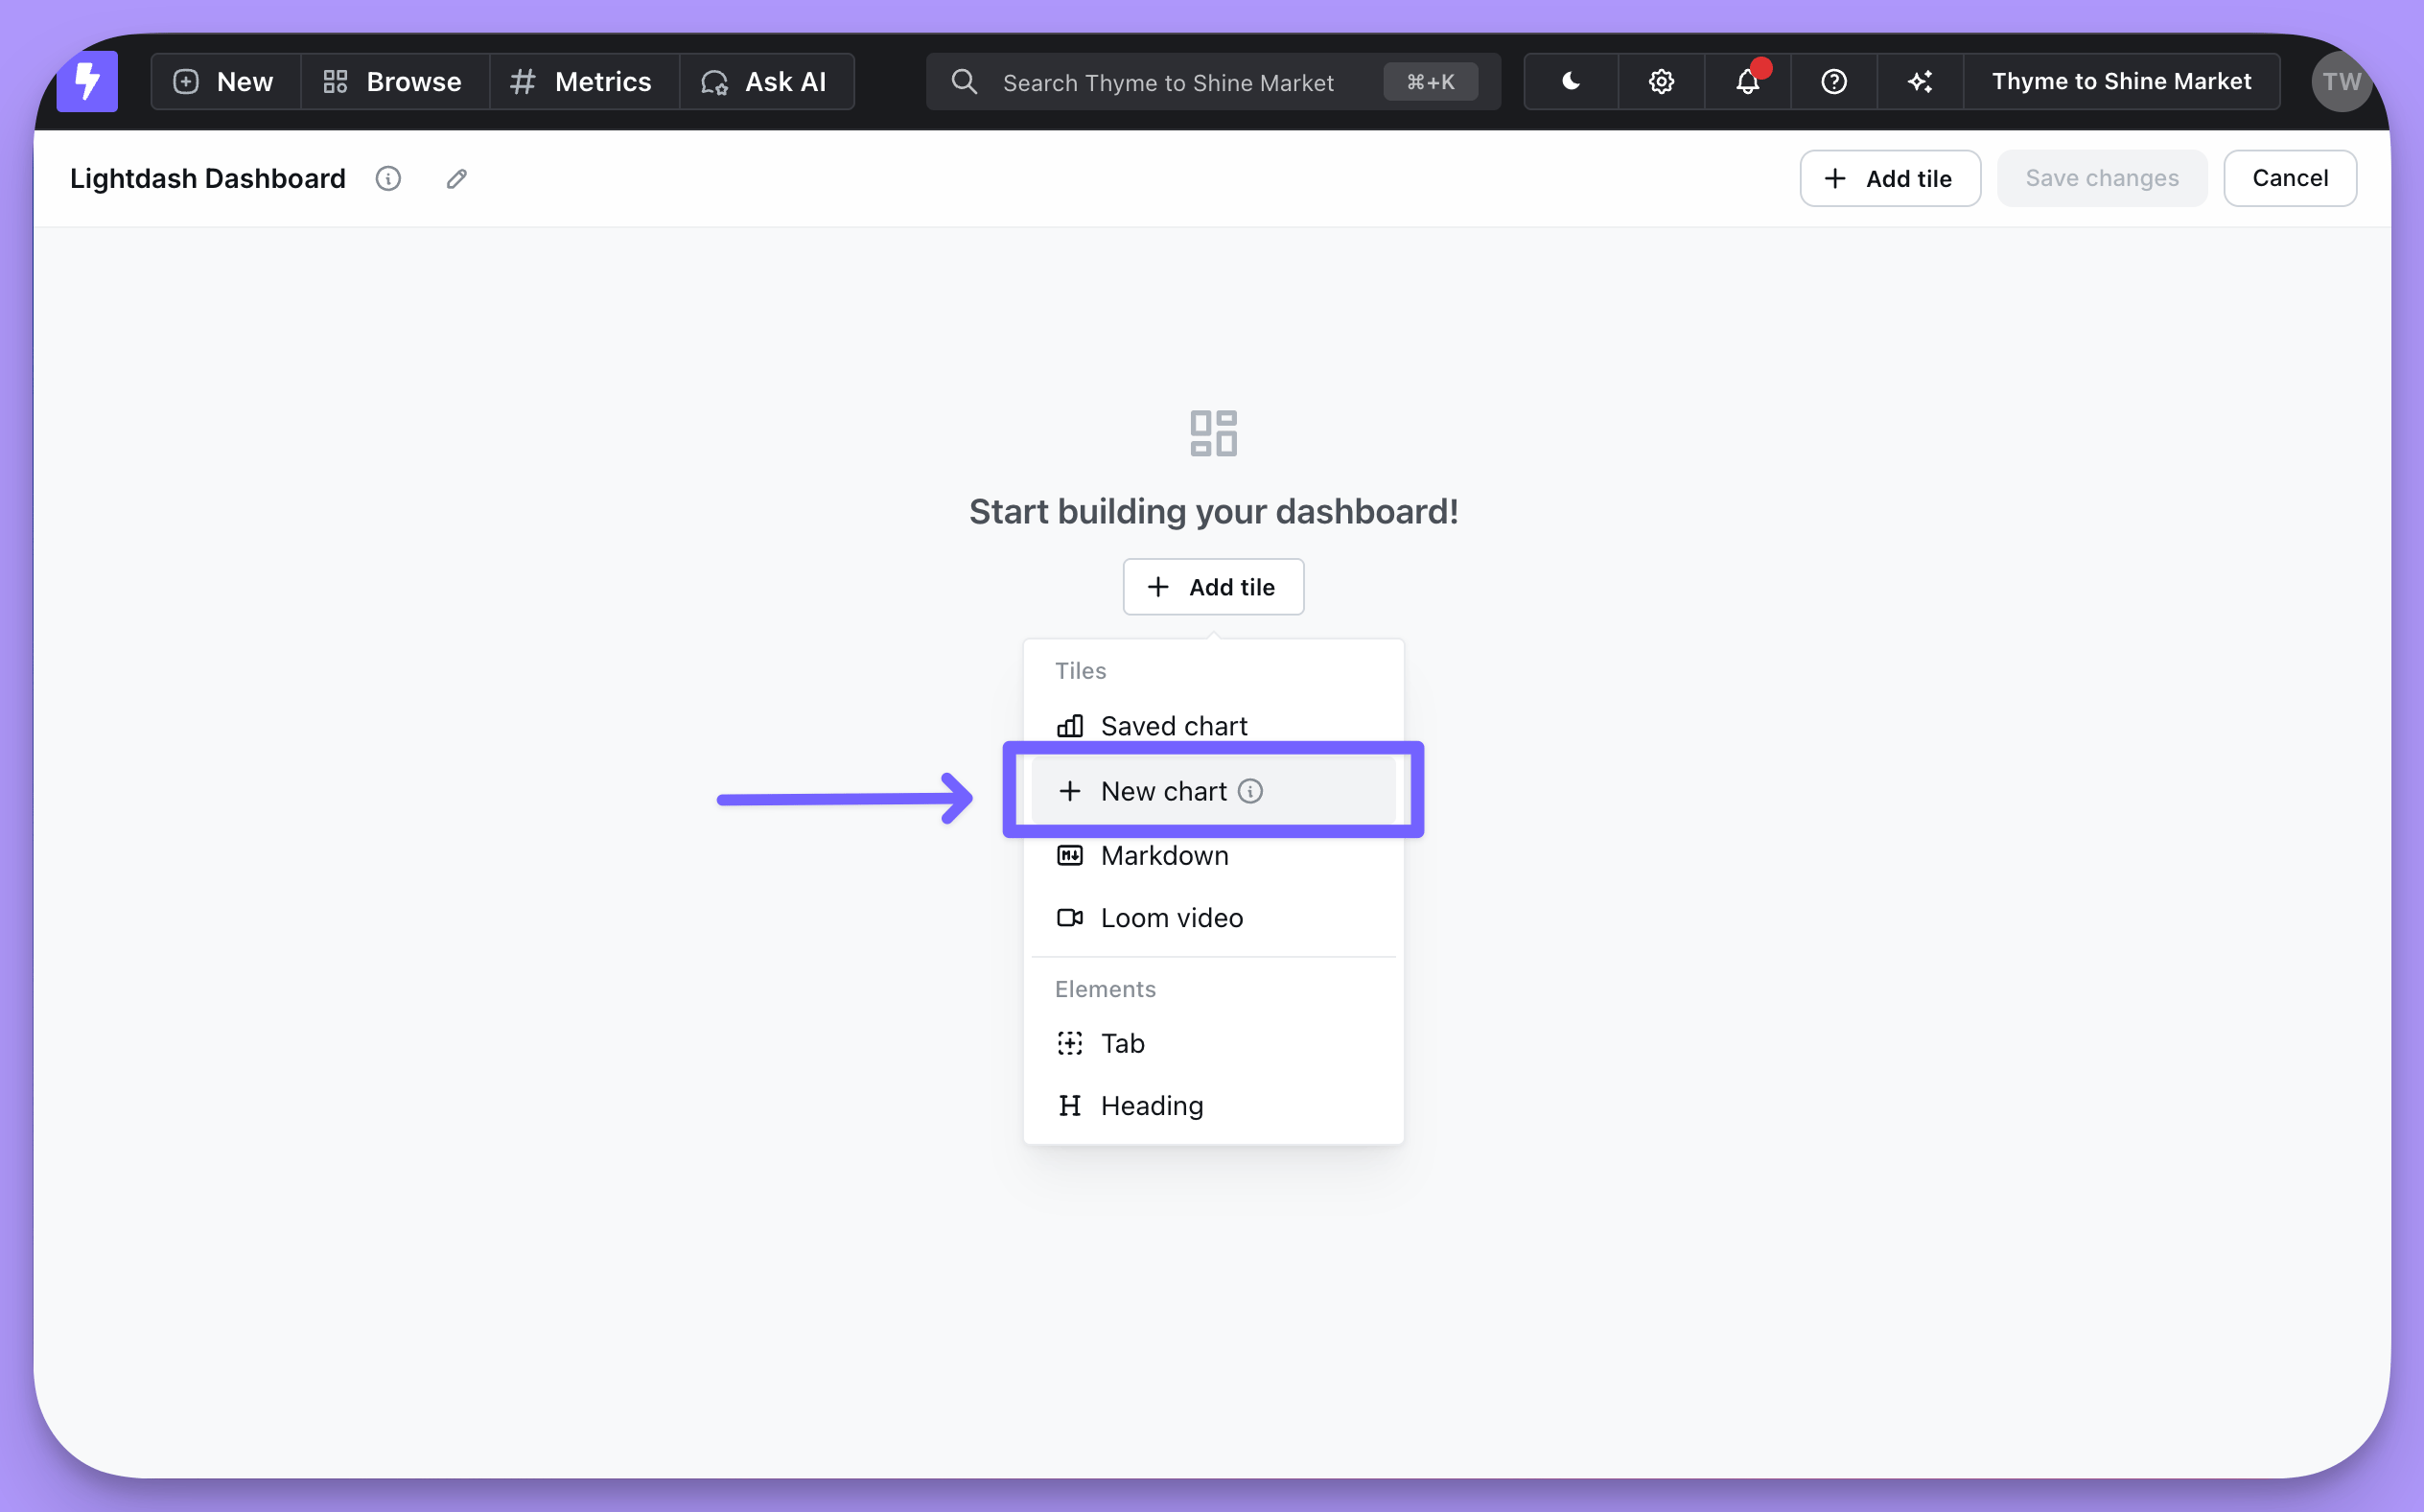
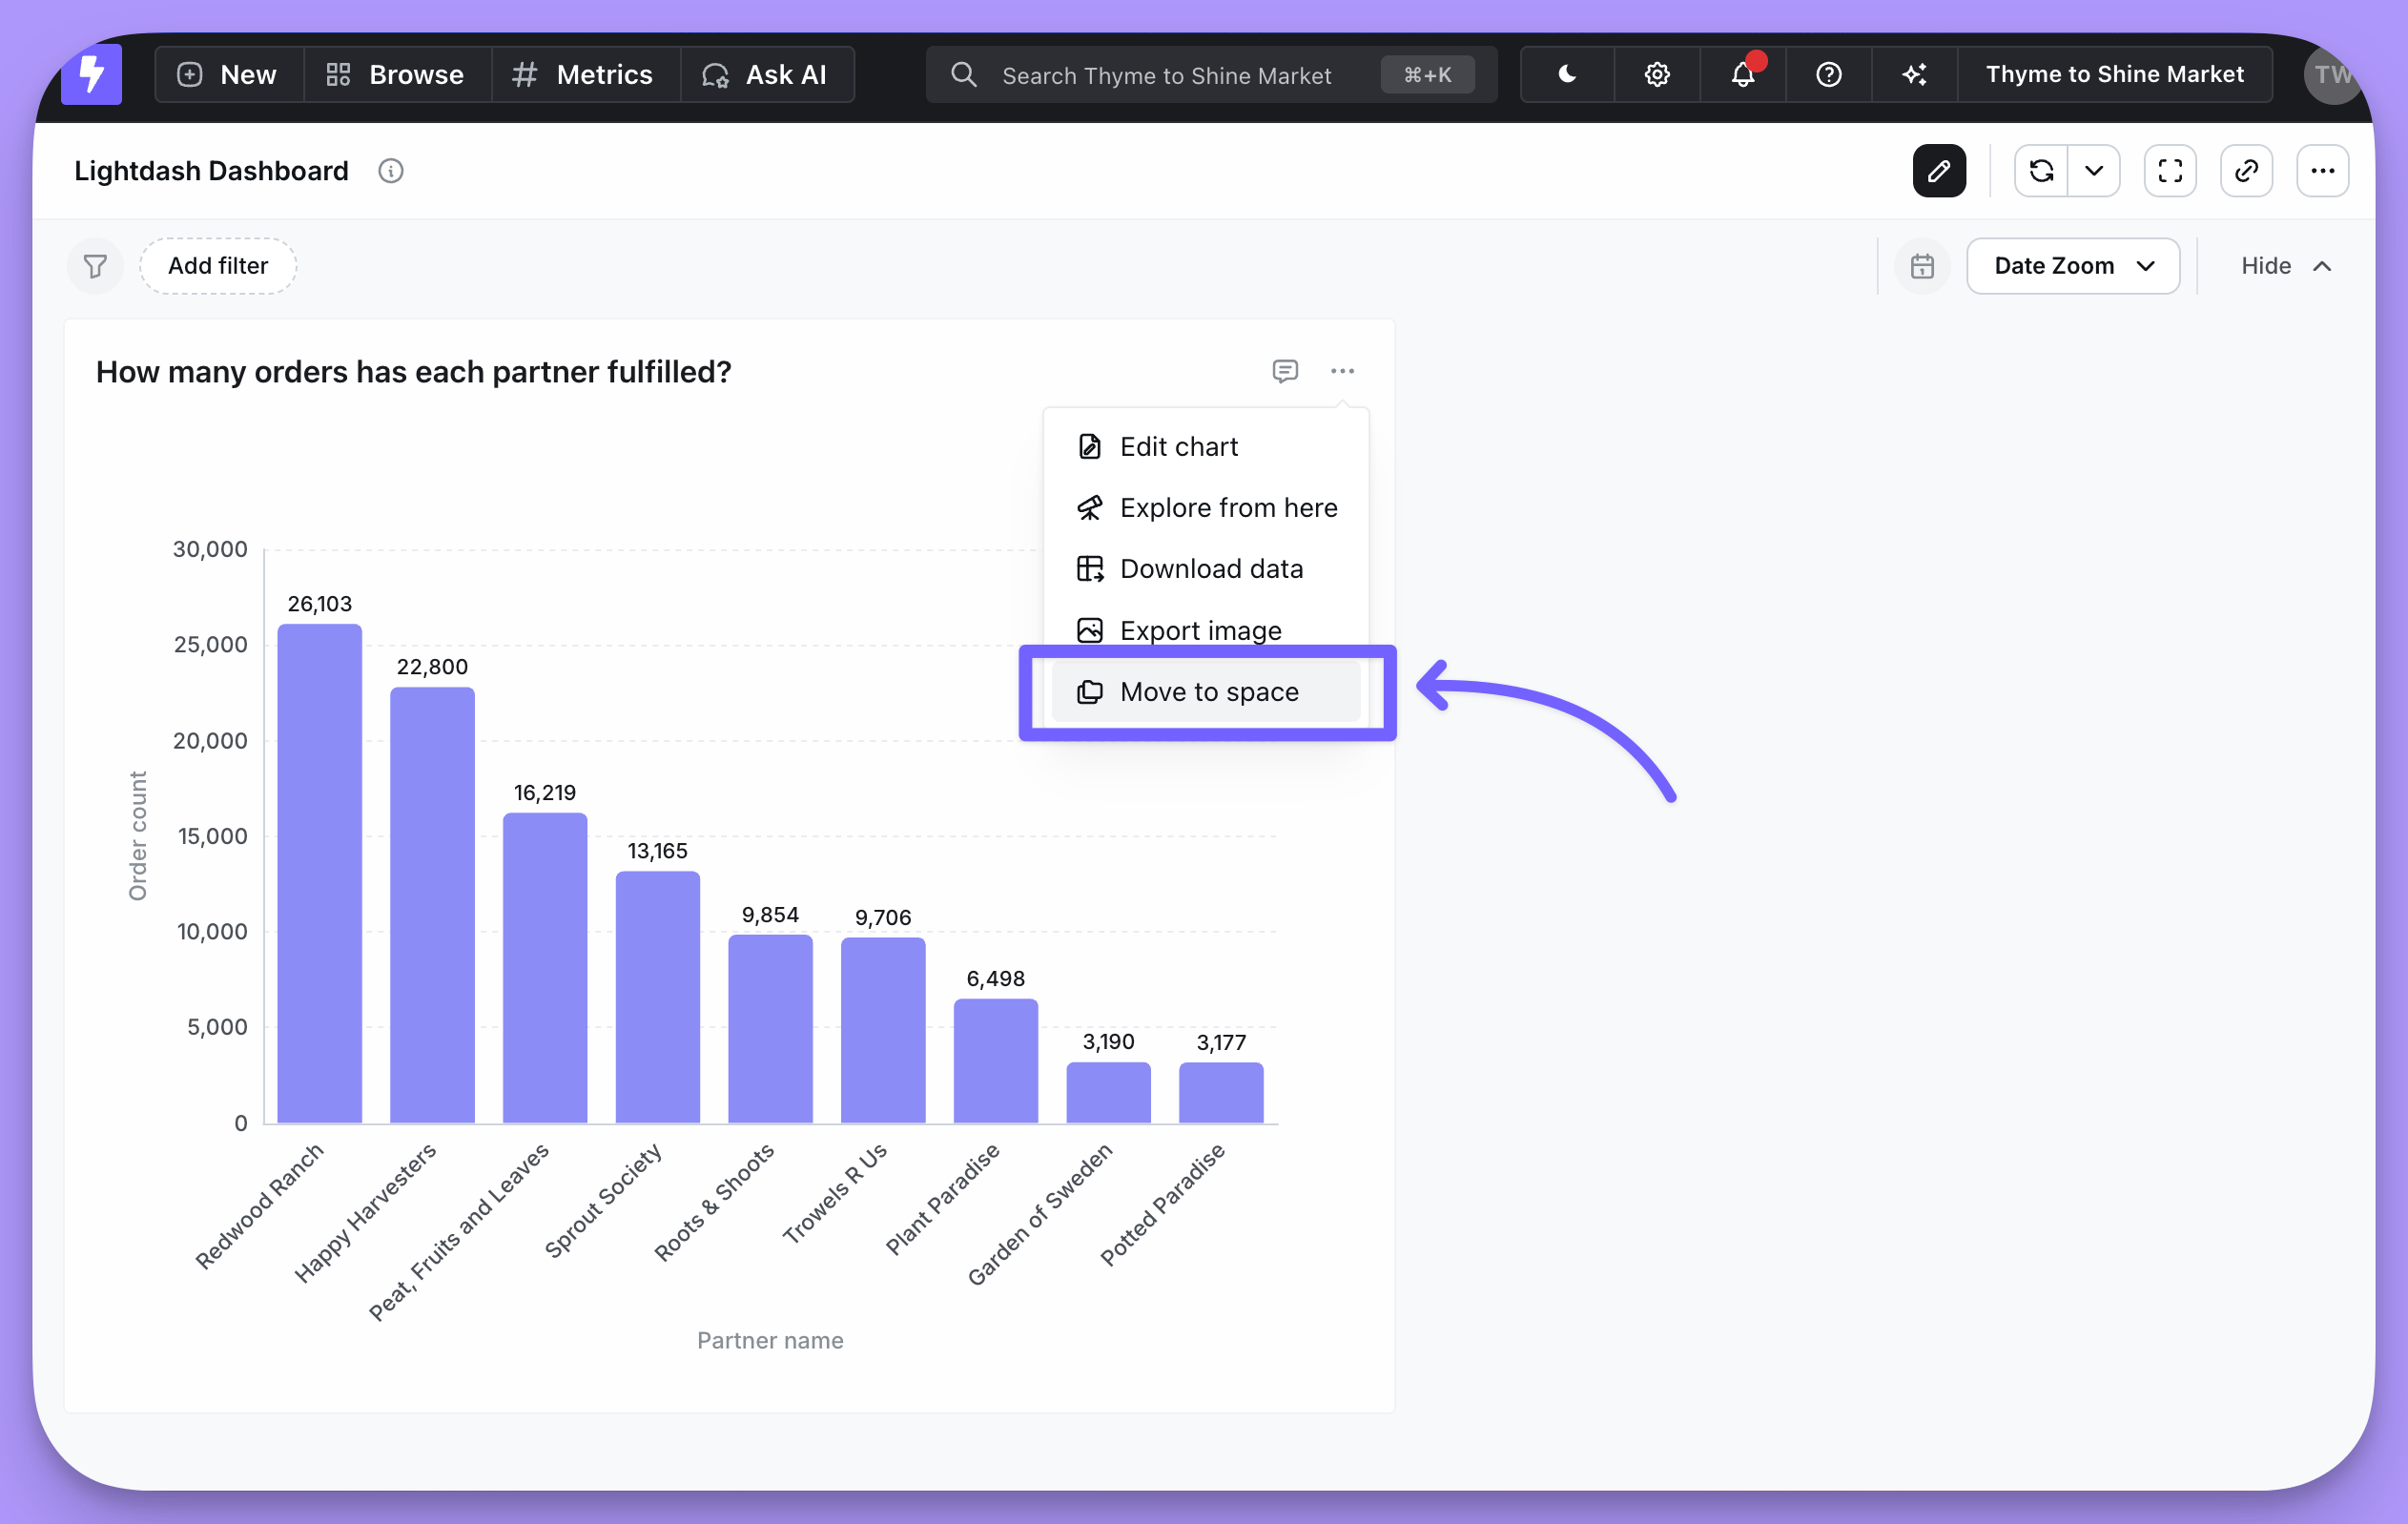
Add an existing chart
Click Add tile, then Saved chart. Clicking any chart adds it at the bottom of your dashboard.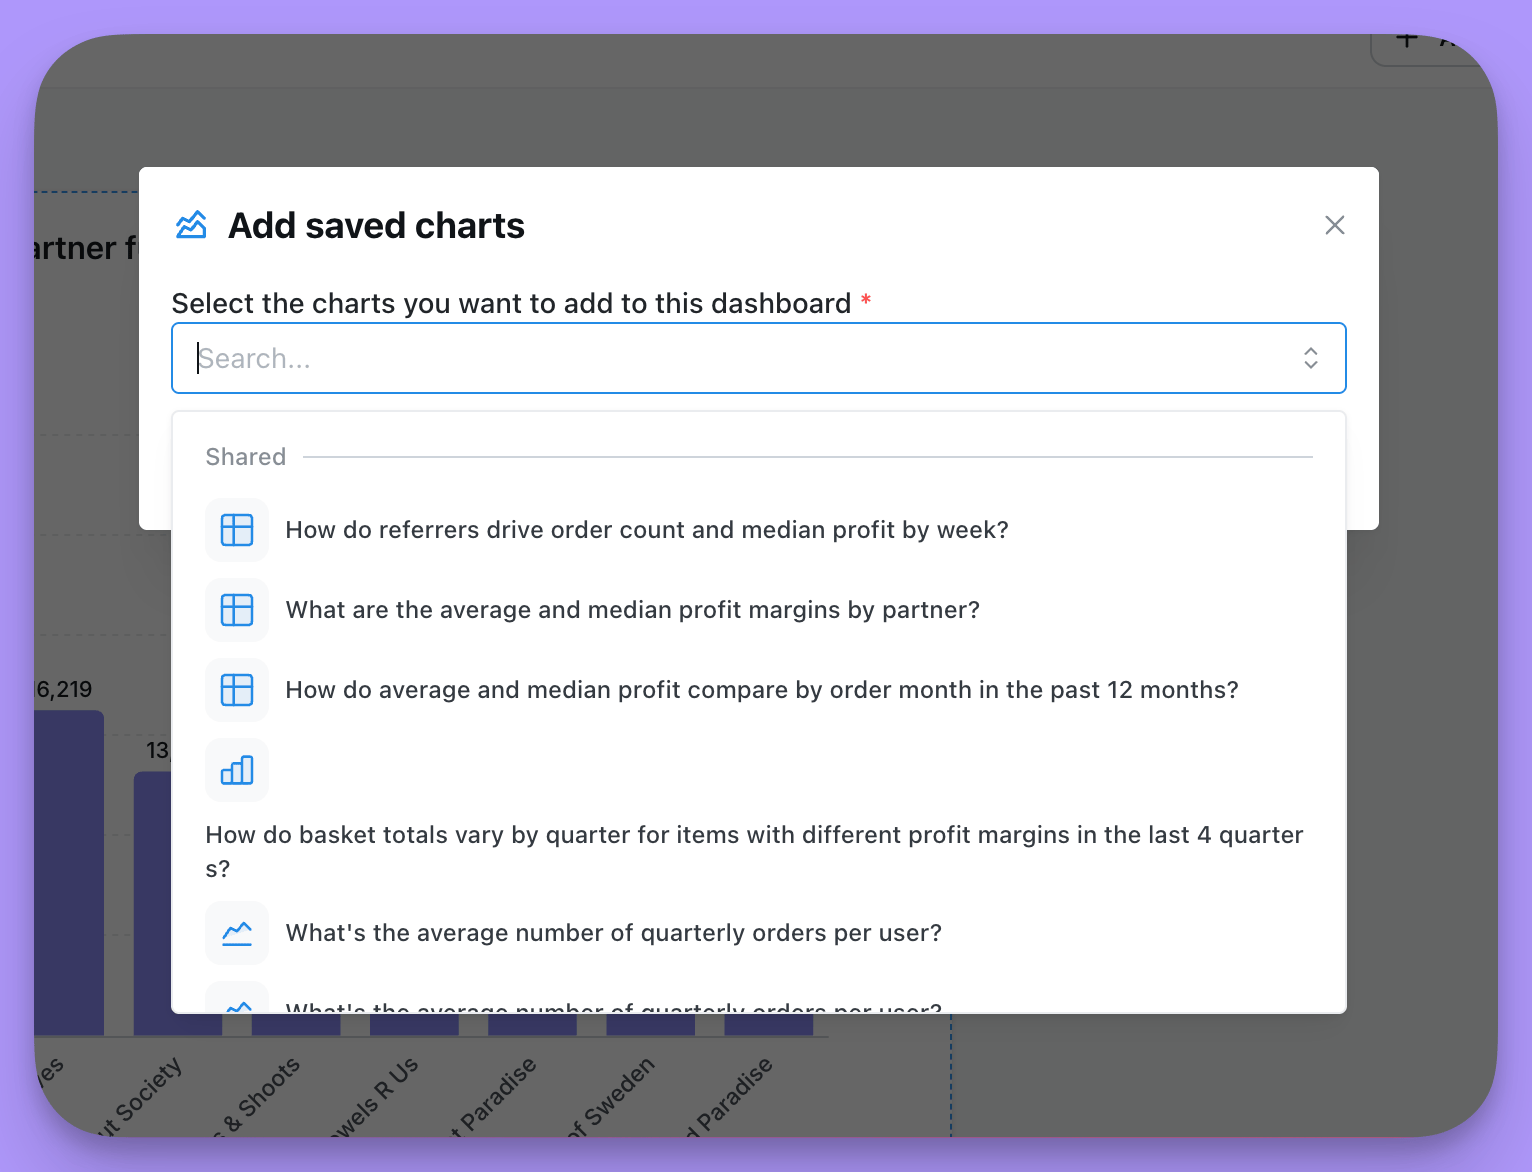
Add markdown and video tiles
Alongside charts, you can add markdown tiles and embedded Loom videos to explain the dashboard to the people using it.Markdown tiles
Markdown tiles take text with headers and formatting, code blocks, and images. The built-in editor provides most of the formatting you’ll need. To add an image hosted on the web, such as your company logo, paste the image URL into the tile using standard markdown image syntax: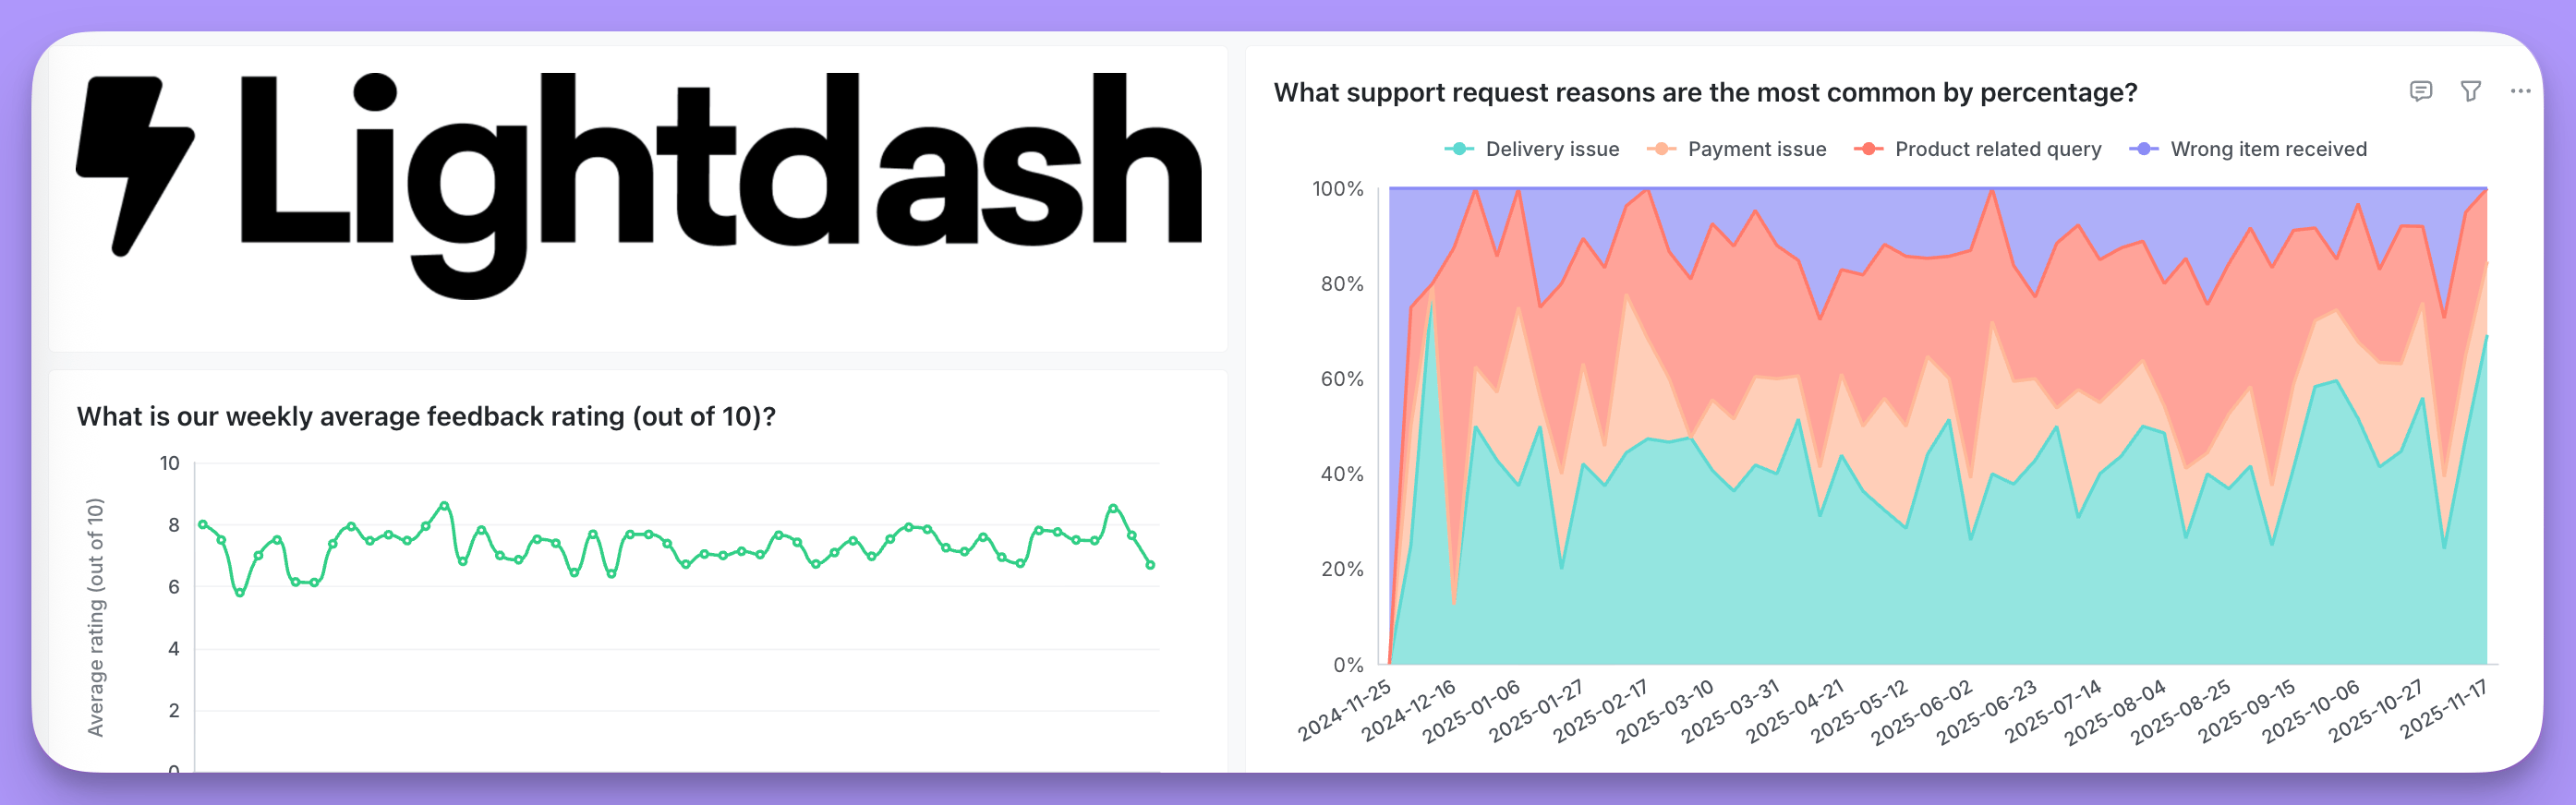
Responsive images
To keep images scaling properly as the dashboard resizes, use inline CSS with responsive properties so they aren’t stretched or distorted on different screen sizes.max-width and min-width for width bounds, max-height and min-height for height bounds, height:auto to maintain aspect ratio, and object-fit to control how images fit (for example contain or cover).
Backgrounds and inline HTML
You can add background colors to markdown tiles to emphasize sections or titles.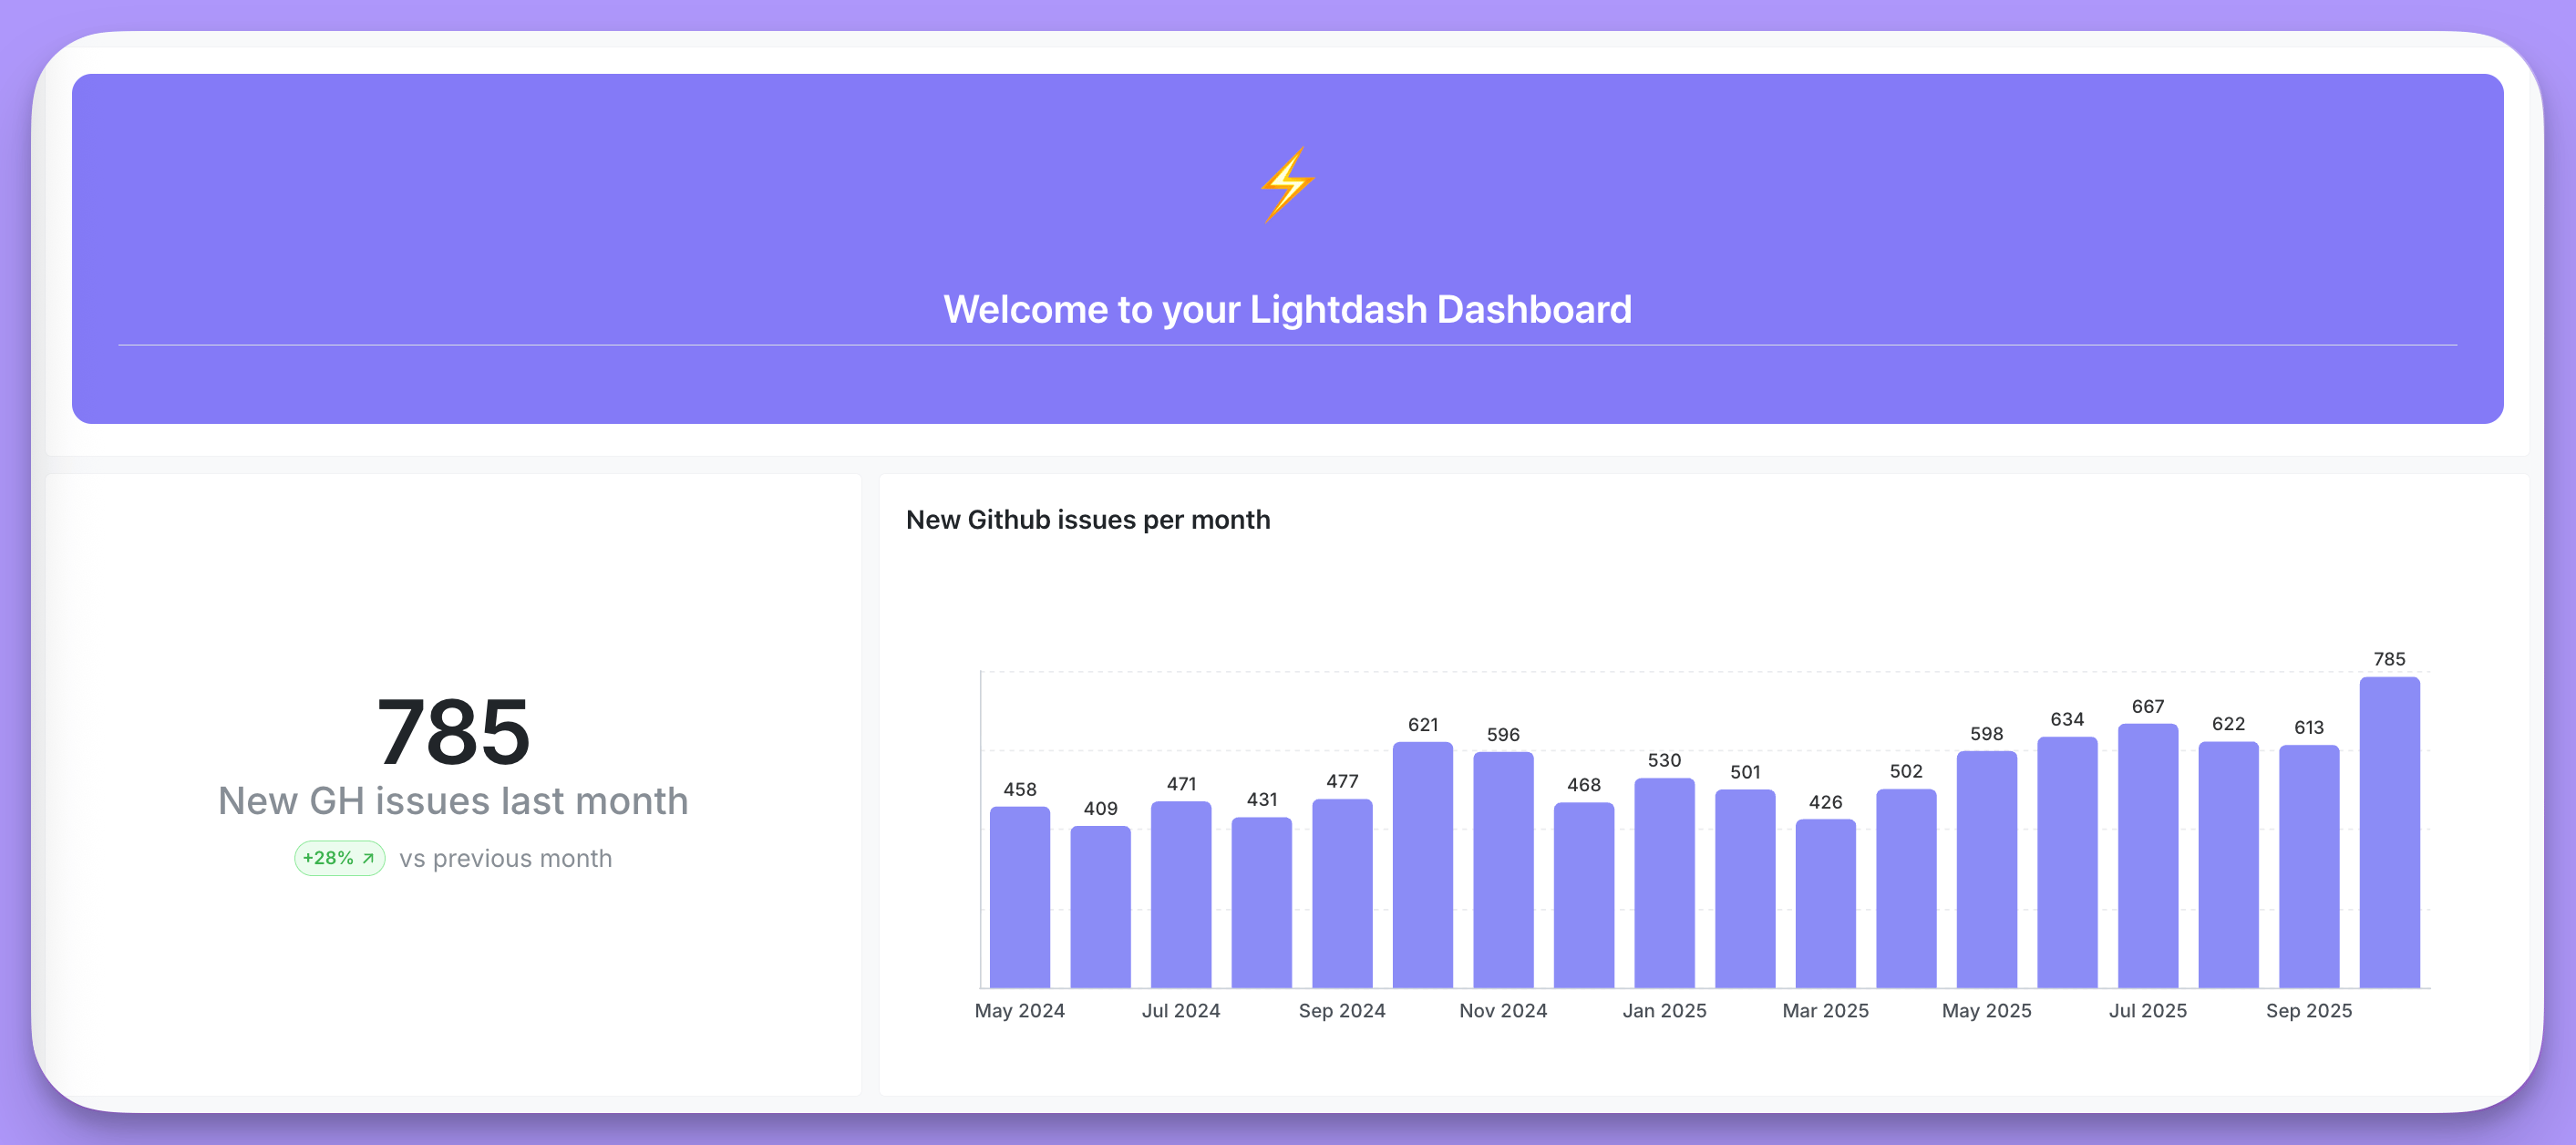
Other HTML markdown tile options
Other HTML markdown tile options
Loom tiles
Click the Loom video option, then enter a URL and a title for the tile.Save your dashboard
When you’re happy with the layout, hit Save. You can see every saved dashboard in your project under Browse → All dashboards.Assign an owner
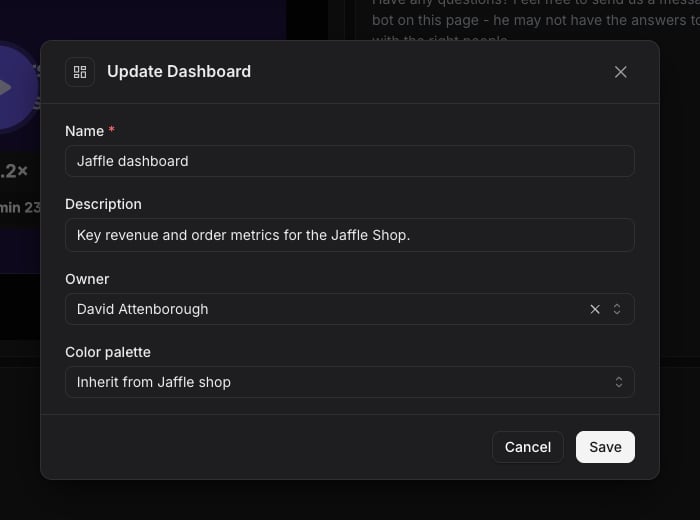
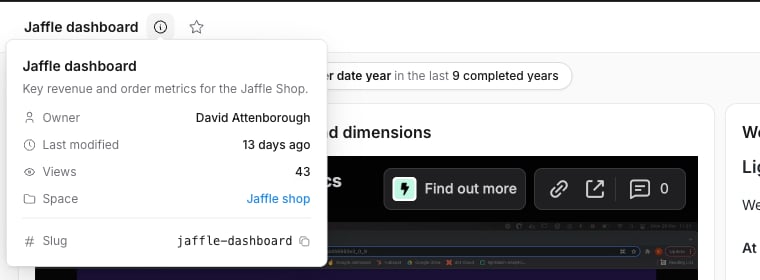
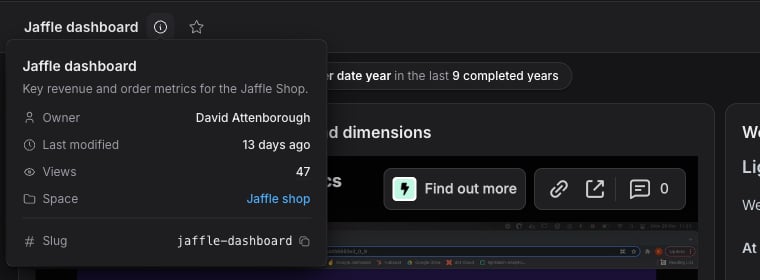
A dashboard can have one owner: the person responsible for keeping it accurate and maintained. The owner is shown wherever people find the dashboard, so anyone with a question knows who to ask. To assign or change the owner, open the dashboard’s three-dot menu, choose Edit details, and pick a person in the Owner field. Clear the field to leave the dashboard without an owner. The same form opens from Rename on a dashboard’s row under Browse → All dashboards.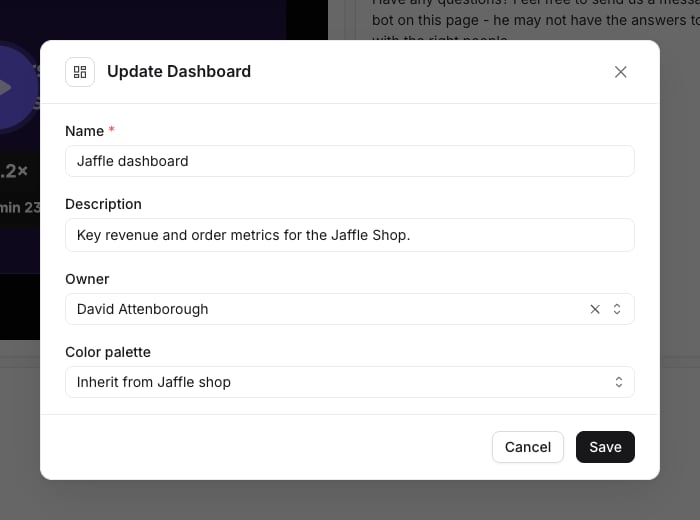
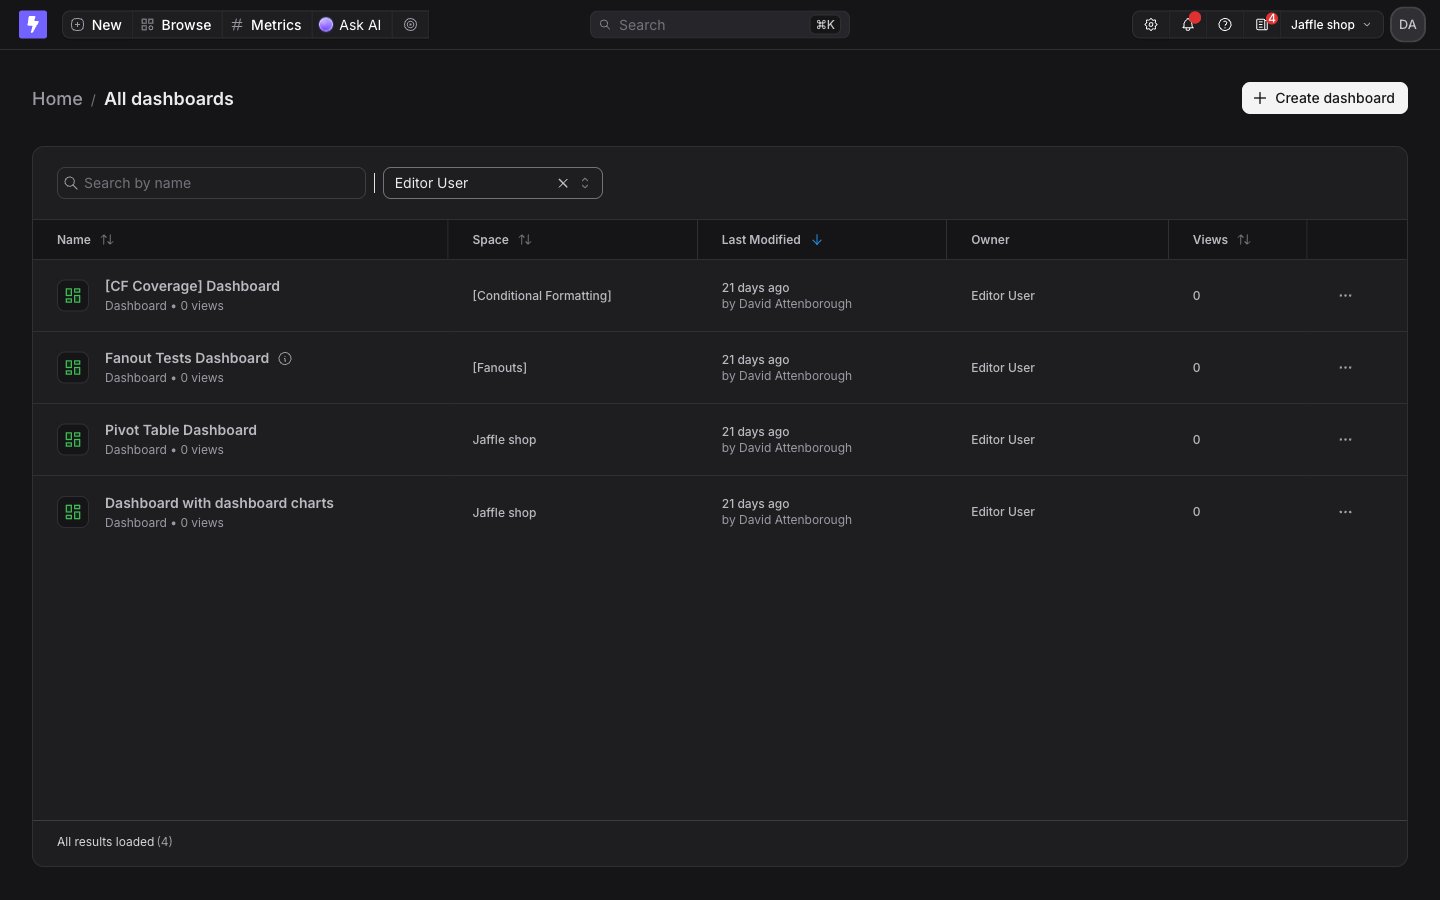
Find dashboards by owner
Browse → All dashboards has an Owner column, and the Filter by owner picker in the toolbar narrows the list to one person’s dashboards. Use it to review everything a teammate is responsible for, or to reassign their dashboards one by one from each row’s three-dot menu.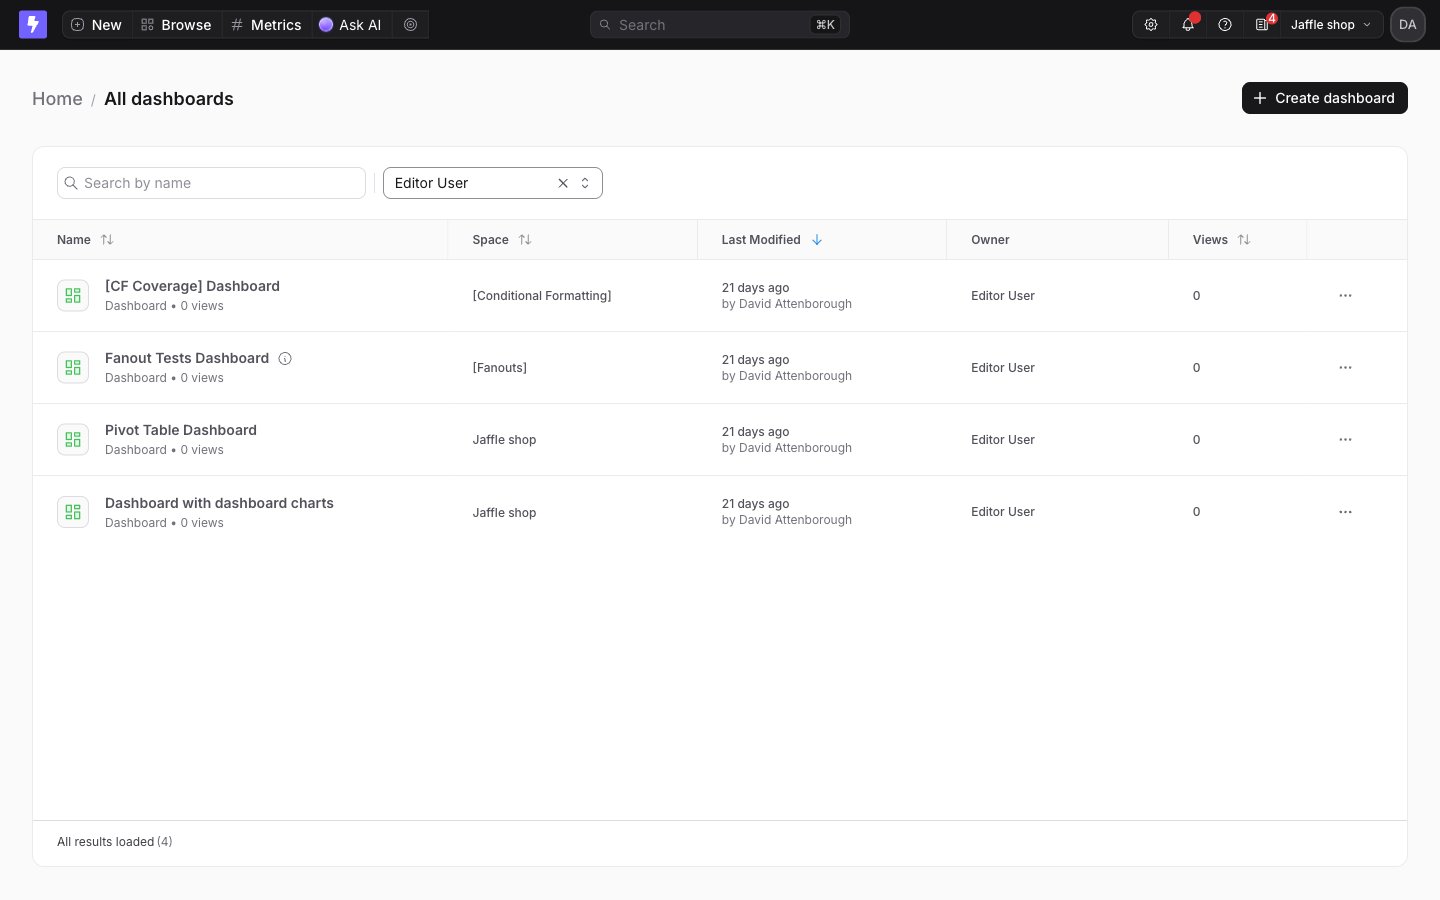
When an owner leaves
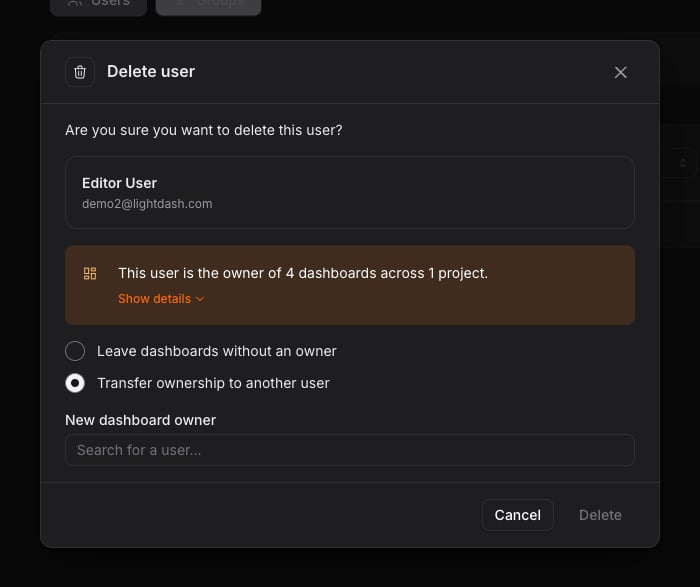
When an admin deletes a user from Settings → Users & groups, the confirmation shows how many dashboards that person owns, broken down by project. The admin can transfer all of them to another member in the same step, or leave them without an owner and reassign later from All dashboards.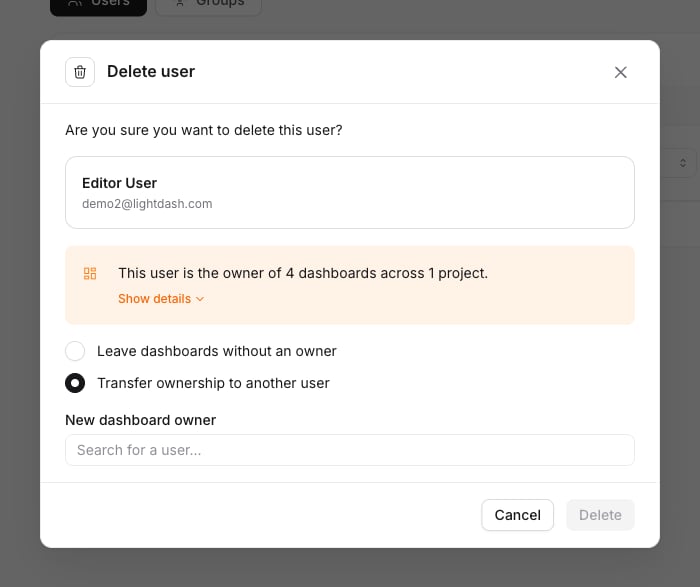
ownerEmail field.
Add filters
Dashboard filters let you change the data in every tile at once. In edit mode, click Add filter, pick a field and a value, and hit Apply; save the dashboard to keep the filter for everyone who opens it. Filters do a lot more than that — temporary filters that only you see, filters that viewers must fill in before the dashboard loads, and per-tile control over which fields a filter applies to. See dashboard filters for the full behavior.Add tabs
As a dashboard grows it may end up supporting multiple teams and use cases. Tabs organize it. Reach for them to:- Break up high level goals or themes, e.g. Revenue, Retention, Engagement
- Separate views for different audiences, e.g. Executive Summary vs. Team-level detail
- Avoid clutter and performance issues in dashboards with lots of tiles, e.g. split 30+ charts into three tabs based on priority or groupings like the first and second bullets above
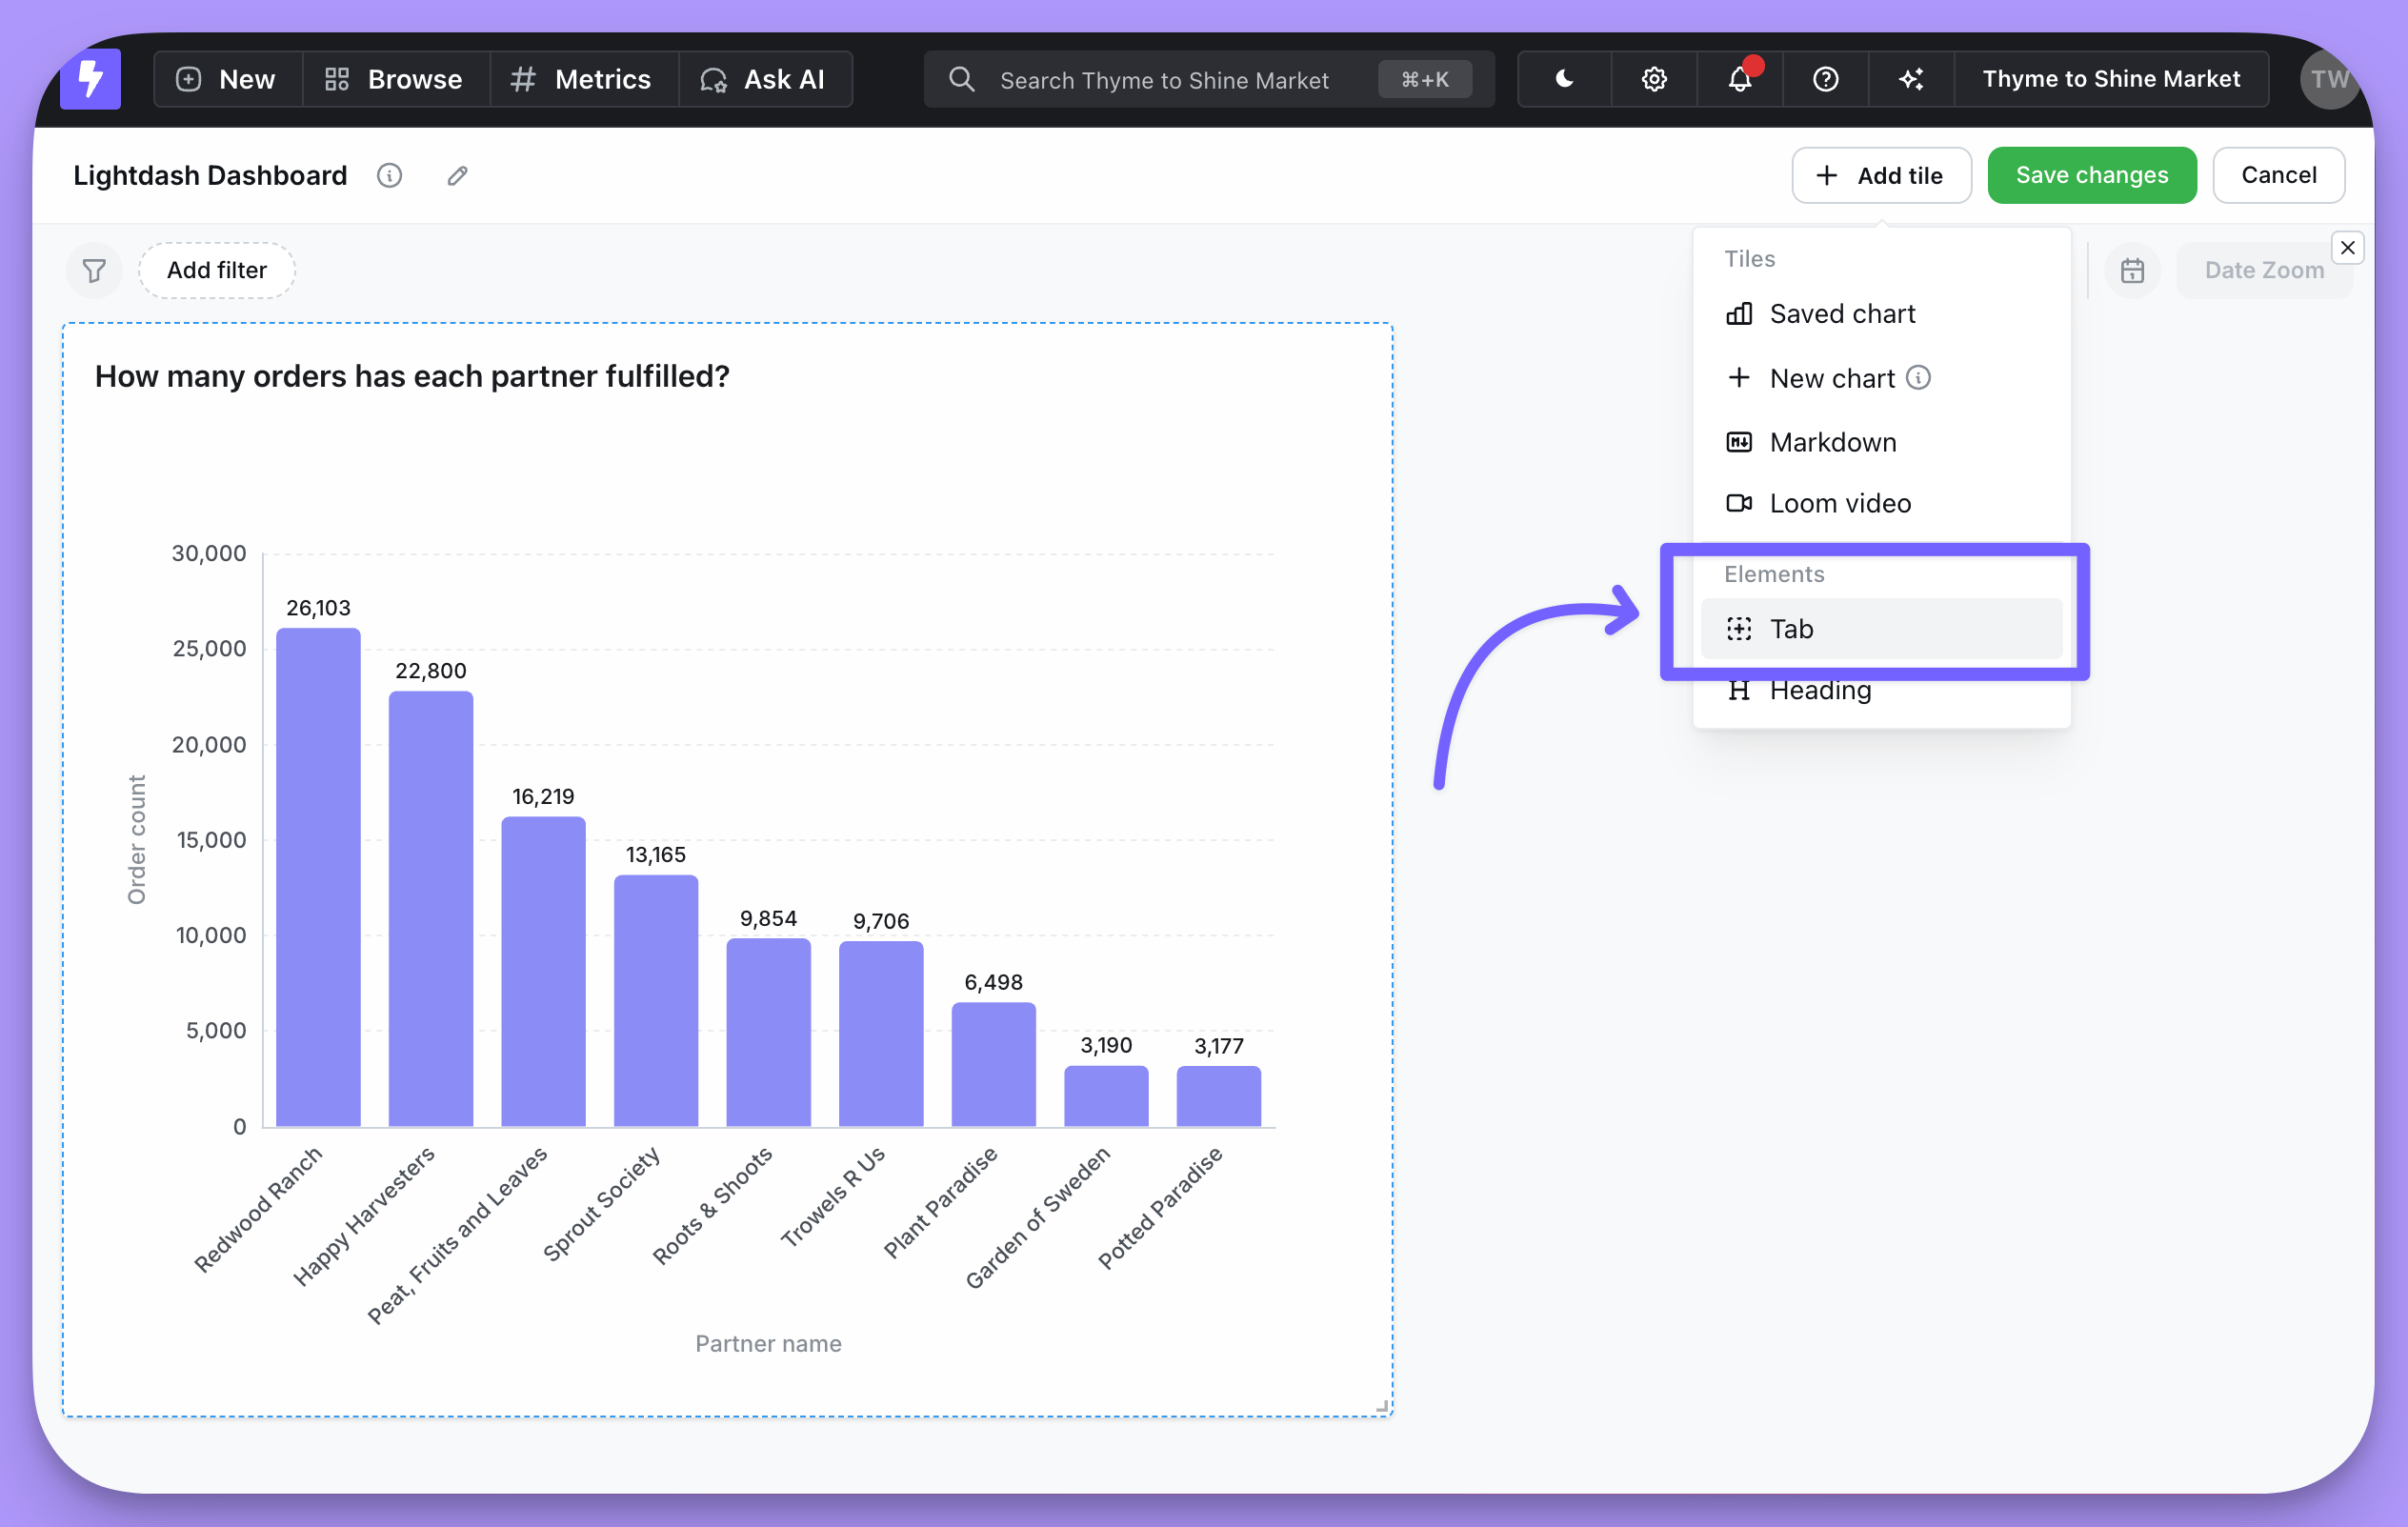
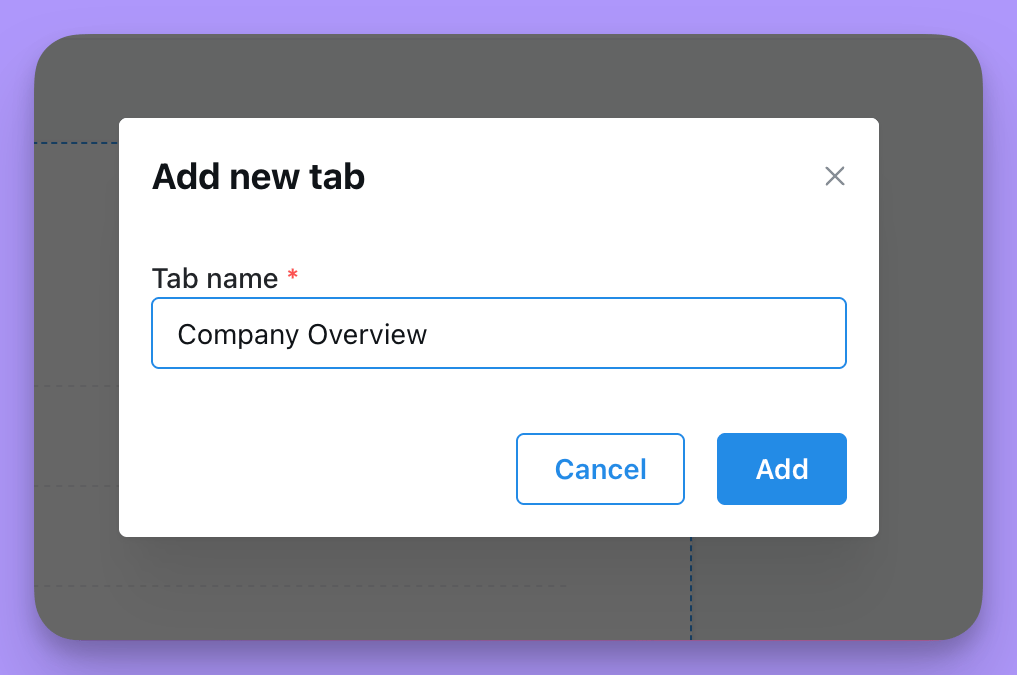
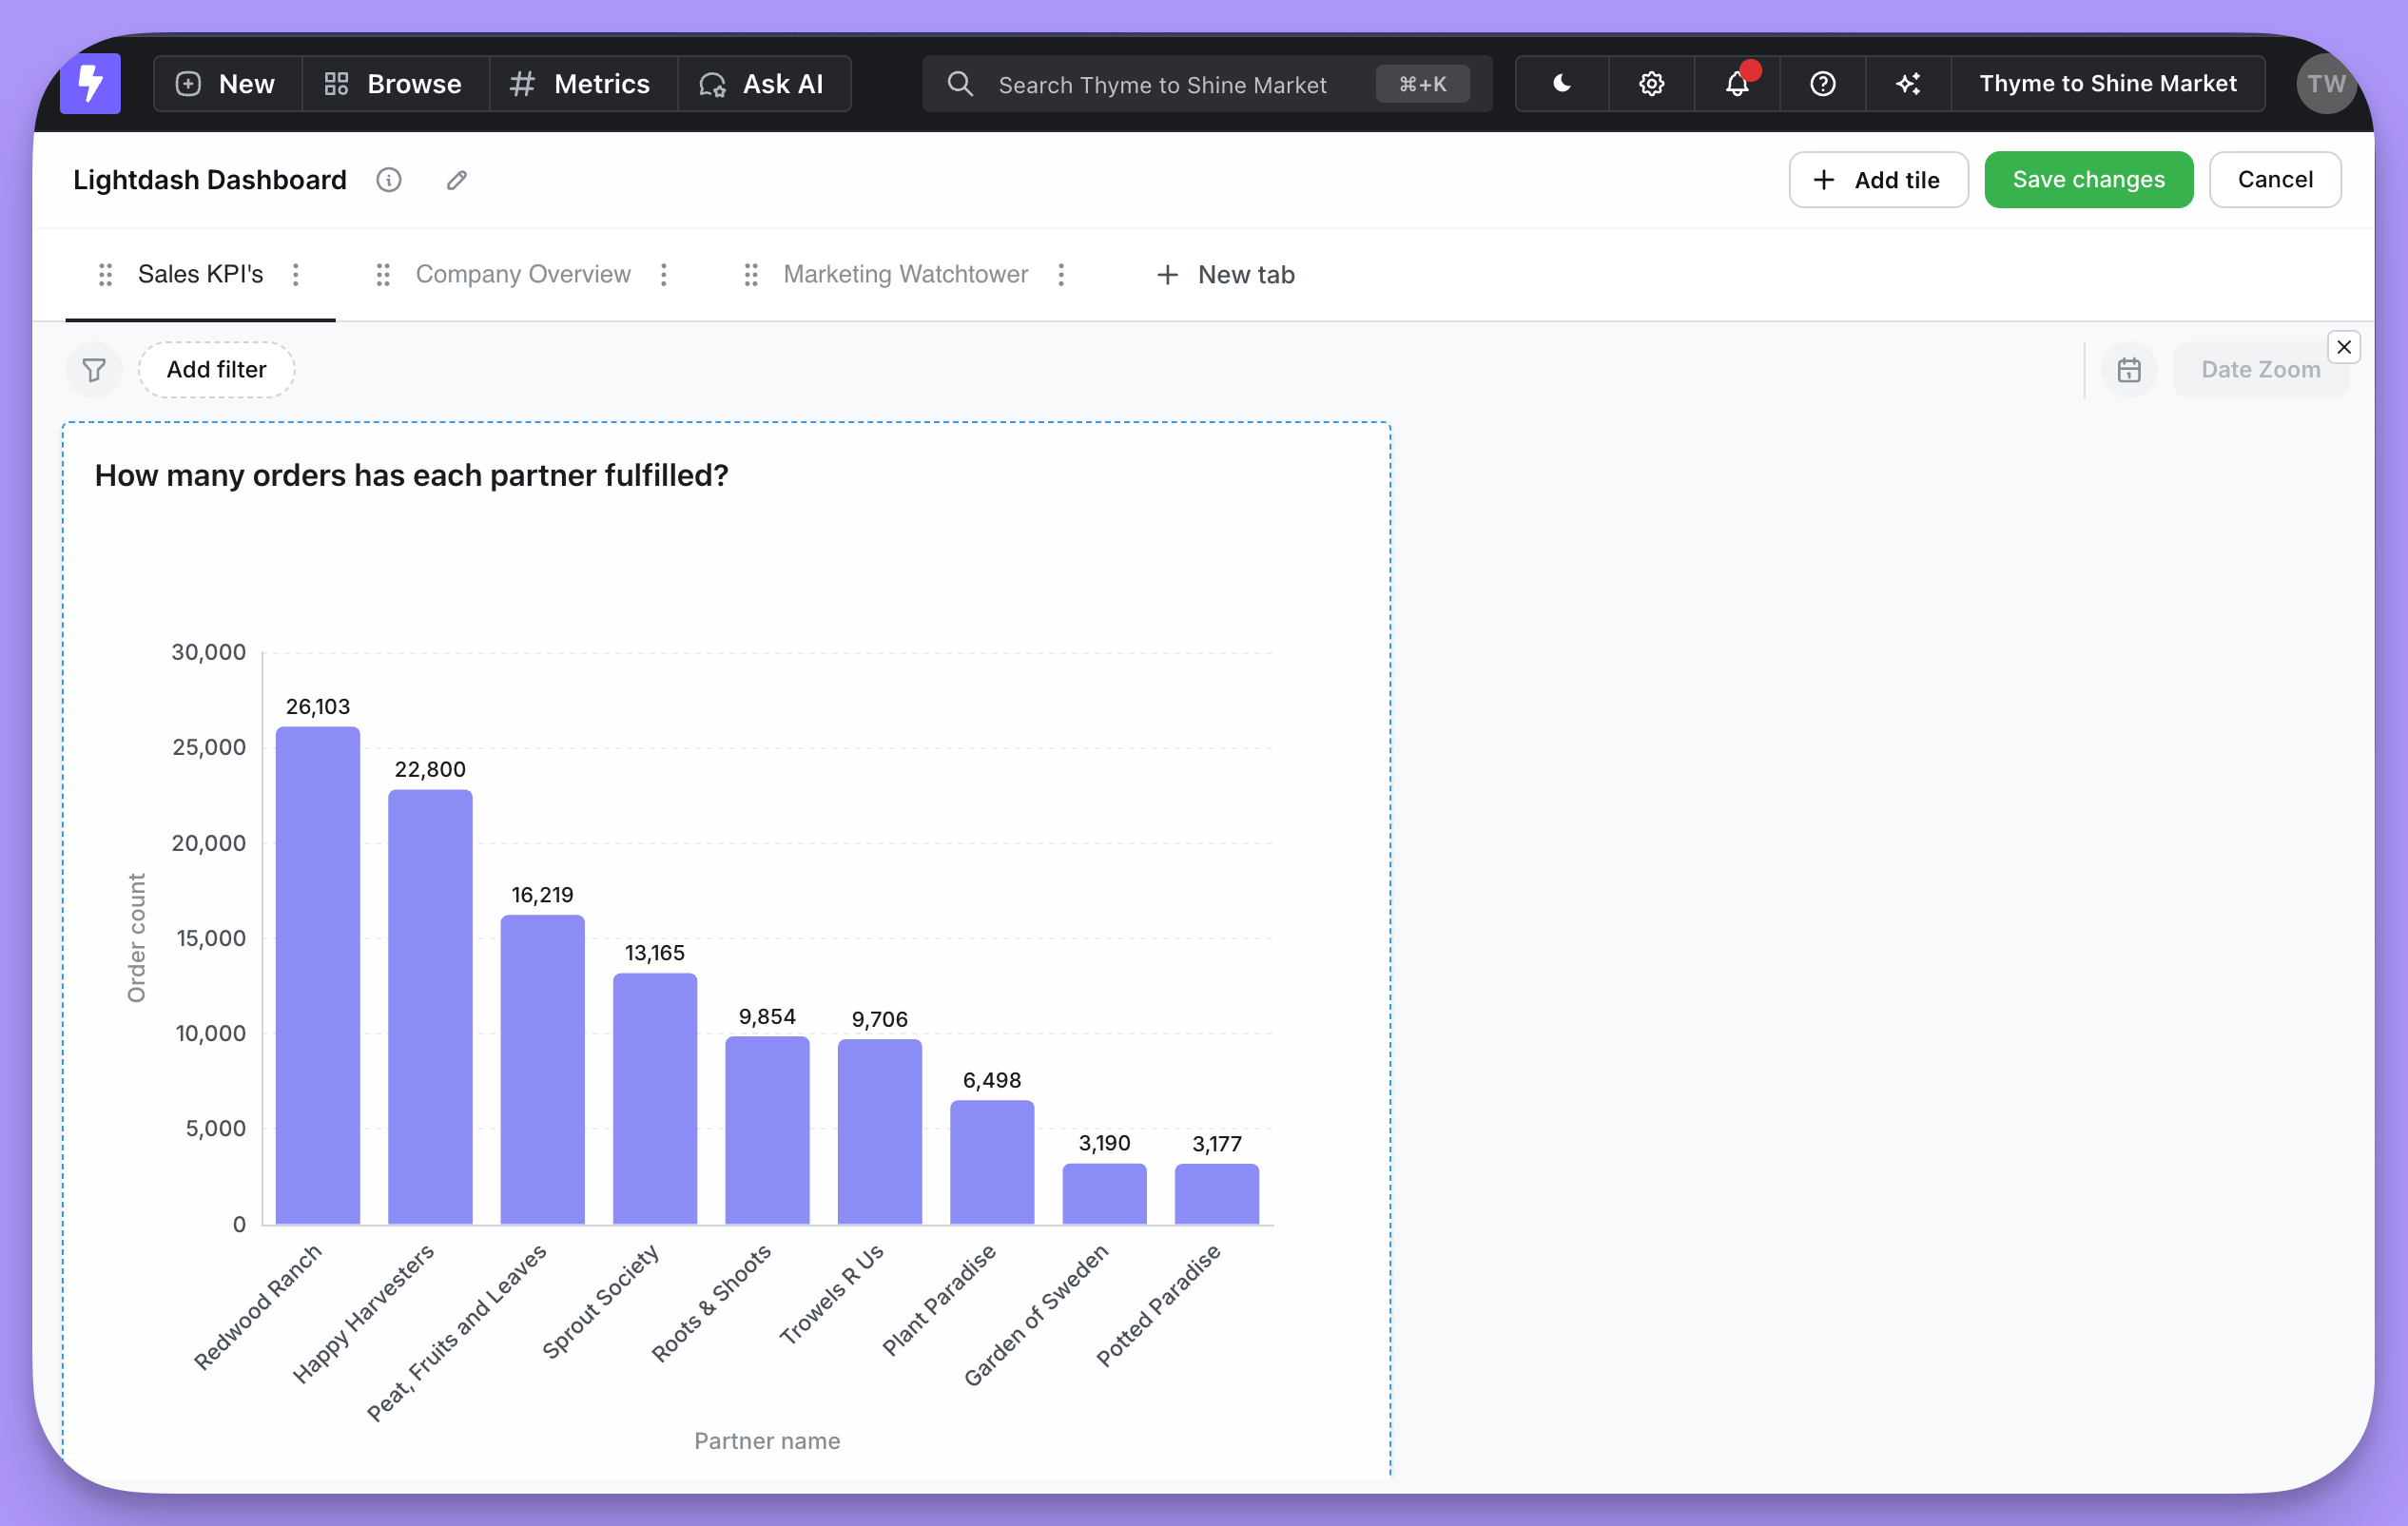
Editing and removing tabs
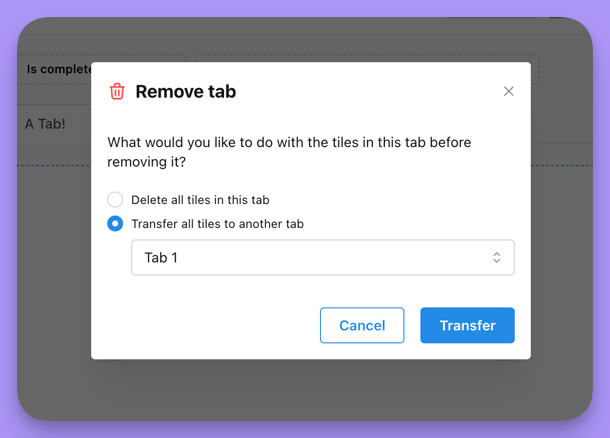
To edit a tab, click the edit icon to the right of its name while in dashboard edit mode. From there you can rename the tab or remove it.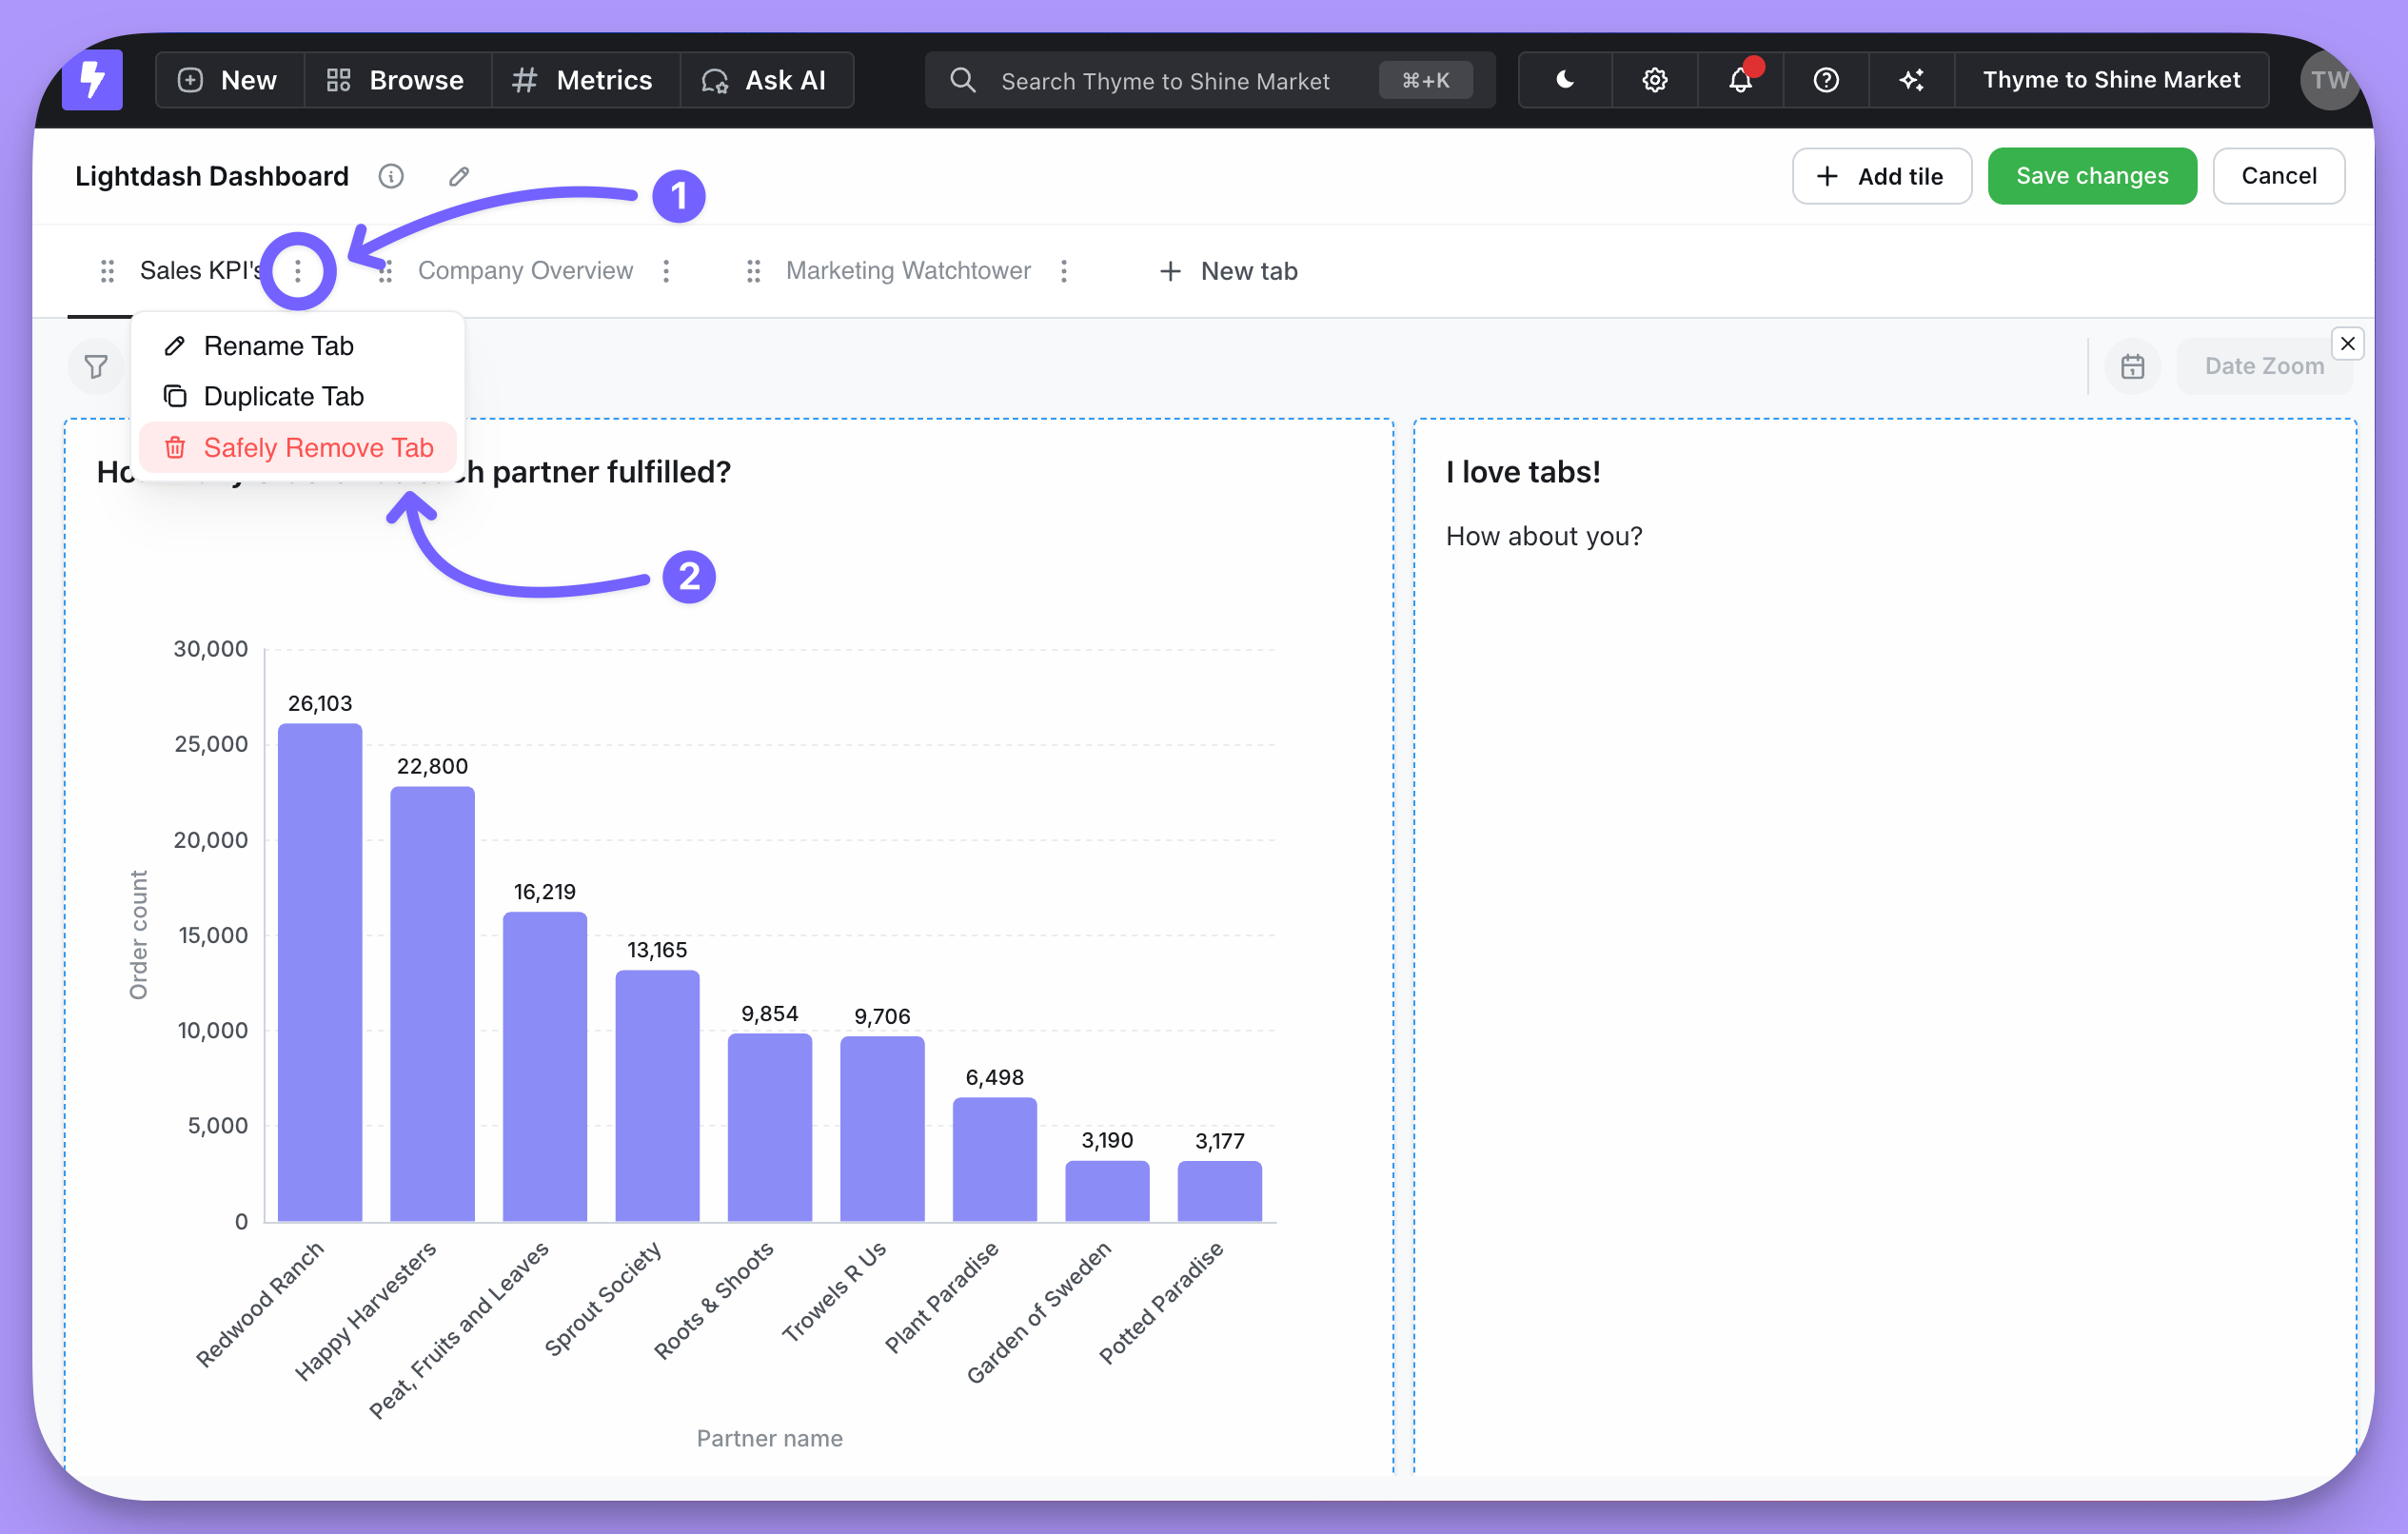
Sharing tabs
Tab content shares just like a regular dashboard. A shareable link navigates straight to the tab that was active when you created it.Embedding dashboards with tabs
When you embed a dashboard that has tabs, every tab is appended into a single dashboard, so the embed shows the content of all tabs at once.Hide tile headers
Hiding a tile’s header gives a cleaner look and more space to the chart content.- Enter edit mode by clicking Edit dashboard.
- Click the tile you want to modify and select Edit tile content.
- Click the eye icon next to the tile title to hide it.