Embedding is available to all Lightdash Cloud users and Enterprise On-Prem customers. Get in touch to have this feature enabled in your account.
Overview
Dashboard embedding allows you to display full Lightdash dashboards in your application with multiple visualizations, filters, and interactive features. This is ideal when you want to provide comprehensive analytics views to your users.When to use dashboard embedding
- Executive dashboards: Display multiple KPIs and metrics in admin panels
- Customer-facing analytics: Provide analytics portals for SaaS customers
- Embedded reporting: Integrate comprehensive data views into your workflows
- Multi-chart views: Show related visualizations together with shared filters
Key features
- Multiple chart tiles, including saved charts and SQL Runner charts
- Markdown, loom, and heading tiles
- Dashboard-level filters (interactive if enabled)
- Multiple tabs for organizing content
- Parameters support
- Export options (CSV, images, PDF)
- Date zoom for time-series charts
- “Explore from here” to navigate to query builder
- View underlying data for any visualization
SQL Runner chart tiles are authorized through dashboard-tile membership, so they work with existing embed JWTs — you do not need to regenerate tokens or change embed URLs to render them. SQL charts remain embeddable only as part of a dashboard; chart-scoped JWTs (
type: 'chart') cannot embed a SQL chart on its own.Setup
Configure allowed dashboards
Only dashboards explicitly added to the “allowed dashboards” list can be embedded. Navigate to Settings → Embed and add your dashboard.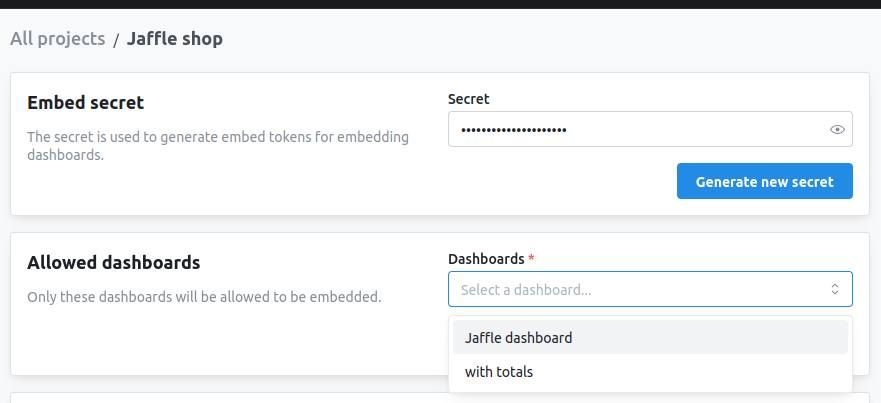
Configuring interactivity
Control what users can do with your embedded dashboard by configuring interactivity options. These options work for both iframe and React SDK embedding methods and are set in the JWT. While the SDK options are configured via React props, iframe options are configured in the admin UI where you setup the embedding: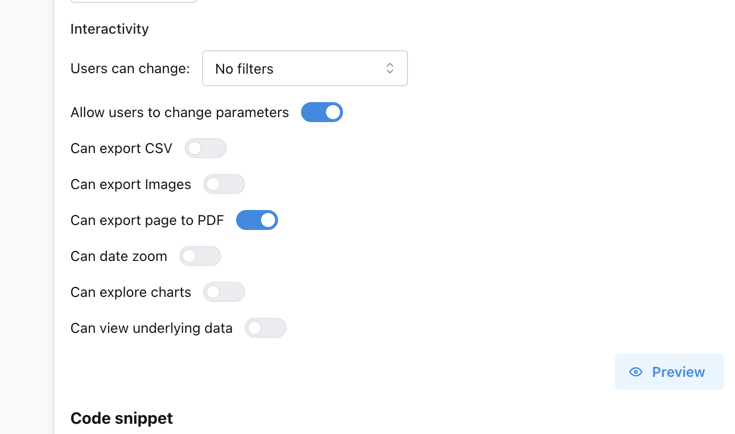
Dashboard filters
Dashboard filters allow users to slice and filter data across all charts in the dashboard. You can control whether users can interact with these filters, which filters they can modify, and whether the filter UI is visible. Configure in JWT:'all'- All dashboard filters are interactive and visible'some'- Only specified filters are interactive (useallowedFiltersarray)'none'- Filters are applied but not visible or editable
canAddFilters: true to render an Add filter button in the embedded filter bar. Viewers can add temporary filters over any filterable field in the dashboard’s explores — the filters live in session state (and the temp-filter deep-link parameter) and are not saved to the dashboard. Opening a fresh embed URL starts with a clean filter bar.
enabled: 'all', or enabled: 'some' with a non-empty allowedFilters array. JWTs without canAddFilters behave exactly as before (button hidden), so this change is backwards compatible.
Metric filters in the picker still require the
metric-dashboard-filters feature flag on your organization. Dimension filters are always available.Filter requirements in embeds. Embedded dashboards behave the same as the in-app viewer experience for required filters and requirement groups: tiles stay locked and don’t load data while any rule is unmet, and viewers see the guided setup card instead. You can style the card with the
ld-dashboard-guided-setup class.Parameters
Parameters are dynamic values that can be referenced in your queries and filters. When enabled, users can modify parameter values to change what data is displayed across the dashboard. Configure in JWT:Export options
Allow users to export data and visualizations from the embedded dashboard. You can control which export formats are available. Configure in JWT:- CSV - Download raw data from individual charts
- Images - Export charts as PNG images
- PDF - Export the entire dashboard page as a PDF document
Date zoom
Date zoom allows users to dynamically change the time granularity of time-series visualizations (e.g., view by day, week, month, quarter, year) without modifying the underlying query. When enabled, the embed renders the dashboard’s configured date zoom controls (the Default zoom plus any named controls), matching what viewers see in Lightdash. Configure in JWT:Explore from here
“Explore from here” allows users to navigate from a dashboard chart into the full query builder interface, where they can modify dimensions, metrics, filters, and create ad-hoc analyses starting from the chart’s configuration. Configure in JWT:Save charts from Explore
By default, embedded users can explore but cannot save their changes. If you want to let them save a new chart from the Explore view — or edit and build dashboards through the React SDK — add awriteActions claim to the JWT. Lightdash will perform the save on behalf of a configured actor (a service account or a specific user) and place the new content into a fixed destination space.
Configure in JWT:
Newly saved charts are not added to the embed allowlist, so they won’t be re-embeddable unless you add them explicitly.
View underlying data
View underlying data shows users the raw data table behind any visualization, making it easy to inspect the actual values and records that create the chart. Configure in JWT:View data apps
Data app tiles run their own metric queries, so they need to be explicitly authorized before they render in an embedded dashboard. WhencanViewDataApps is off (the default), data app tiles show a placeholder and no queries run. When it’s on, the data app loads inside the embed and uses the same user attributes and filters as the rest of the dashboard.
Configure in JWT:
Complete configuration example
iframe embedding
iframe embedding is the simplest way to embed dashboards. No special libraries or dependencies required.URL structure
dashboardUuid is passed inside the JWT payload as content.dashboardUuid (see Generate JWT below). The JWT itself is passed in the URL hash fragment for security.
Generate JWT
Embed in HTML
Theming
You can customize the appearance of iframe embeds using optional URL query parameters. These are added before the hash fragment in the embed URL.
Example with dark theme and custom background:
React SDK
The React SDK provides seamless integration with additional features like programmatic filters, callbacks, and styling.See the React SDK reference for installation, setup, and complete configuration options.
Basic usage
Component props
Advanced example with filters
Advanced features
User metadata for analytics
Pass user information to track who’s viewing your embedded dashboards.Custom styling (SDK only)
Apply custom styling to match your application’s design.styles prop doesn’t cover, embedded dashboards expose stable CSS classnames (e.g. ld-dashboard-header) you can target from your own stylesheet. See CSS class overrides.
Localization (SDK only)
Translate embedded dashboards using thecontentOverrides prop. See React SDK localization for details.
Row-level security with user attributes
Filter data based on the viewing user’s properties. See the user attributes reference for complete details.Next steps
Embedding charts
Embed individual charts for focused displays
User attributes & row-level security
Show different data to different users
iframe embedding reference
Complete iframe URL patterns and HTML embedding
Embedding API reference
Complete JWT structure documentation