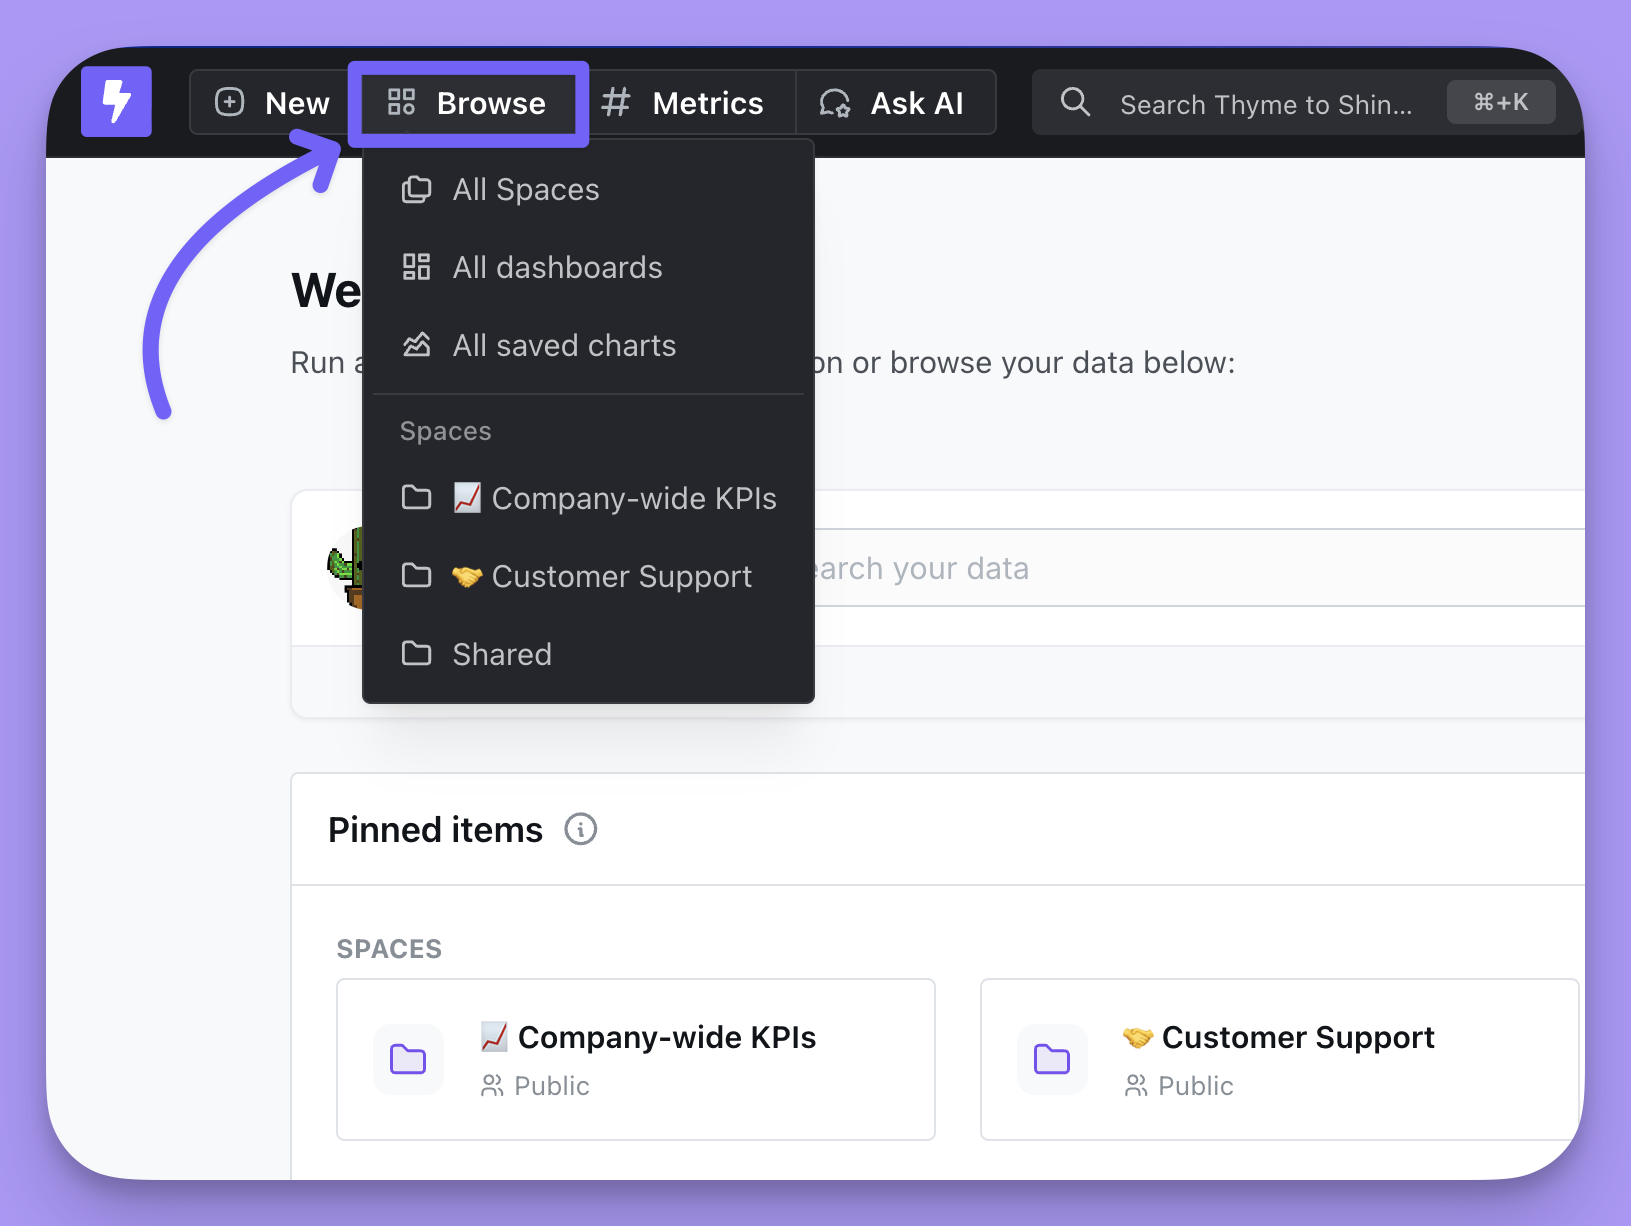
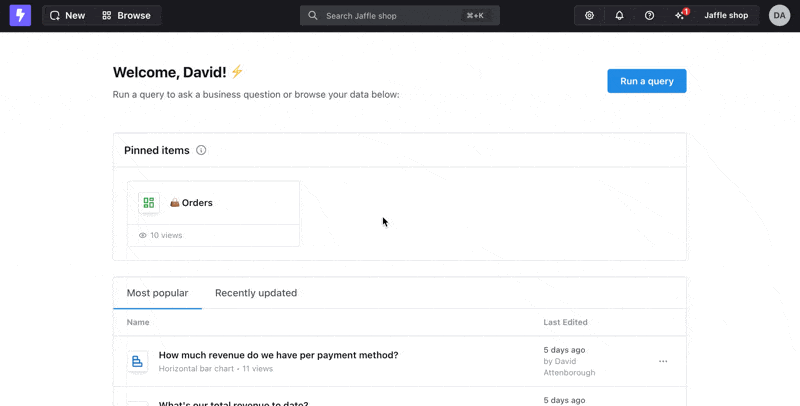
Browsing saved charts and dashboards
The easiest way to get started in Lightdash is to check out the saved charts and dashboards that your team’s already made. You can see a list of some of this content on your homepage as soon as you land in Lightdash.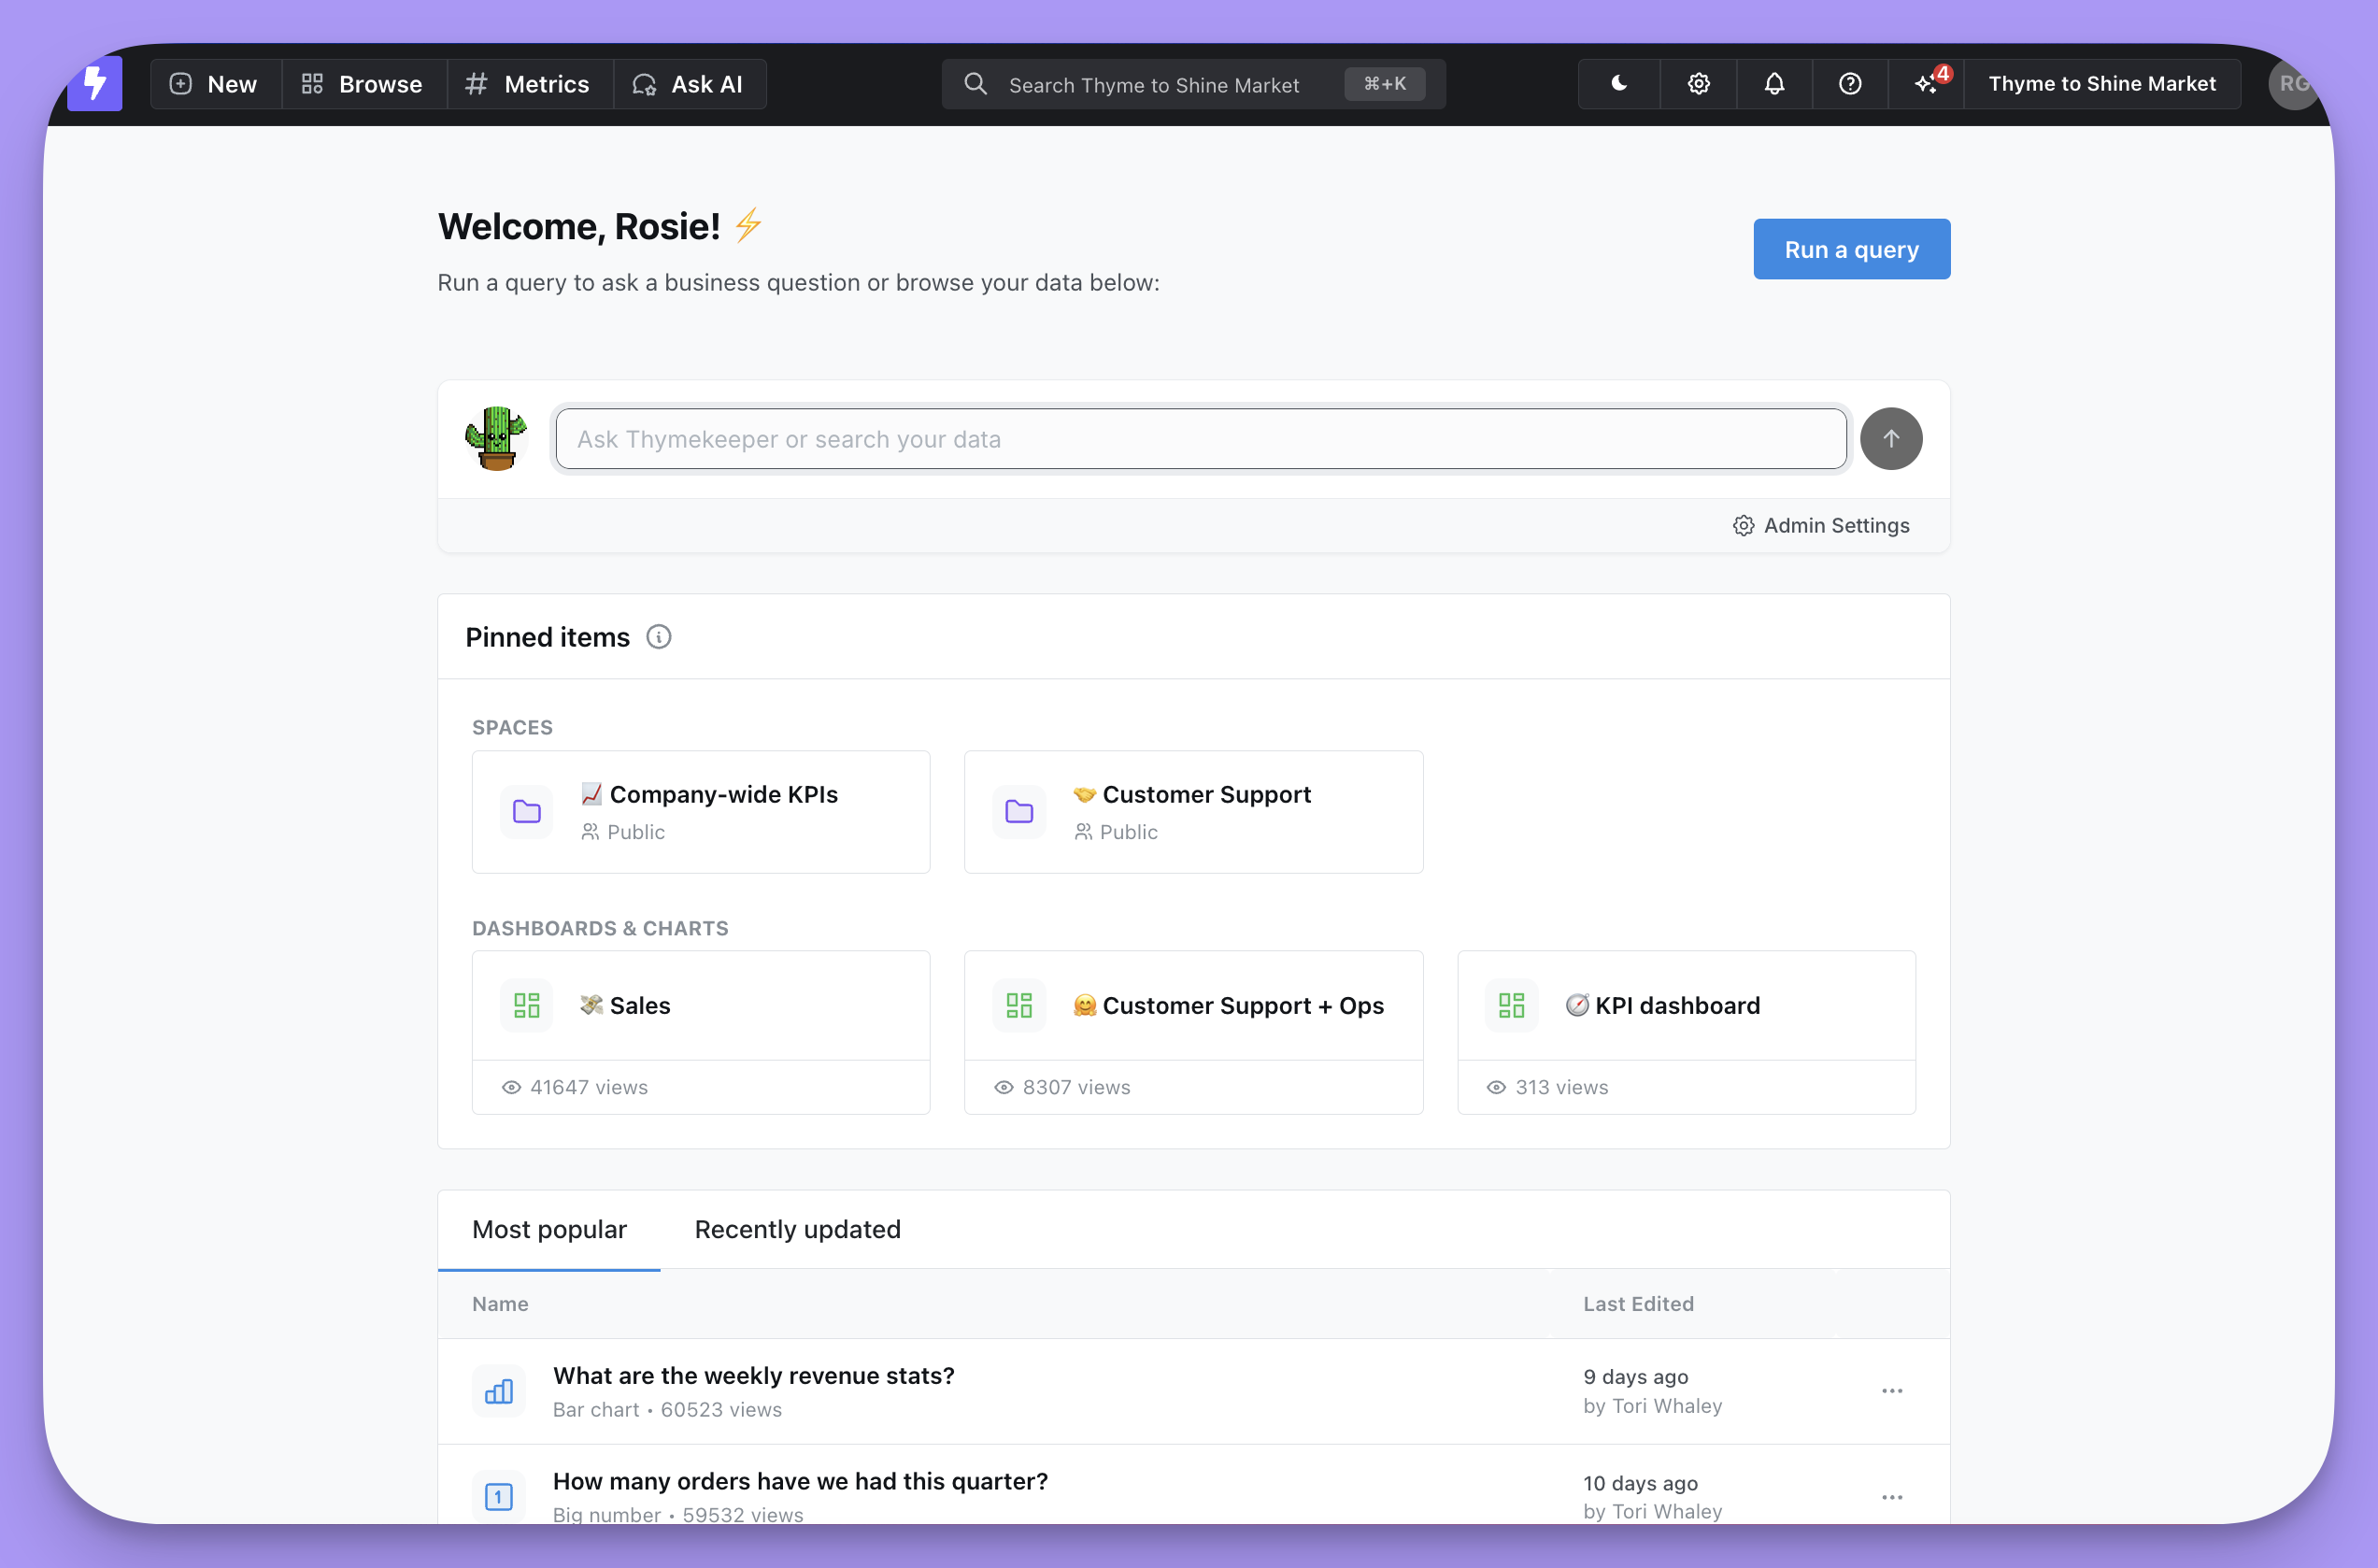
Browse in your navbar.
Using the search bar
If you already know what you’re looking for, you can use the search bar to search through all the content in your Lightdash project. Just click on the search bar at the top of your screen, or pressCmd + K (Mac) or Ctrl + K (Windows, Linux) to open the search bar.
Search filters
Enhance your search experience by applying filters directly in the search bar. Specify what you’re looking for by content type, and narrow down results by dates, either by choosing a range (e.g., “from: January 10, 2024, to: January 20, 2024”) or a single date (“from: January 10, 2024”). You can also filter results by the creator of the content, making it easier to find items created by specific team members.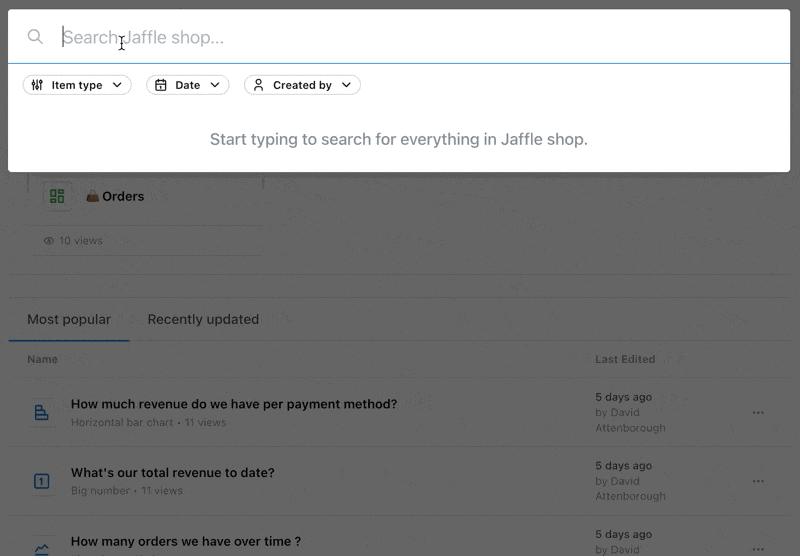
Search groups
Search results are organized into groups, making navigation through the findings simpler. Items within each group are sorted by their relevance to your query, ensuring that the most pertinent results are always easy to find. This organization aids in quickly identifying the exact type of content you’re searching for, whether it be a chart, dashboard, or any other entity within your project.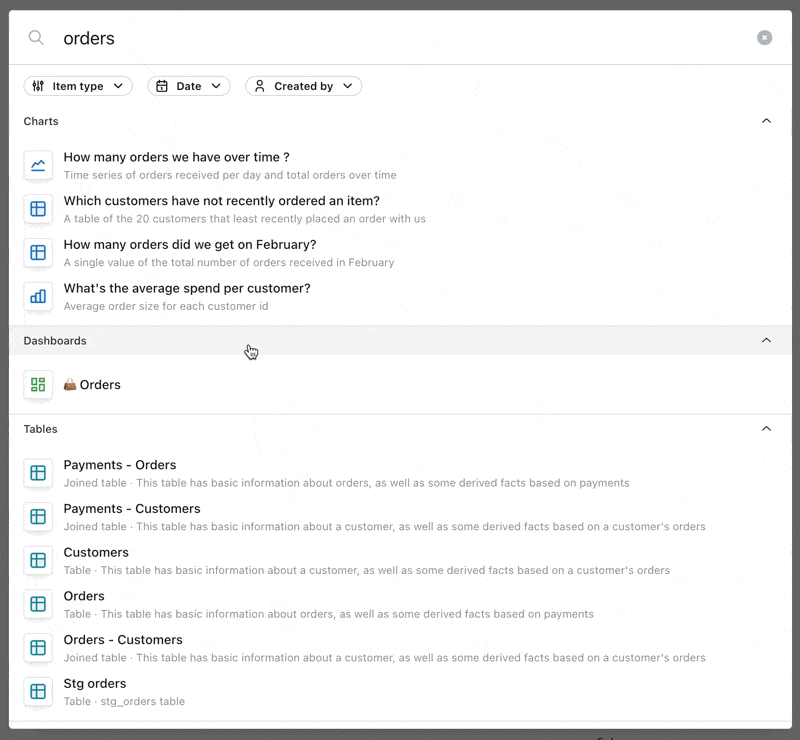
Exploring data in a chart
View underlying data
You can click on any point on a chart or any cell in a results table and view the records which make up that data point. For example, I can click on the page views bar in my chart or the value in the results table cell and I’d see all of the rows in the underlying table that make up the 19,120 page views count. I can then export this as a CSV or explore from this underlying data.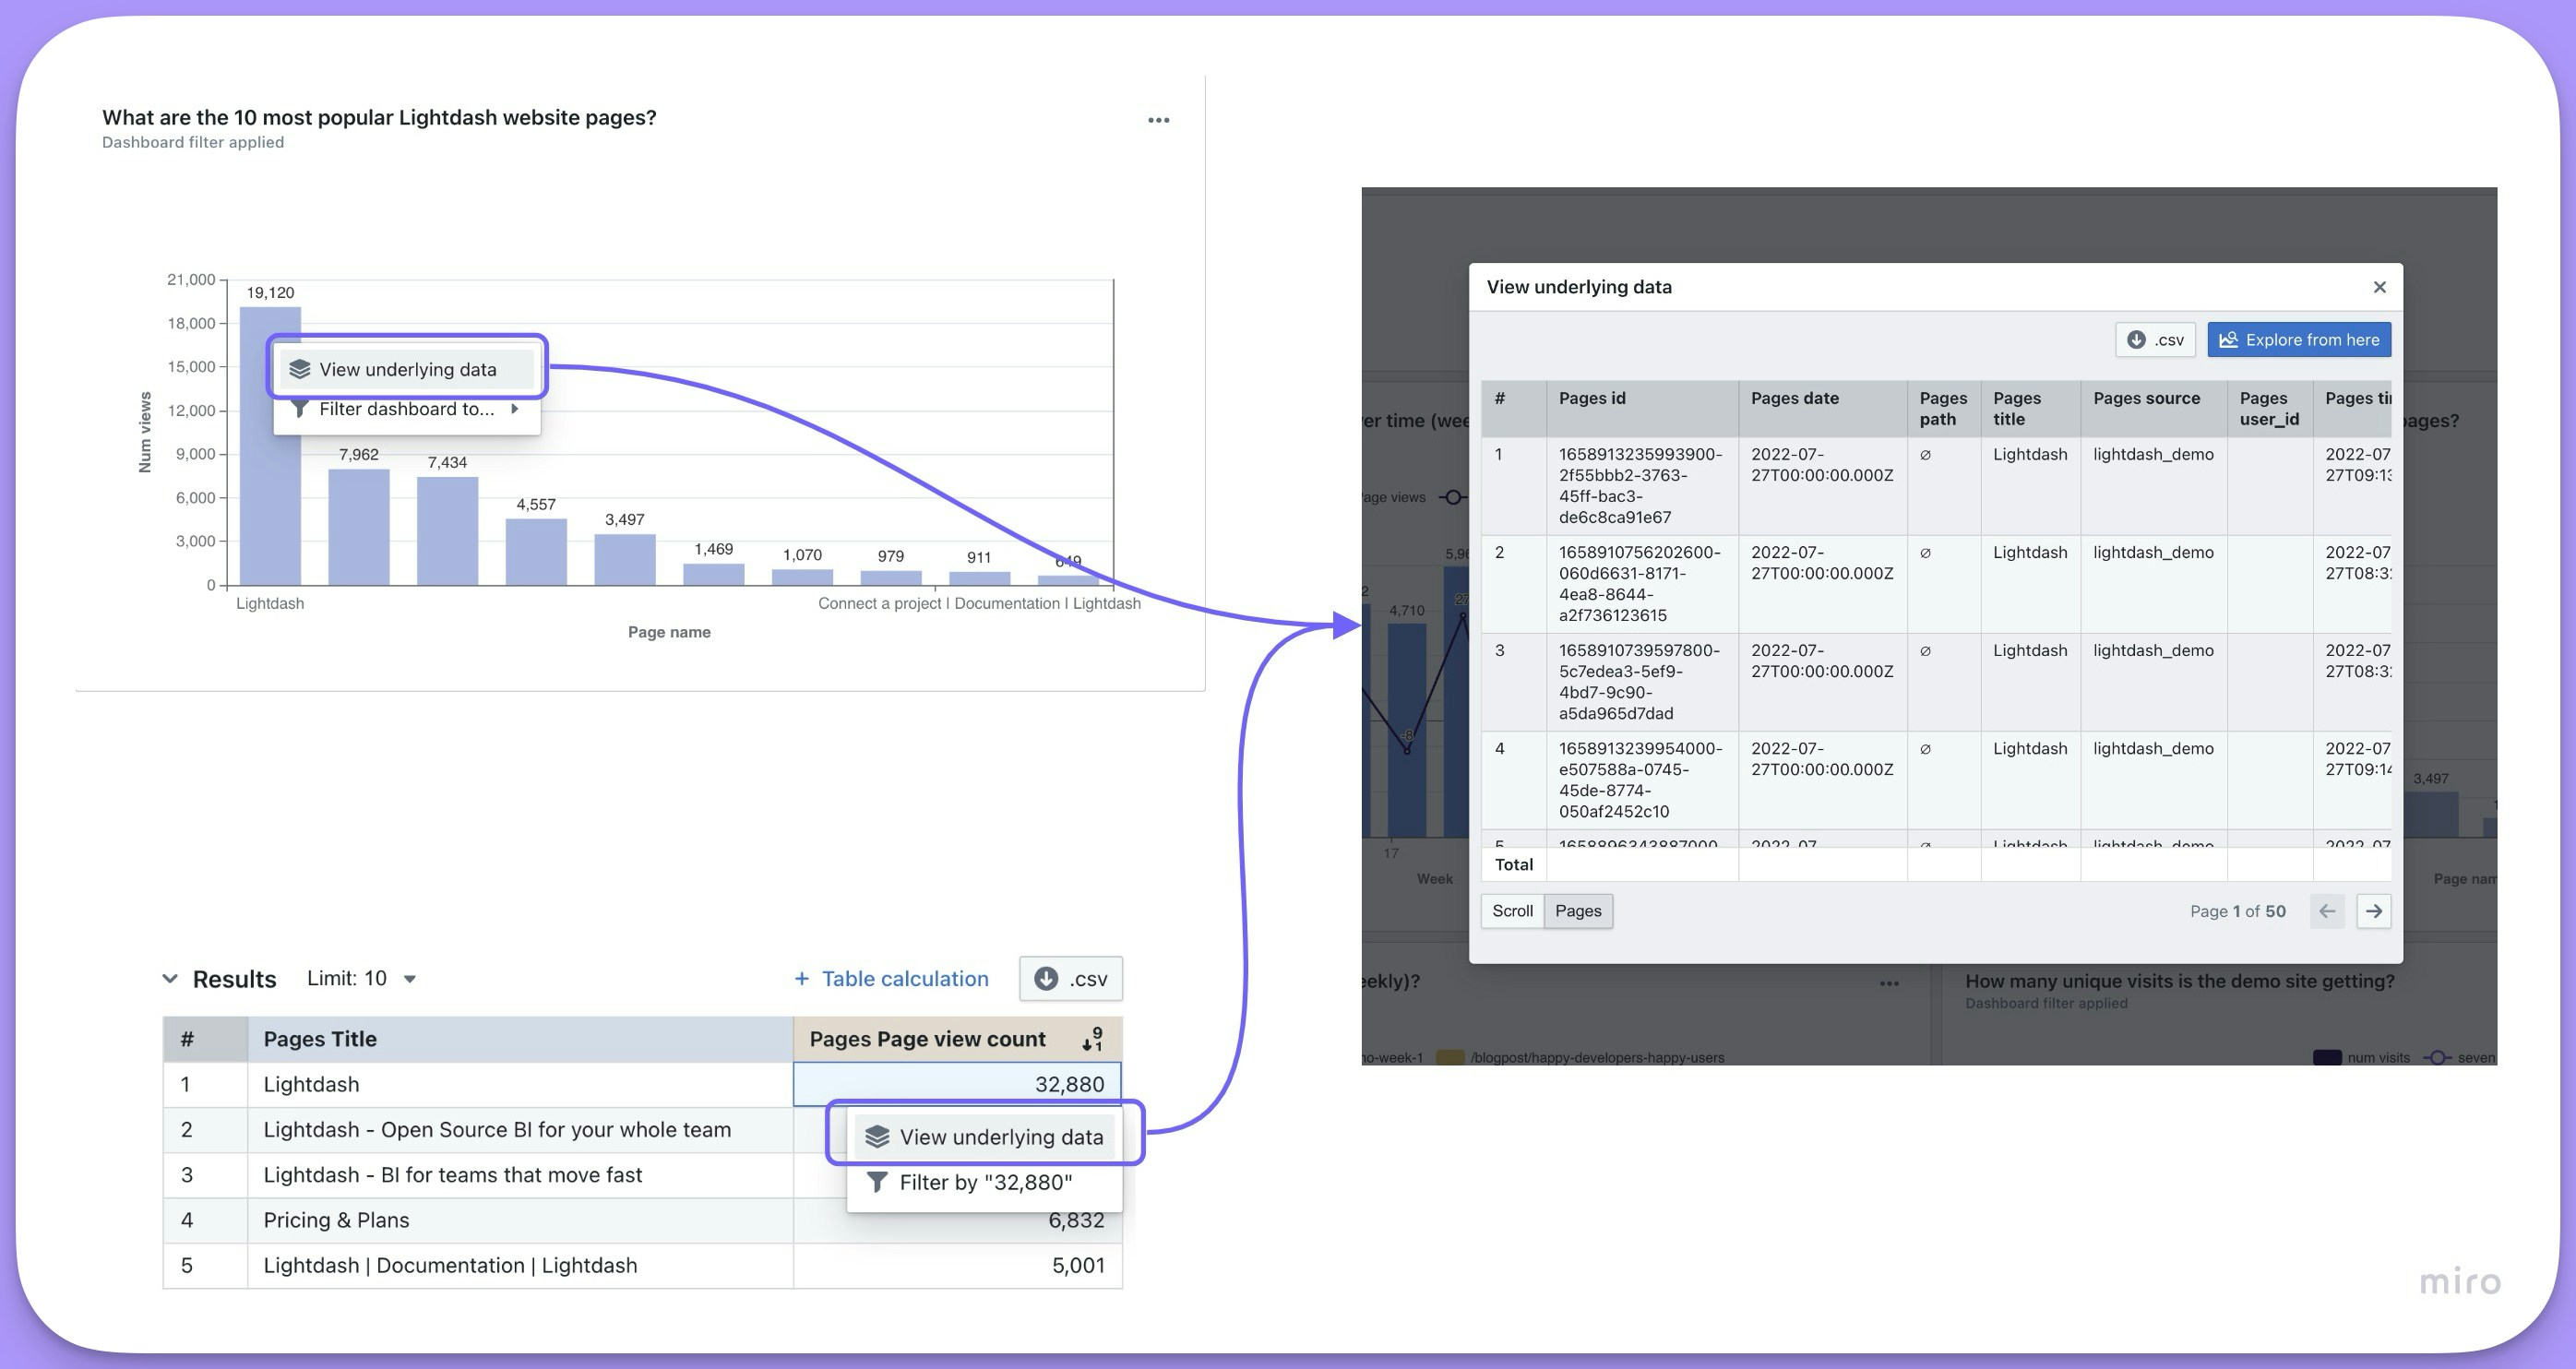
Specify fields shown in view underlying data
By default, we show all of the dimensions from the Table. If you have fields from a joined table included in your results table, then we’ll also show you all of the fields from the joined Table.
If you don’t want all of the fields from your Table shown, then you can specify which fields you want users to see when they click on show underlying data for a field.
Check out the metric reference docs to see how to do this in your Table’s .yml file.
By default, when you click Explore from here from the view underlying data table, you’re brought to an Explore view with no fields selected. If you specify fields in show underlying data, then these fields will be automatically added to the results table, so users won’t Explore from here into an empty results table.
Drill into a metric
You can drill into a metric in your chart or results table to better understand a point in your chart. Selectingdrill by lets you group your metric by a dimension, like the total revenue segmented by (or grouped by) product type. Note that drill by only works for metrics, not for dimensions or table calculations.
Here’s an example of how to use drill into
I have a chart with the total revenue per partner (a metric) over time. It looks like there was a drop in June, so I want to drill into that data point and see where the profit decrease is coming from… To do this, I click on the data point in my chart, then clickdrill into in the action menu:
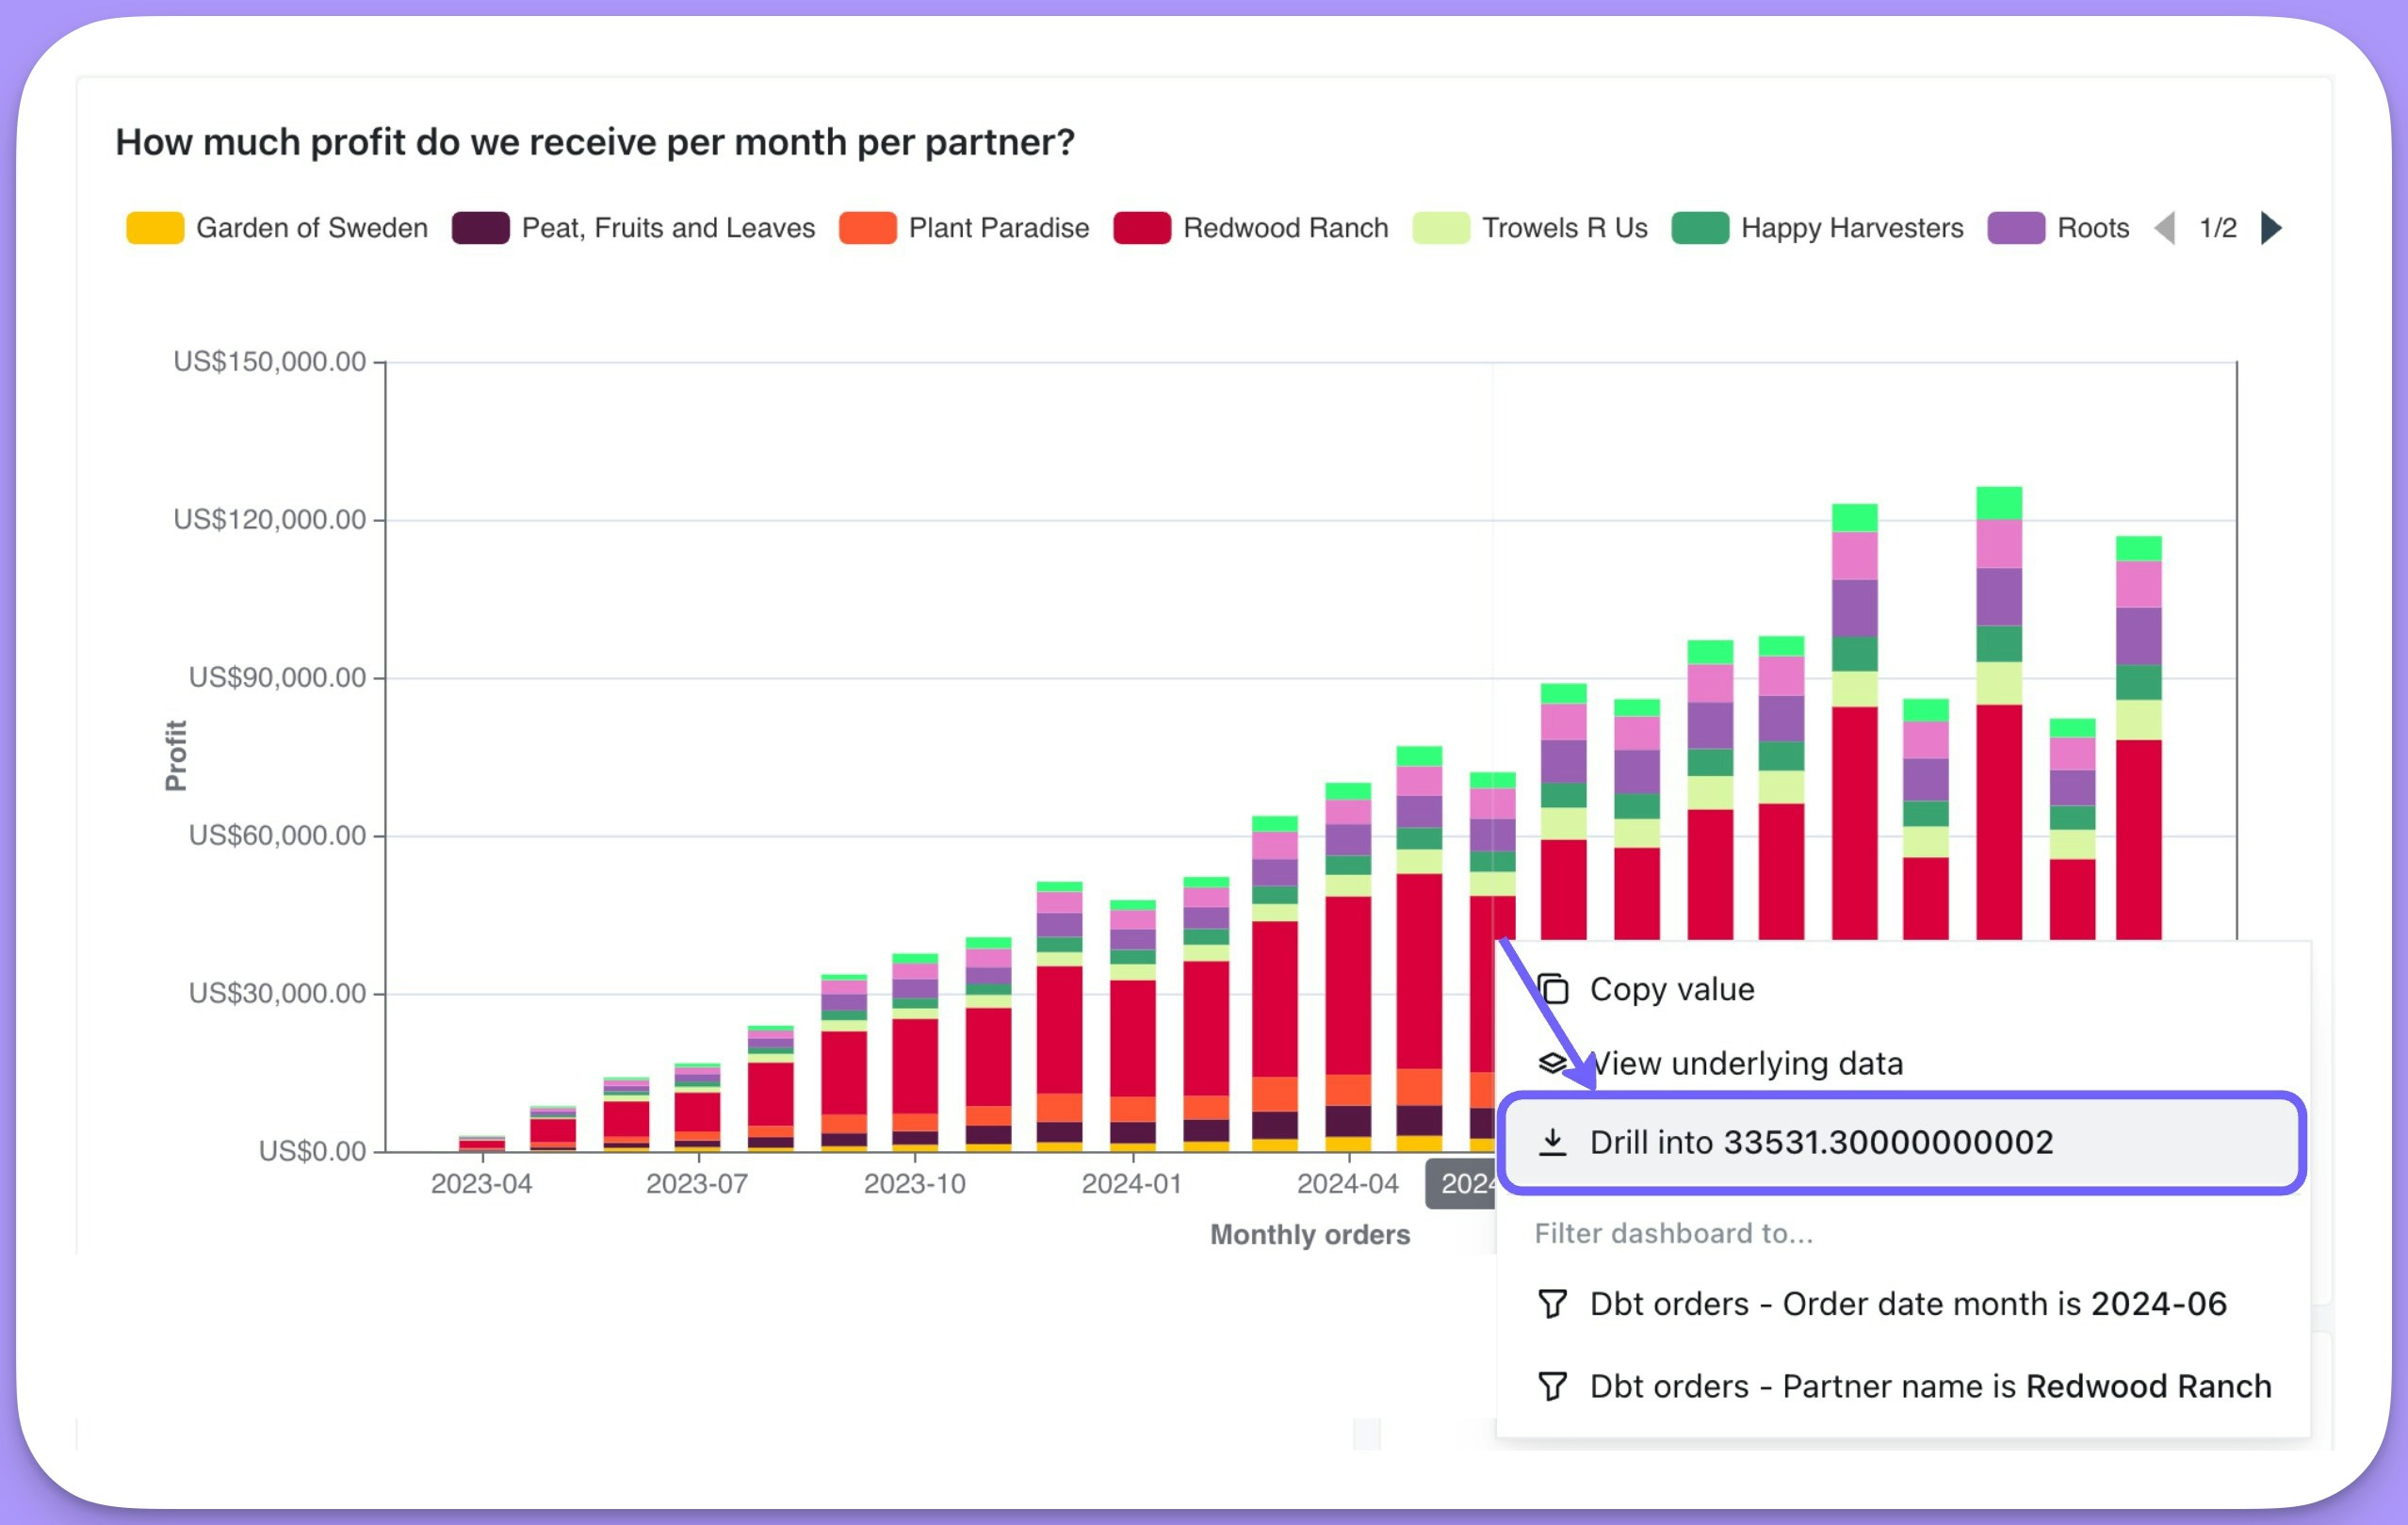
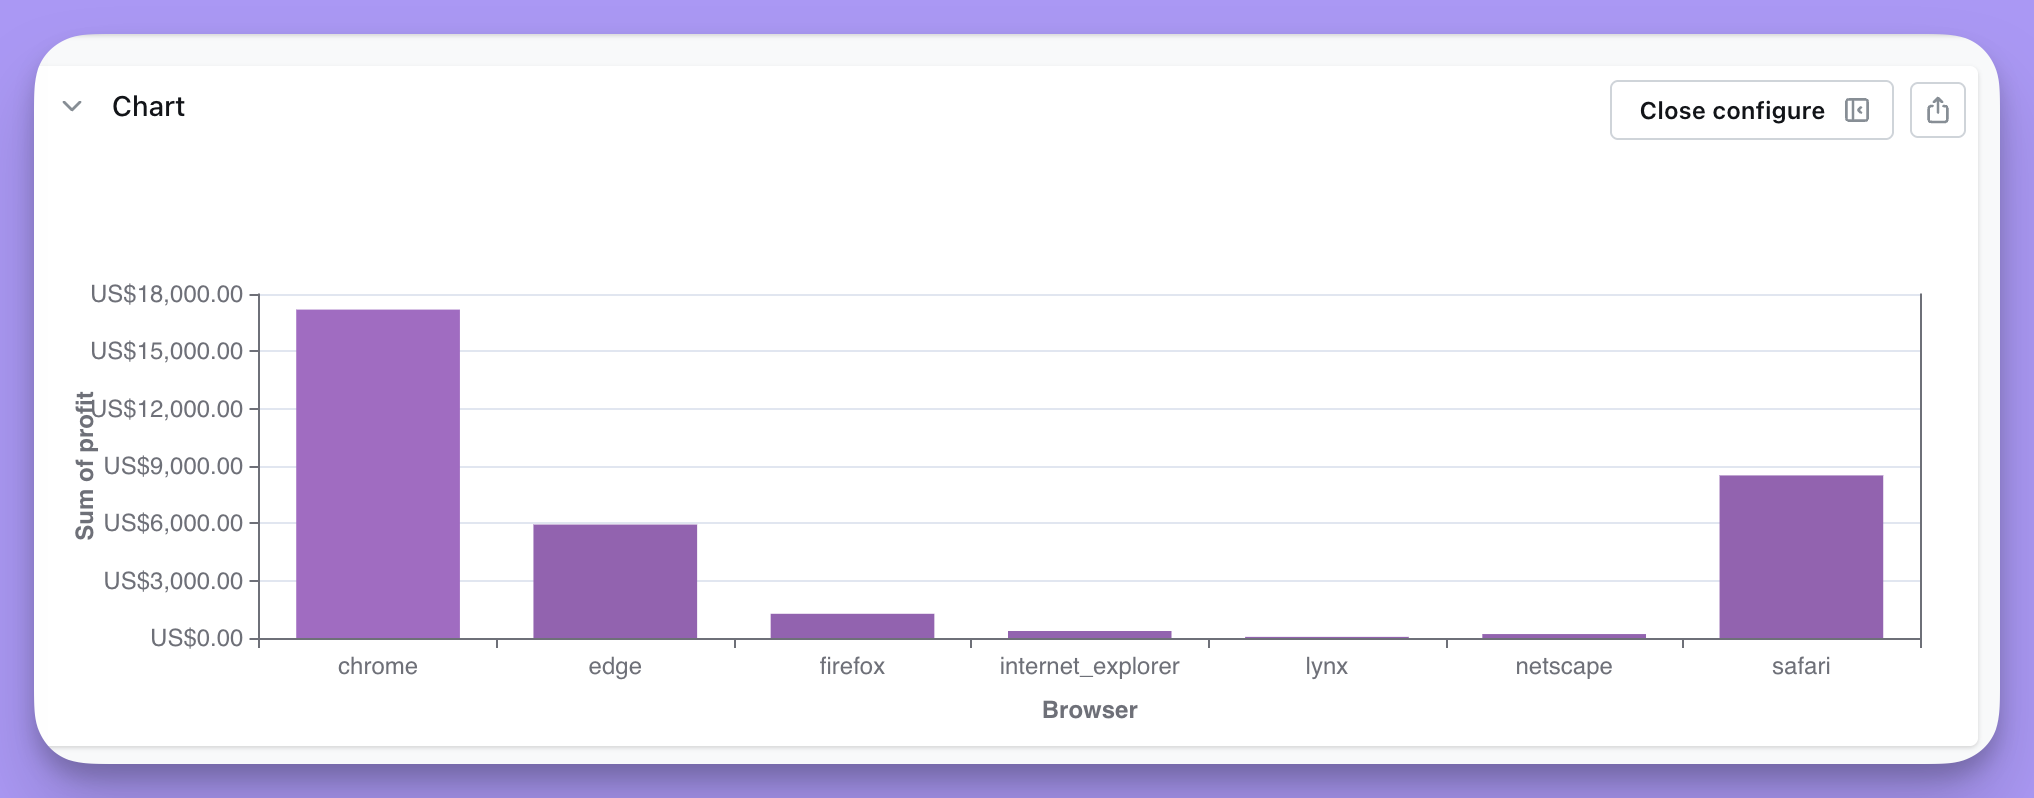
browser so I can figure out if there’s a decrease in traffic from different browsers.
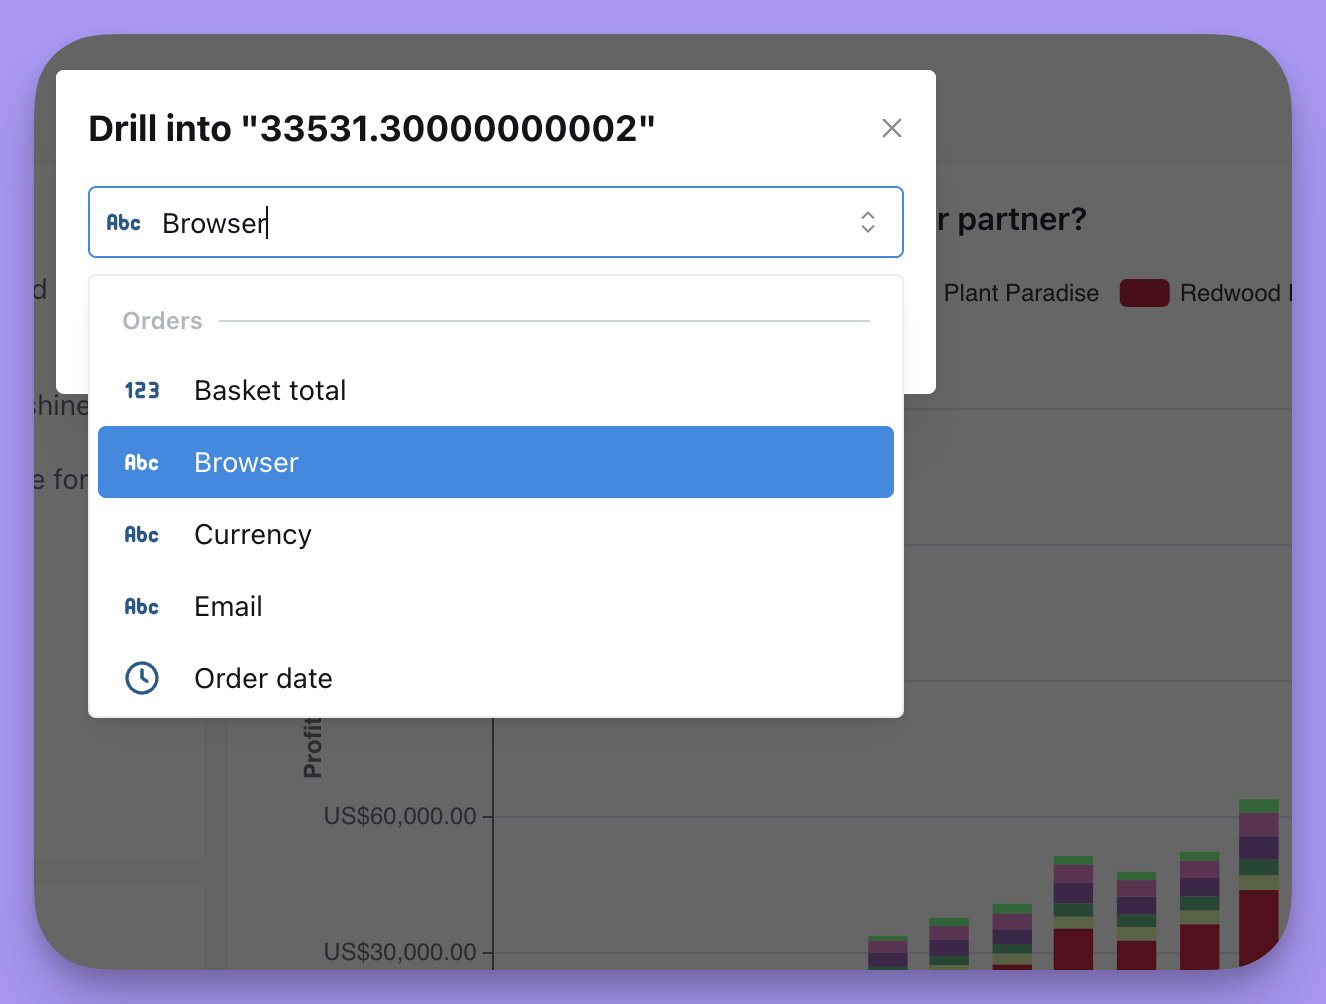
open in new tab and see a chart with my metric, grouped by Browser. Now I can uncover where this decrease in profit was coming from.
Exploring data in a dashboard
Dashboards allow you to arrange multiple charts that are related to each other into a single view. You can interact with dashboards in your project in a few different ways. Learn more about it here.Explore from existing charts
One of the best ways of exploring data is using saved charts and charts in dashboards as the starting point to your data exploration. You can do this in Lightdash using theExplore from here button.
Explore from here gives you a copy of the same chart you can play around with. Any changes you make here will not affect the original chart - so you can Explore away without any worry of breaking things!
If you’ve never used the Explore View, then checkout this tutorial on using the Explore View in Lightdash.
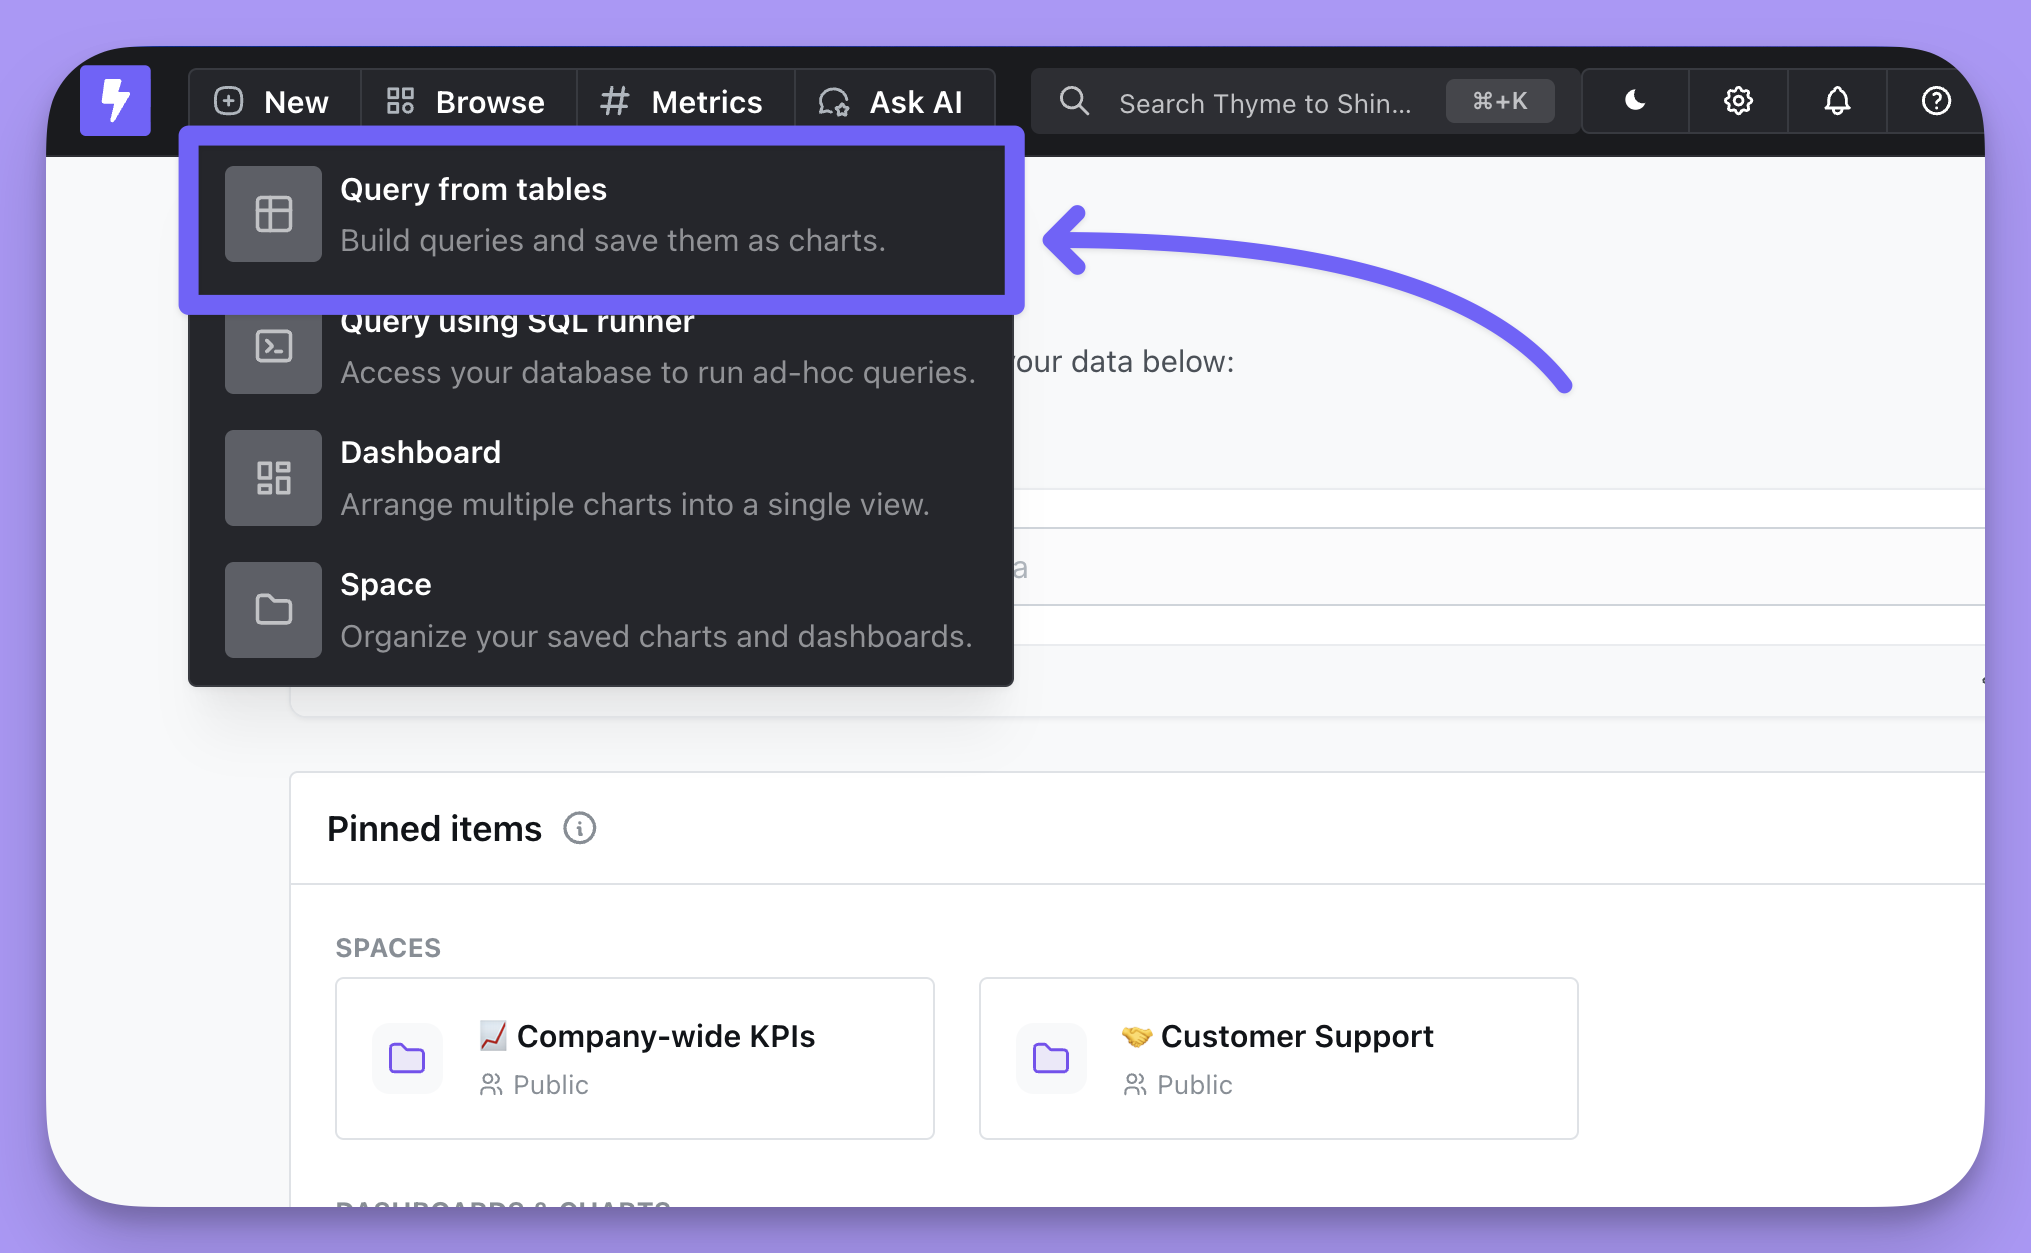
Query from tables
If you can’t find any relevant saved charts or dashboards that answer your question, you can build a query yourself from scratch. To start a new query, click on[+] New —> Query from tables, then select the table that you want to query from.
Read more in this guide on querying from tables in Lightdash.