

Experimental Merge queries are available to design partners behind the
merge-queries feature flag, and the flow, limits and wording on this page may change between releases. Contact Lightdash support to enable it for your organization. What Experimental means.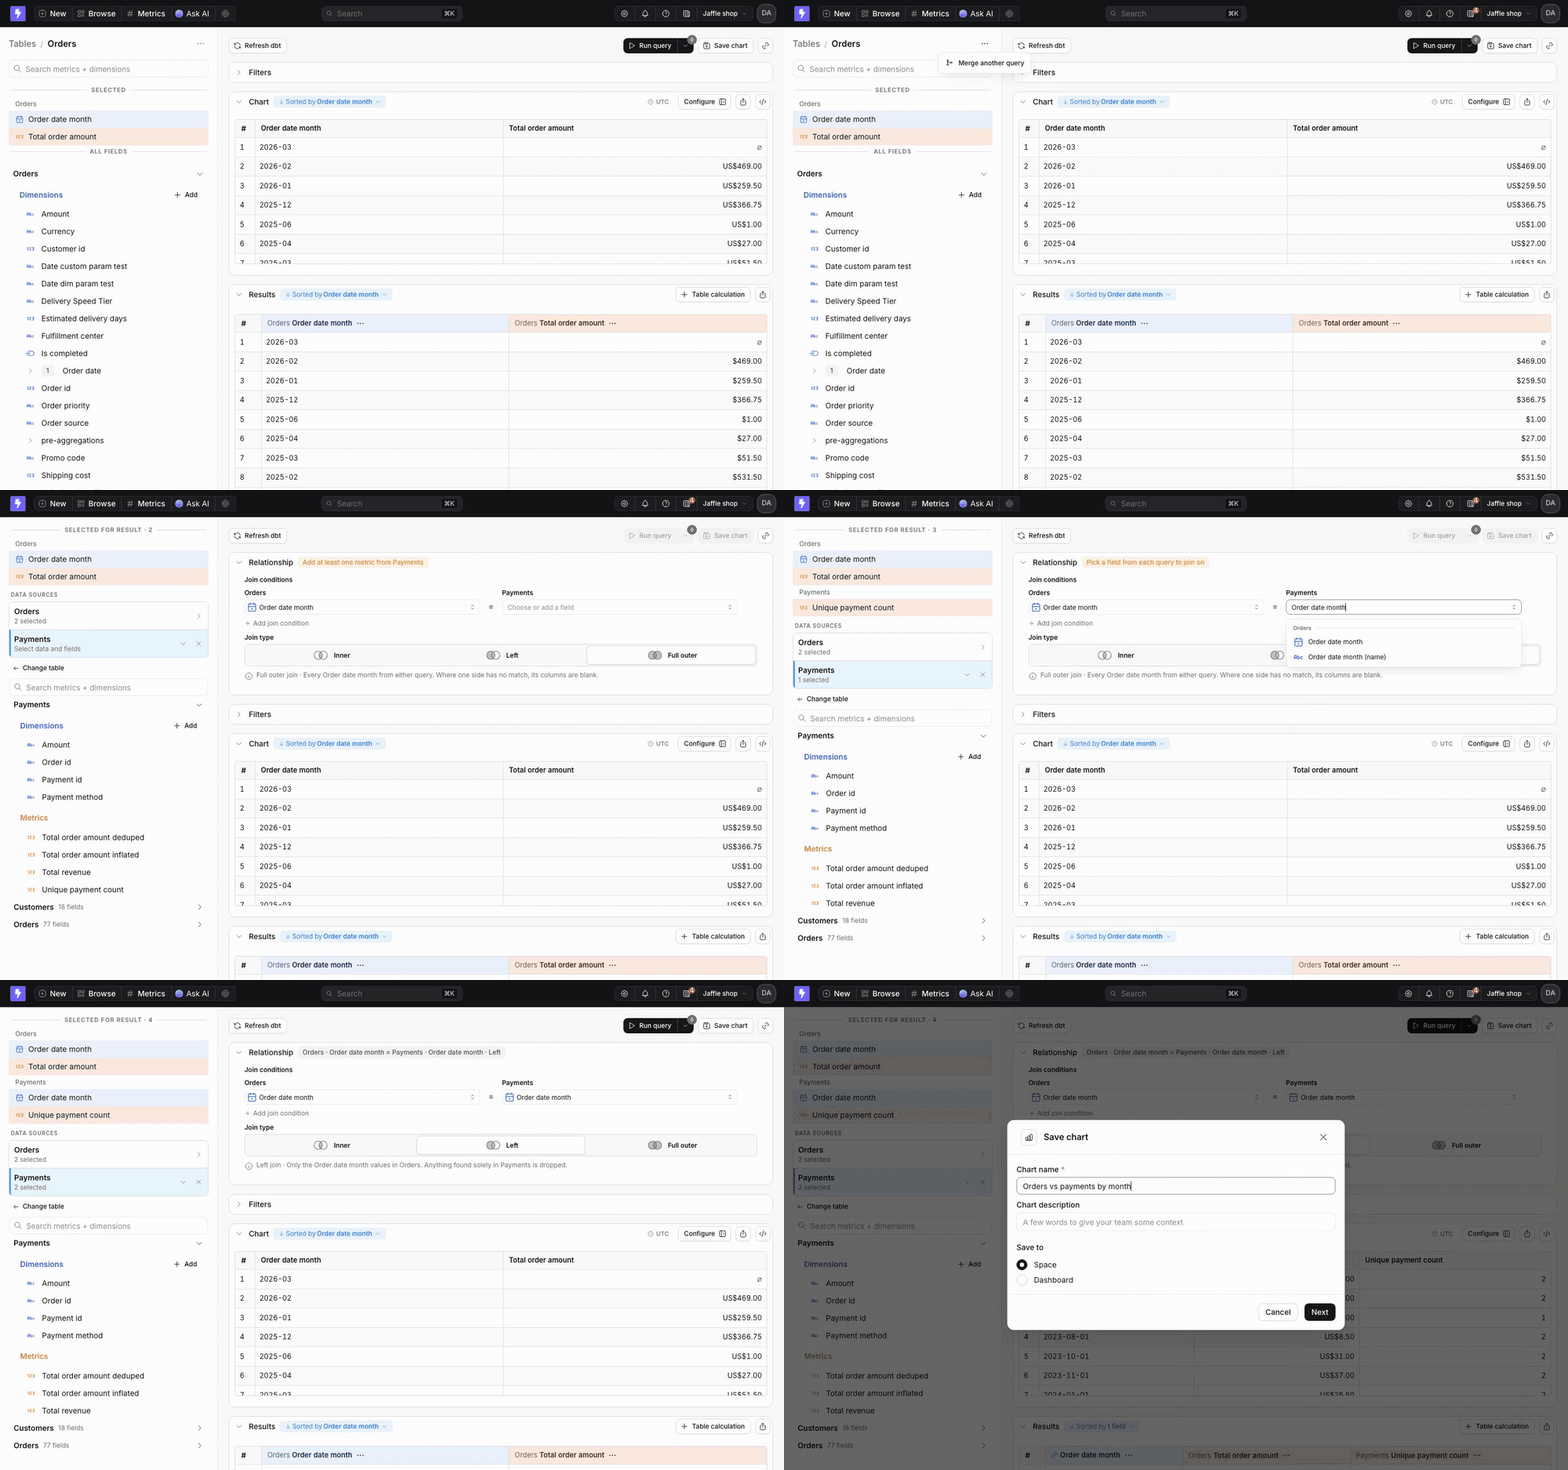
Merging Orders with Payments by month, from an explore to merged results
Before you start
Each side of a merge is a normal explore query with its own metrics, dimensions and filters. Both explores must be in the same project. You need:- A shared field. A dimension that exists on both sides with matching values, such as a product code or a month. This becomes the join key. A merge can join on more than one field.
- Matching grain. Every dimension you select from a side must be one of the join keys. This keeps each side to one row per key, so the join never multiplies rows. See how the join stays honest.
Merge two explores
1
Build the first side as usual
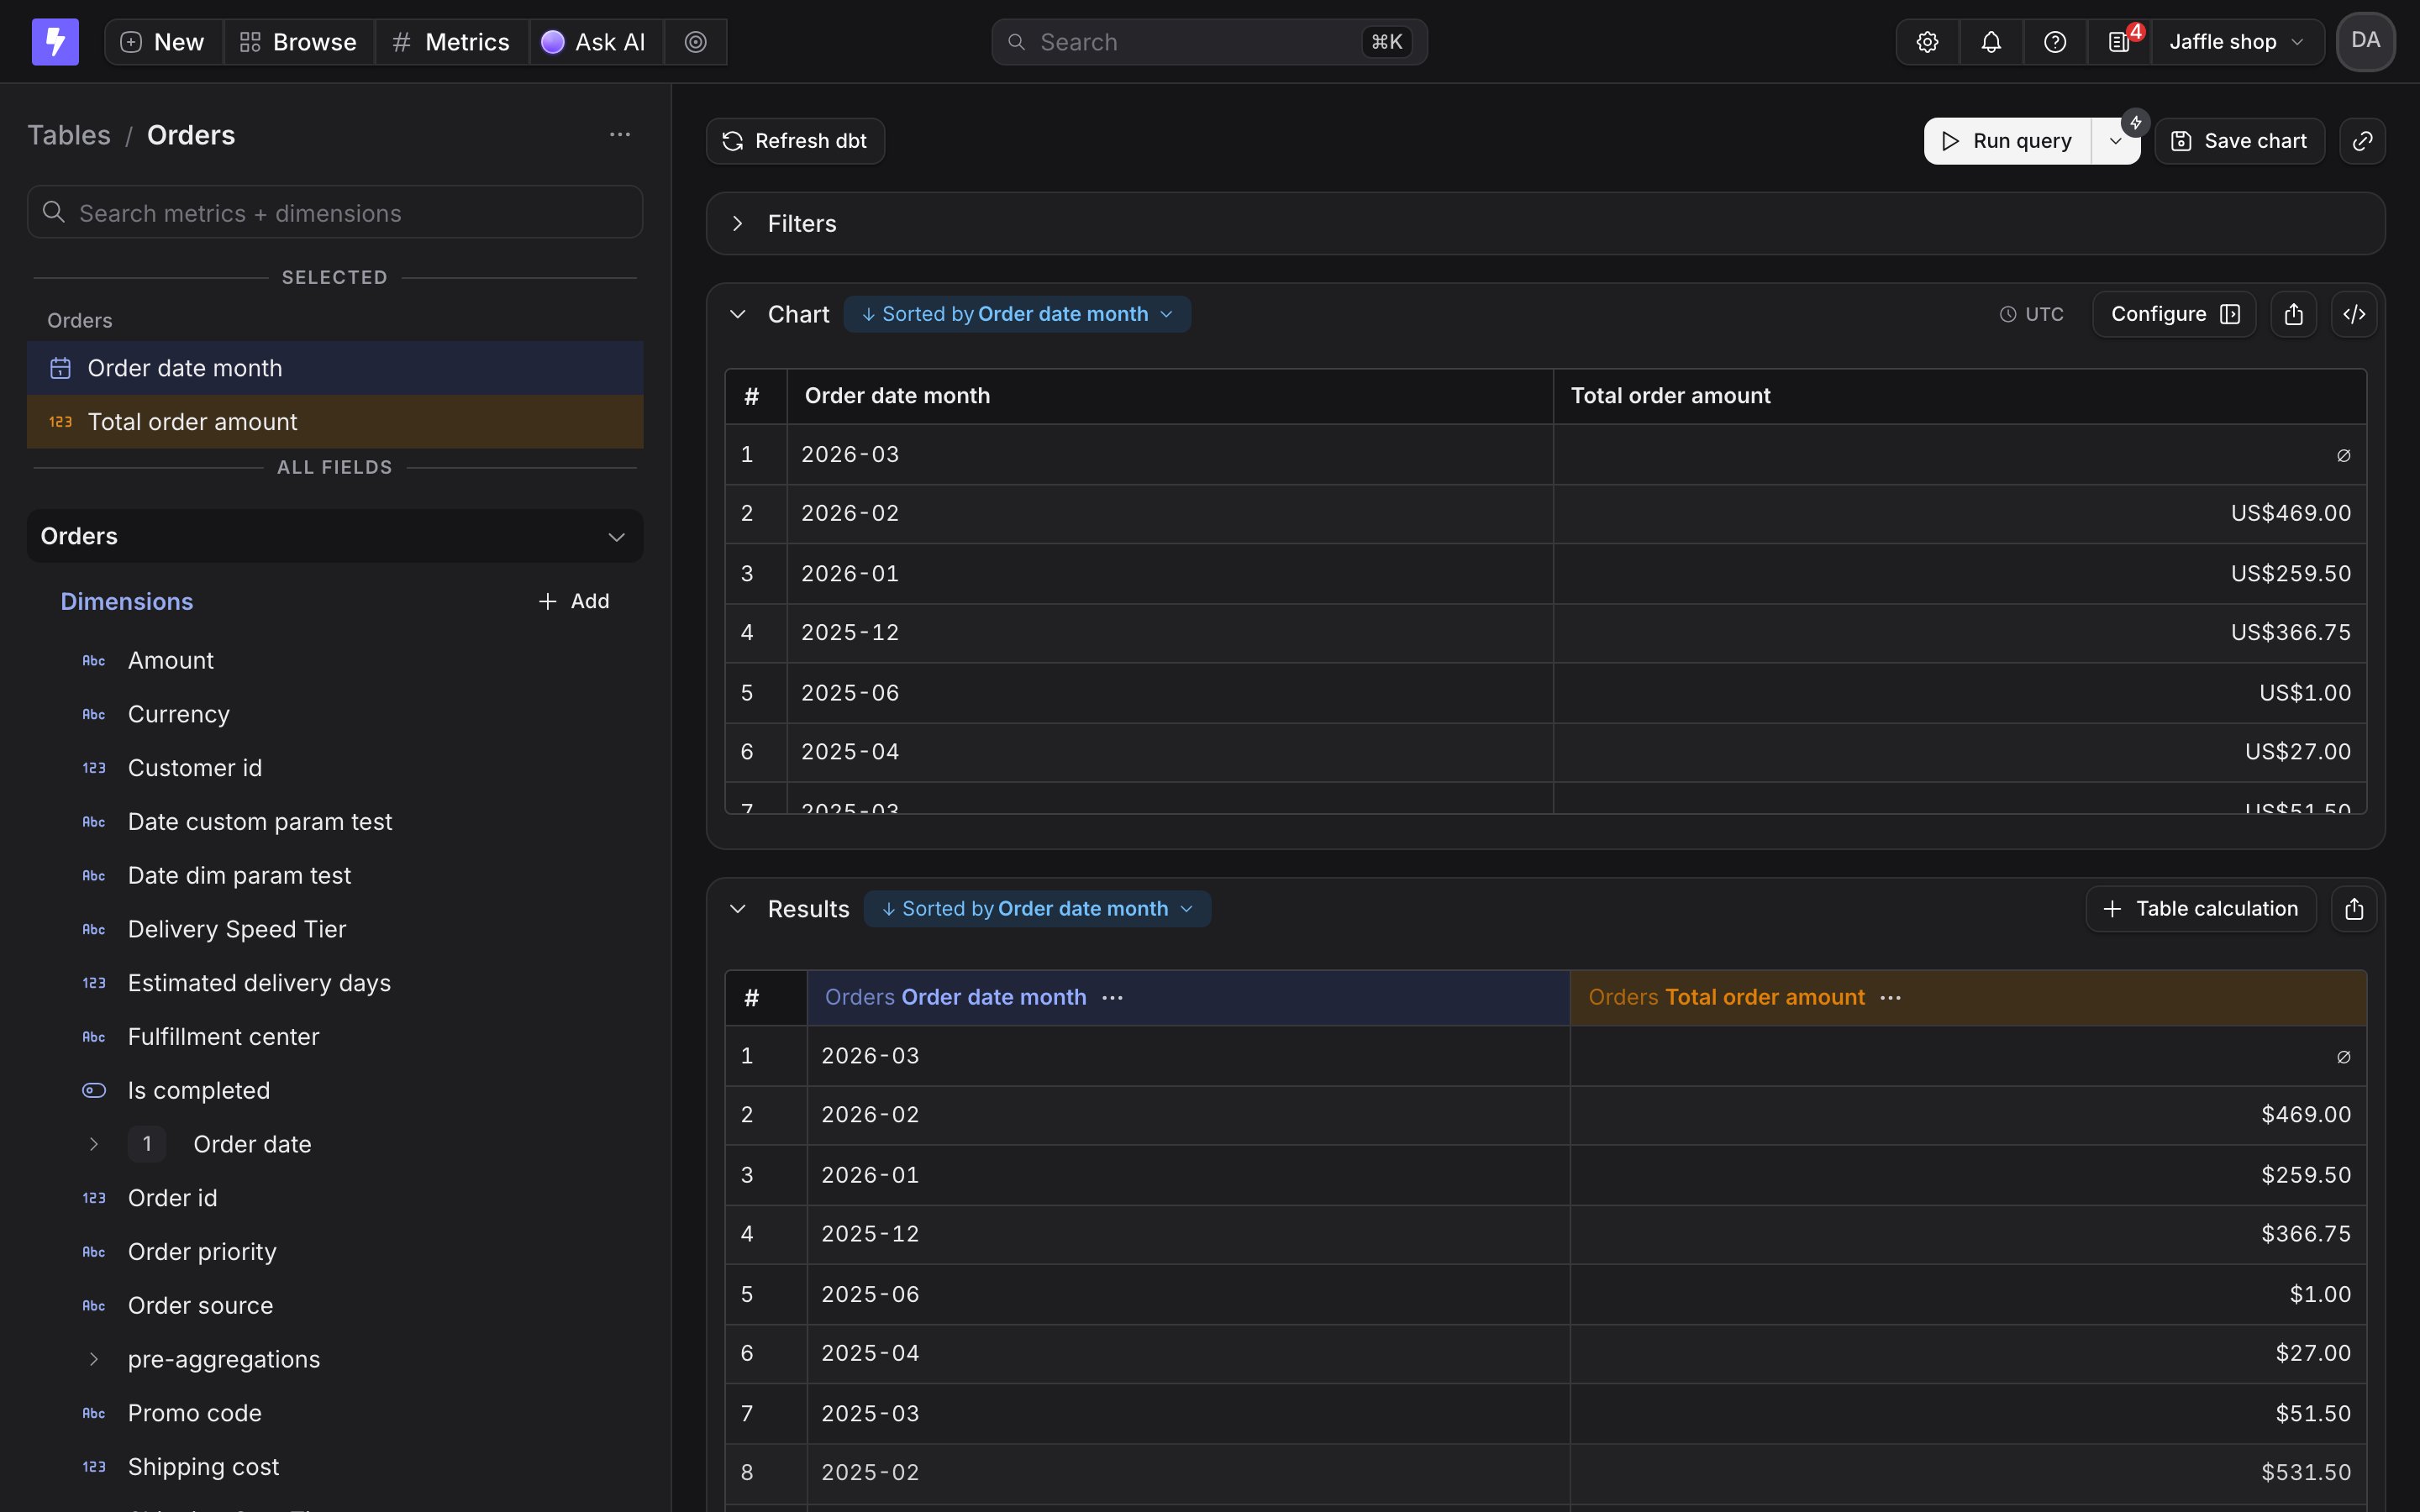
Open an explore and pick the fields you want from it. Filters you add here apply to this side only.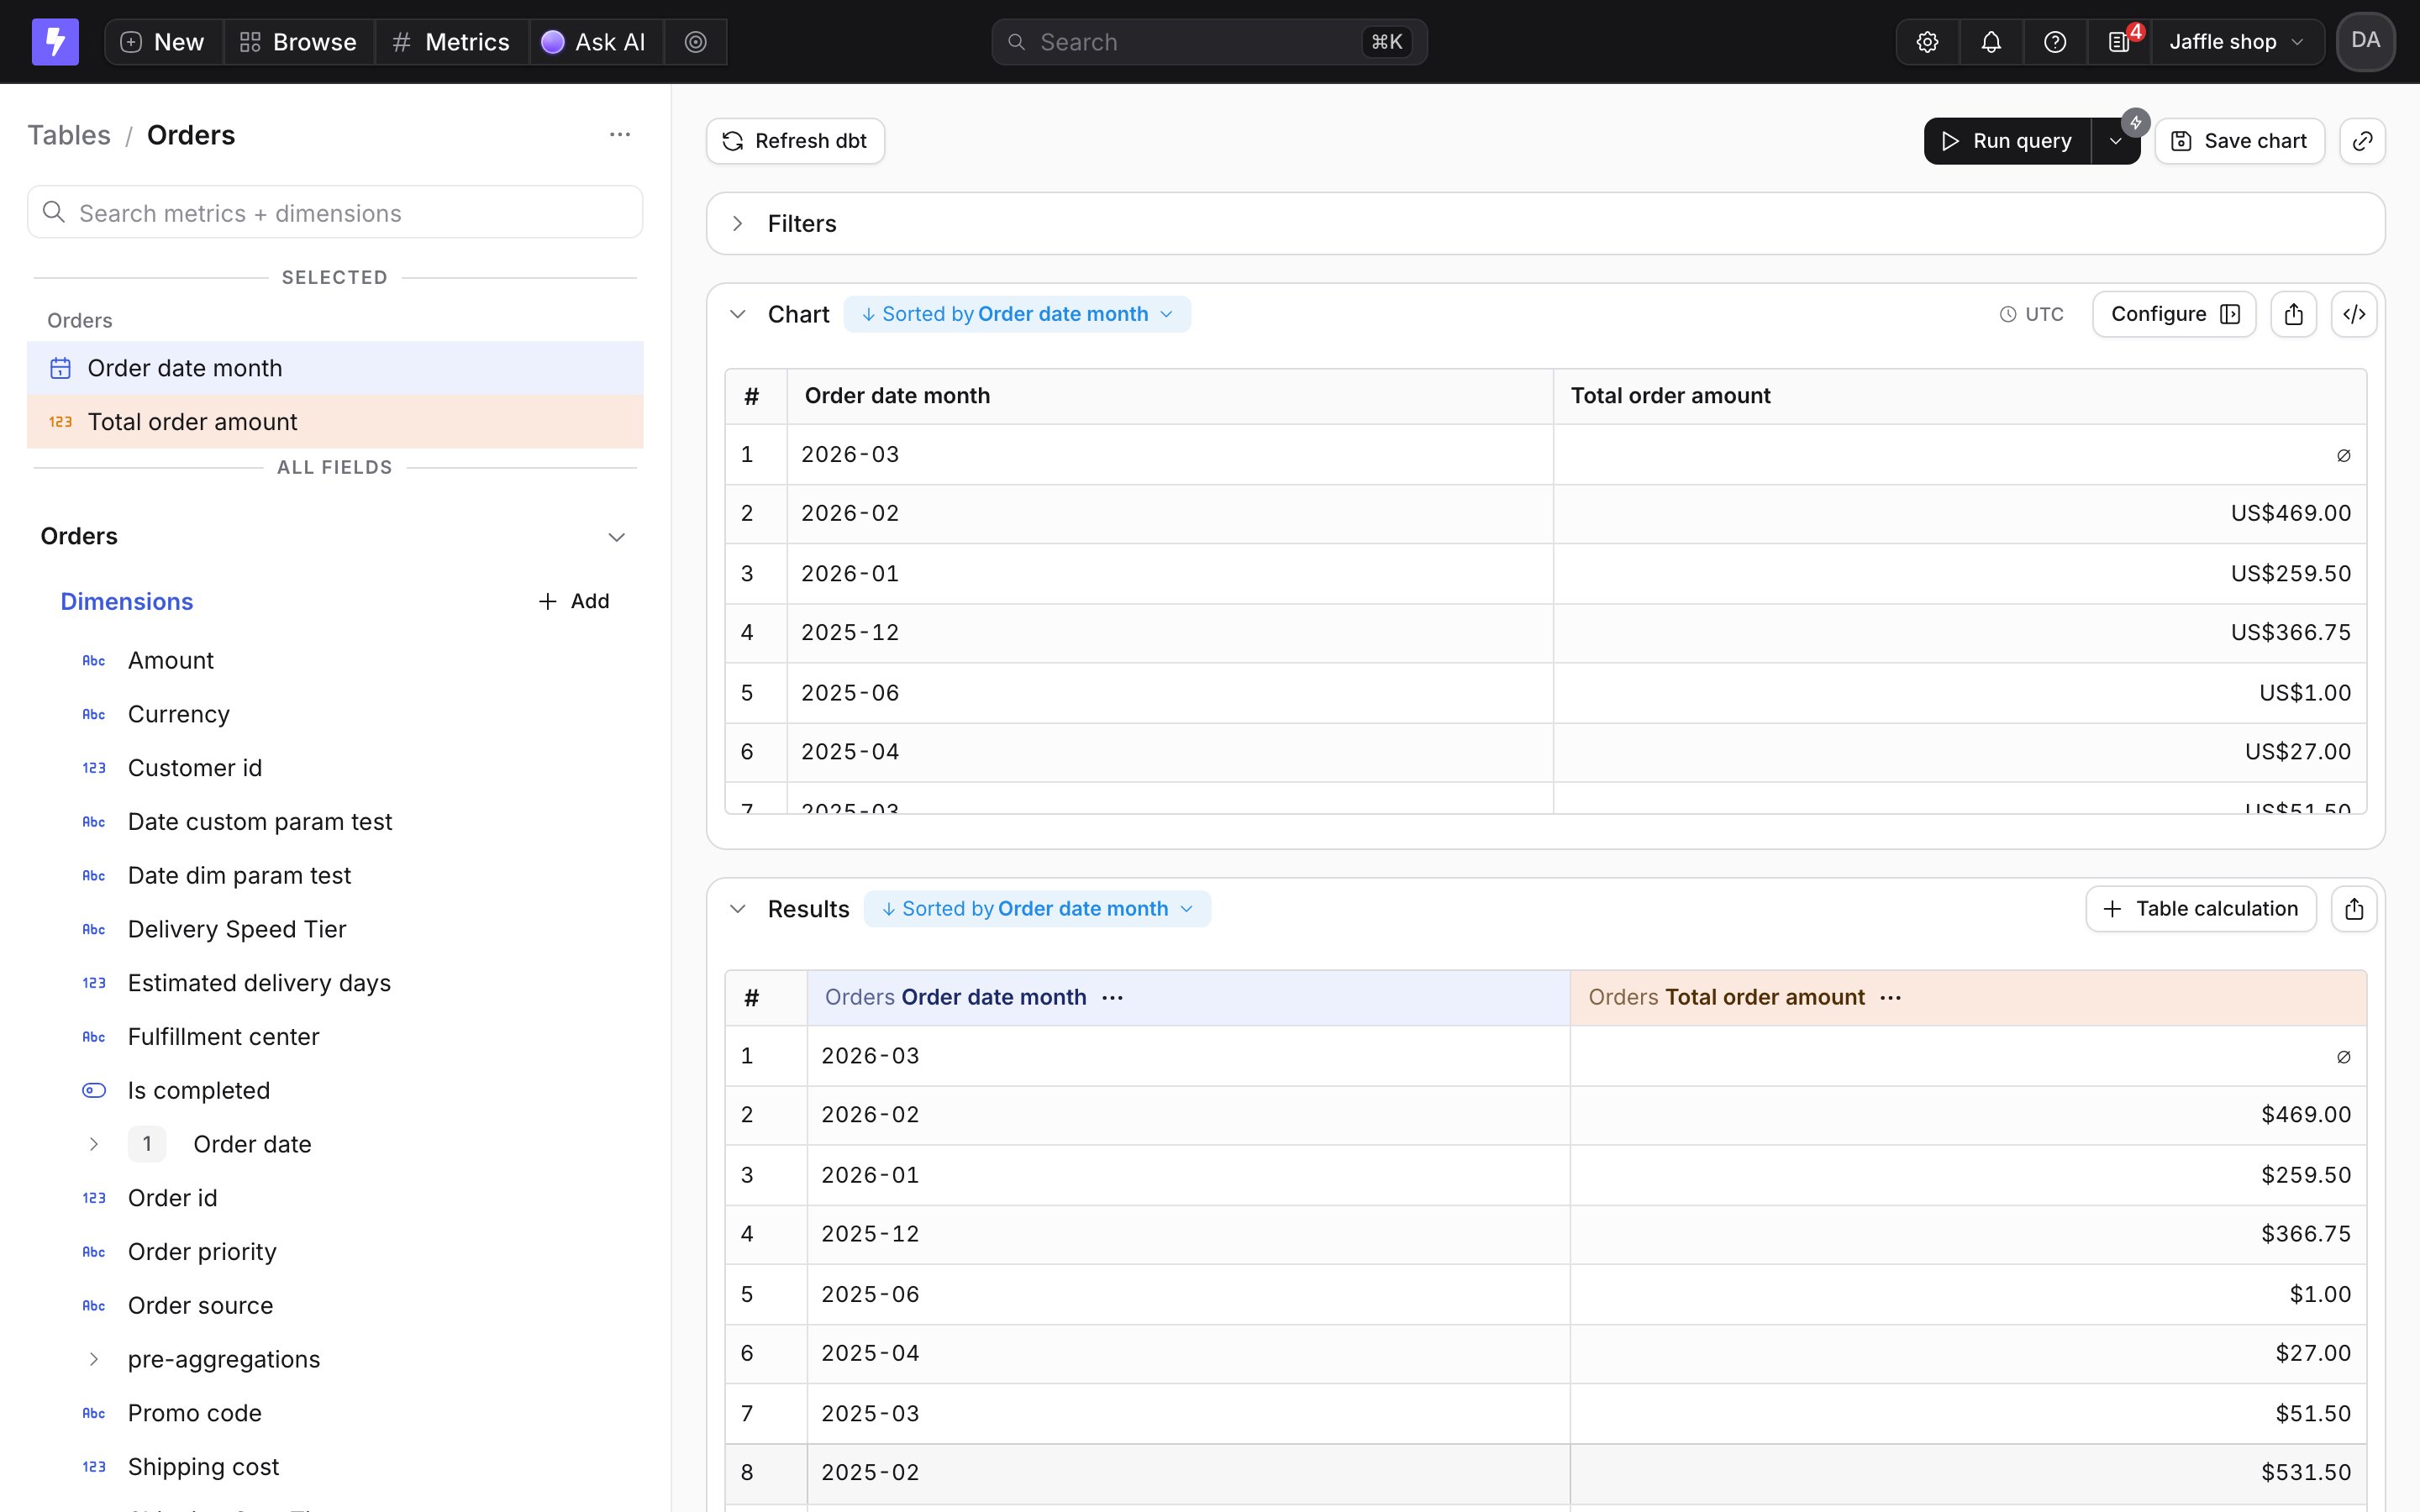
2
Choose Merge another query
Open the query options menu, the 

··· button next to the explore name at the top of the field panel, and choose Merge another query.3
Choose the second explore
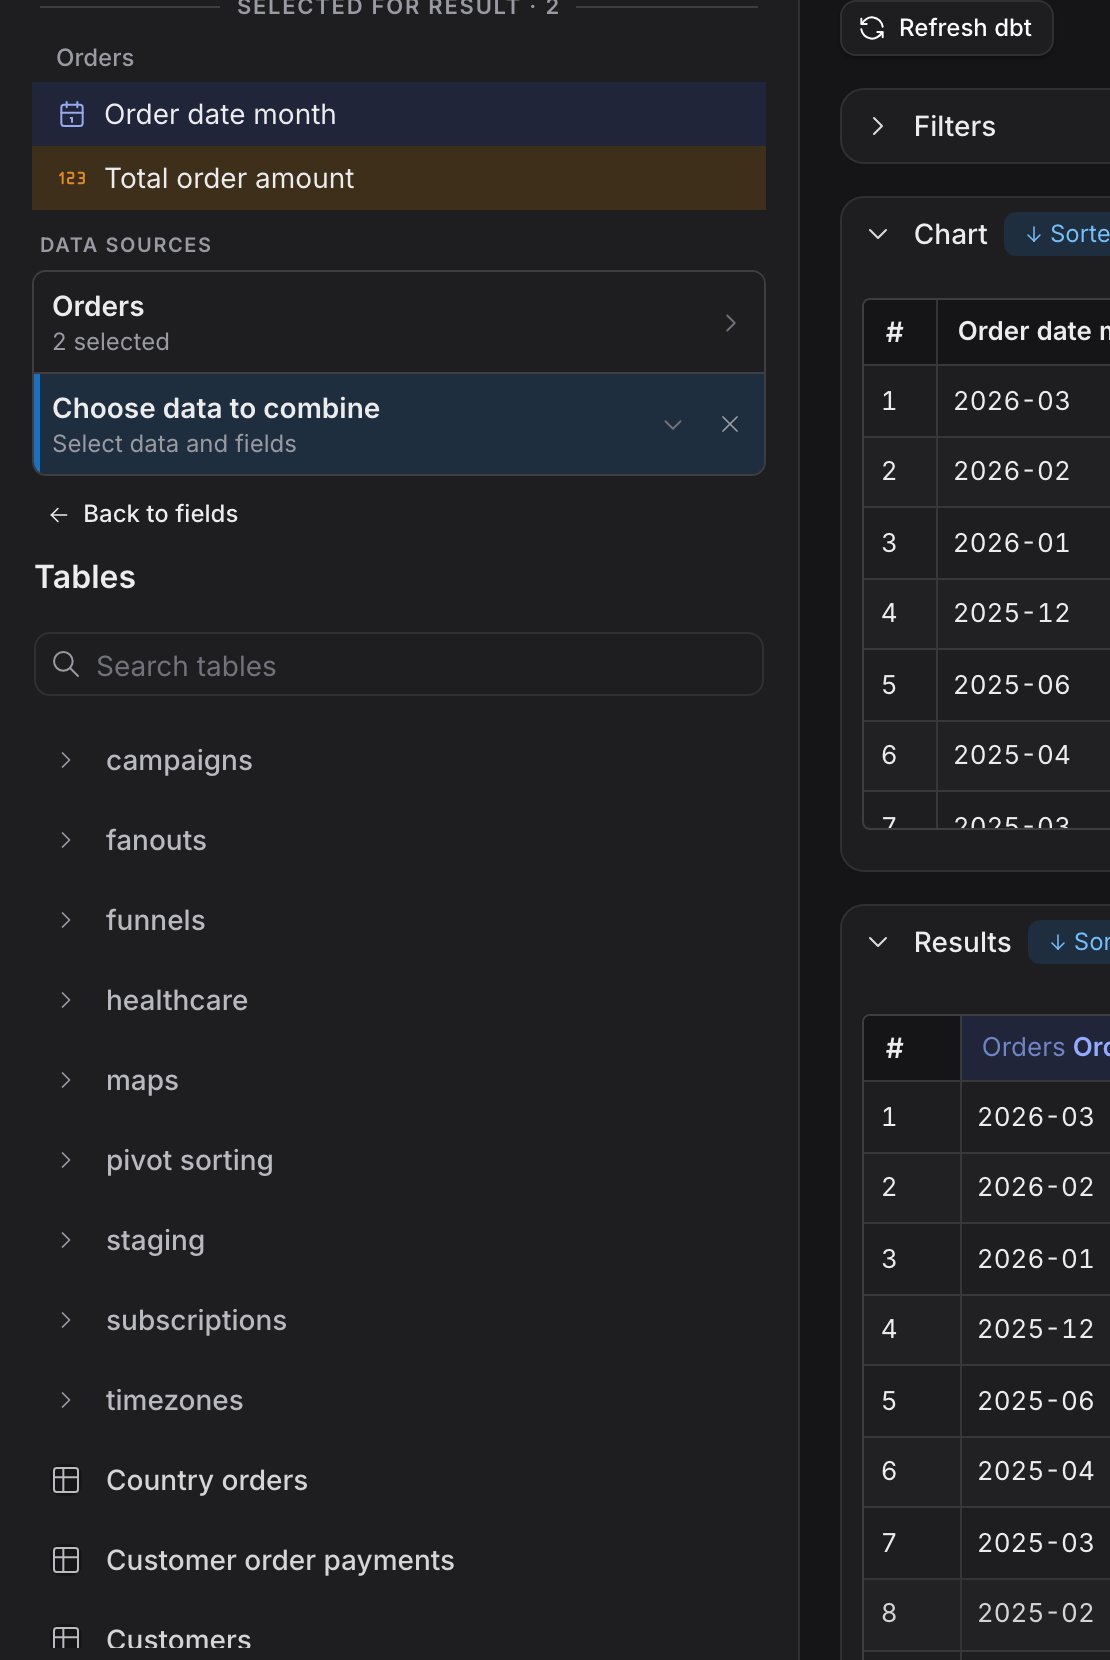
The field panel switches to a Data sources view. Your first explore is listed with its selected fields, and a new card asks you to choose data to combine. Search the table list and pick the second explore.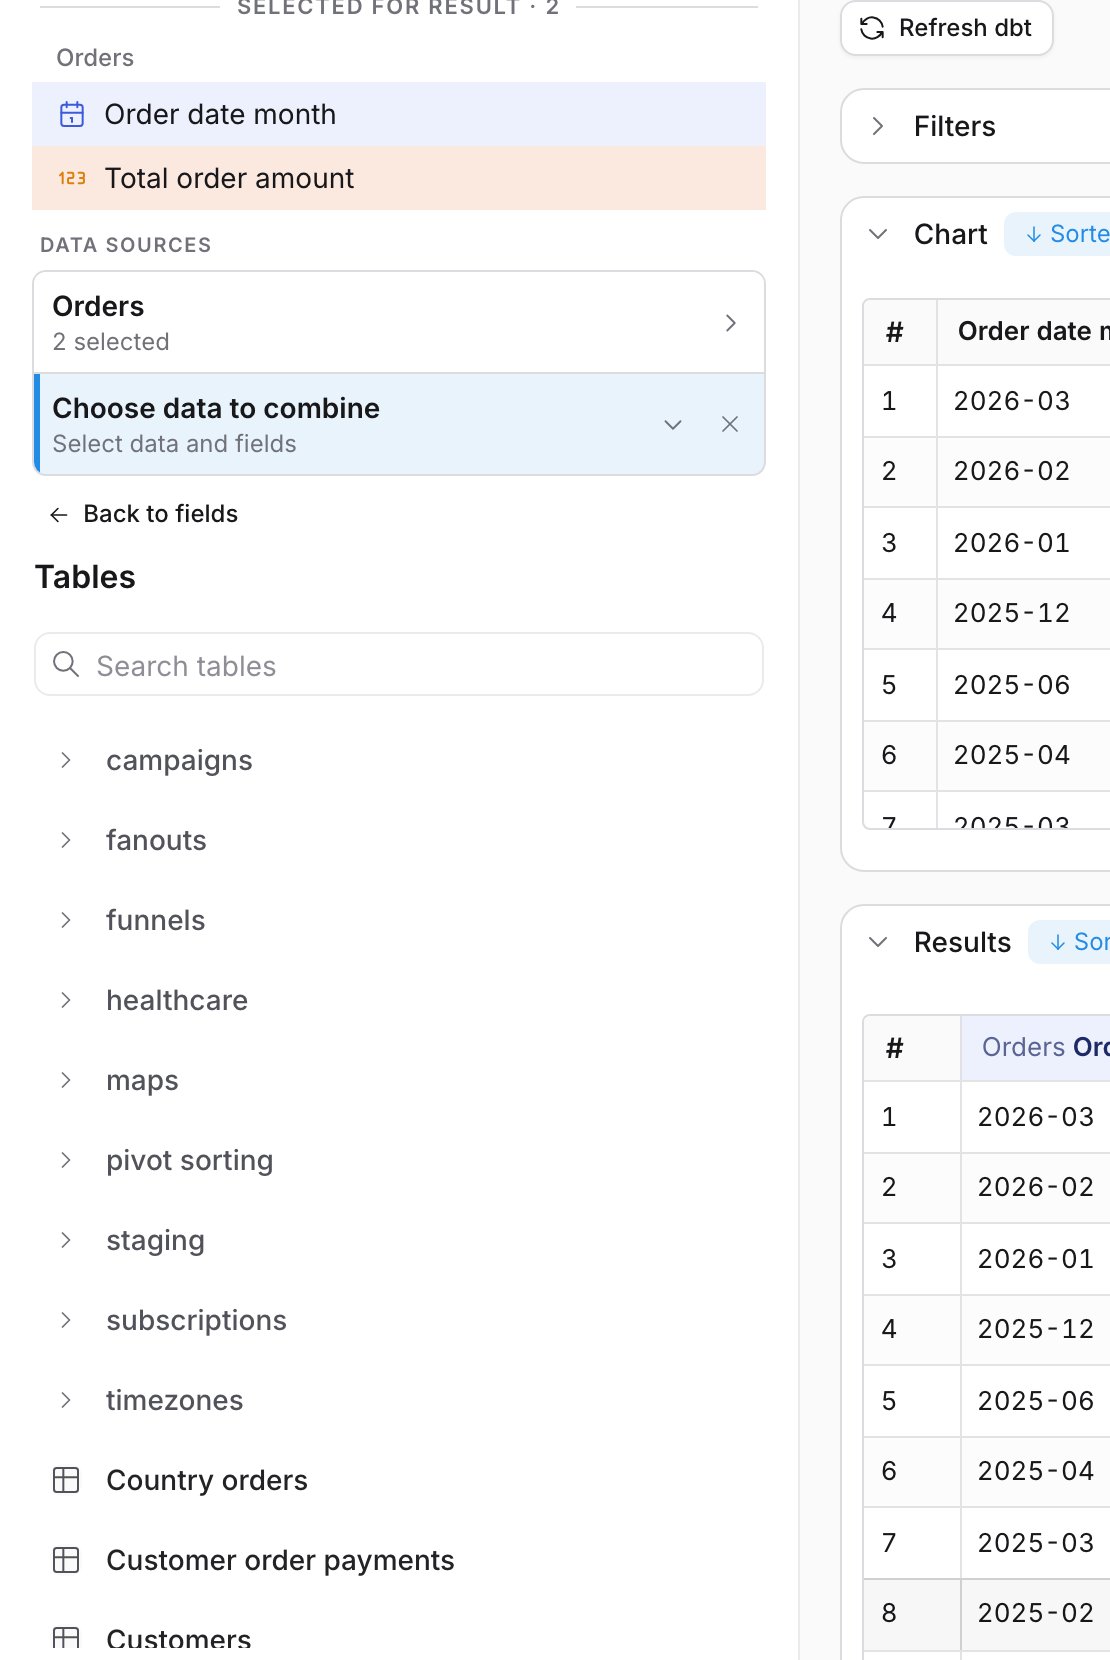
4
Pick fields from the second side
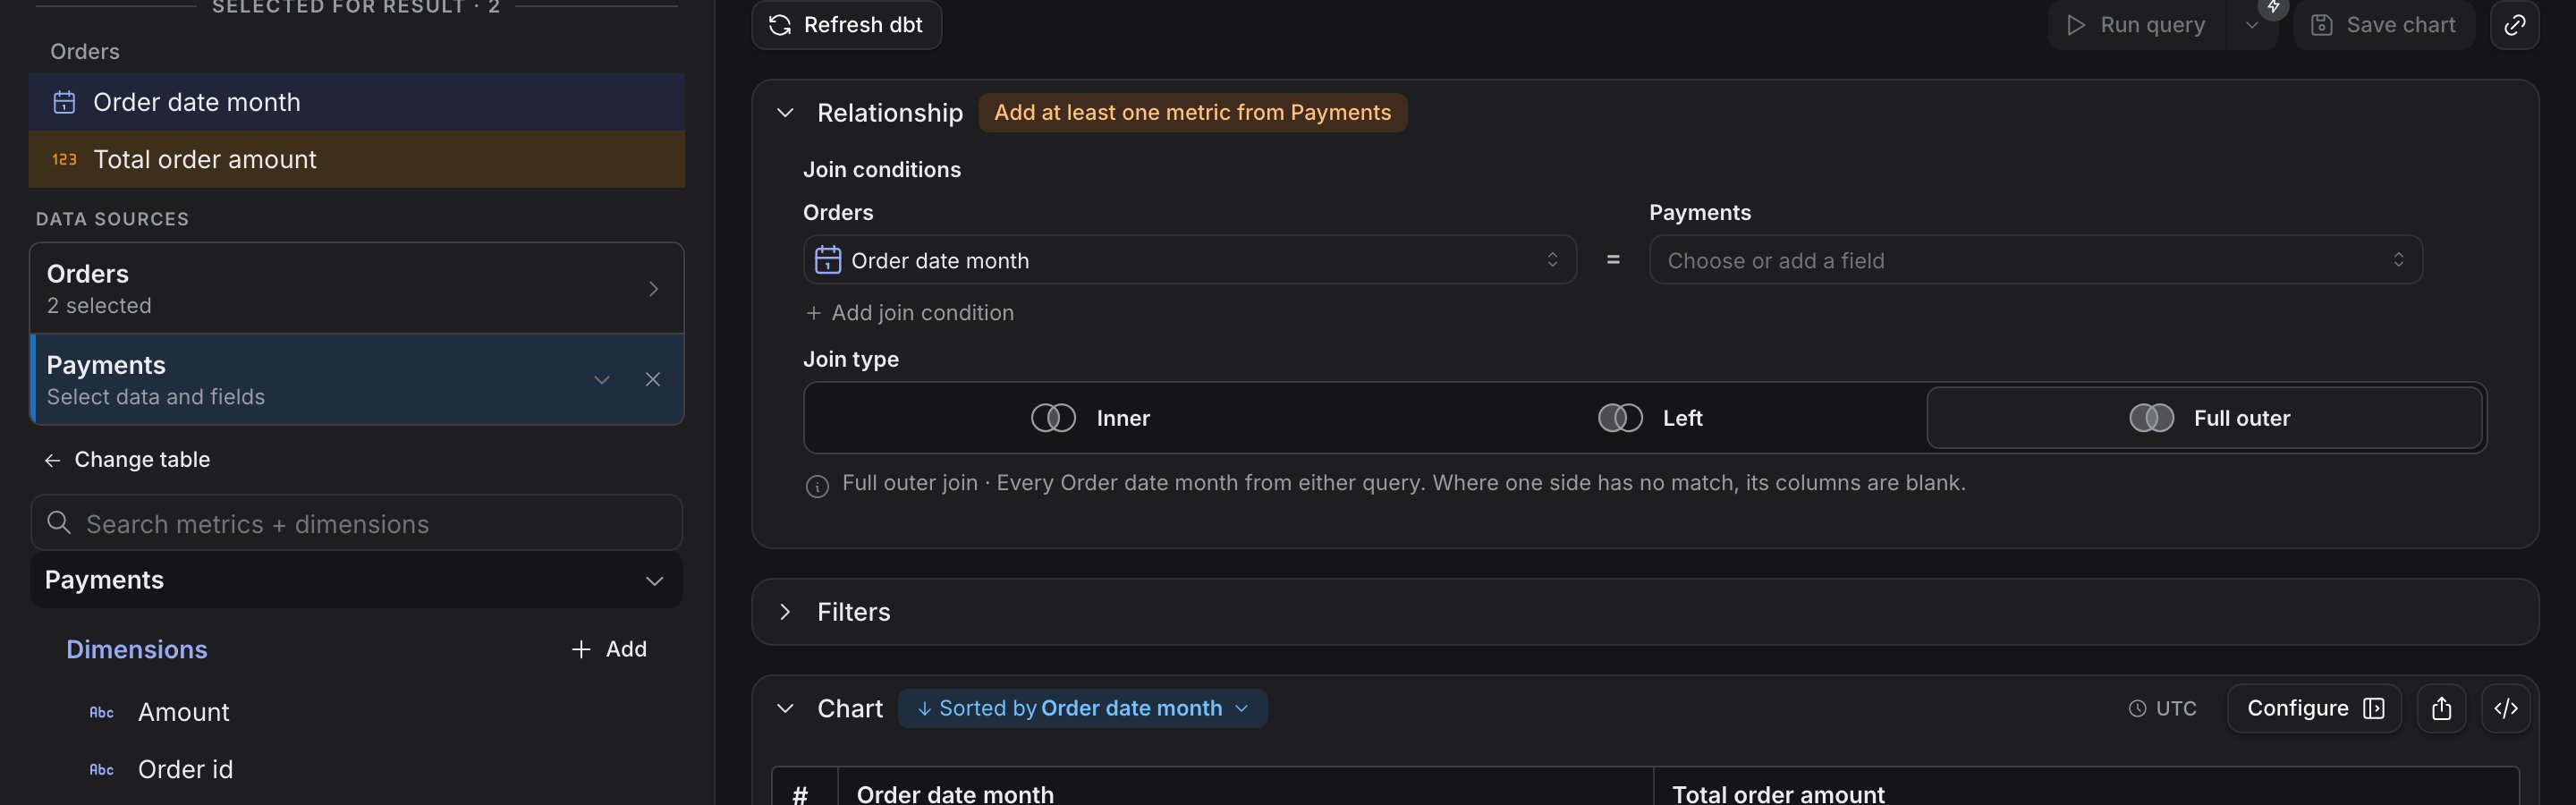
You see the second explore’s field tree. Add at least one metric. The Relationship card tells you what is still missing.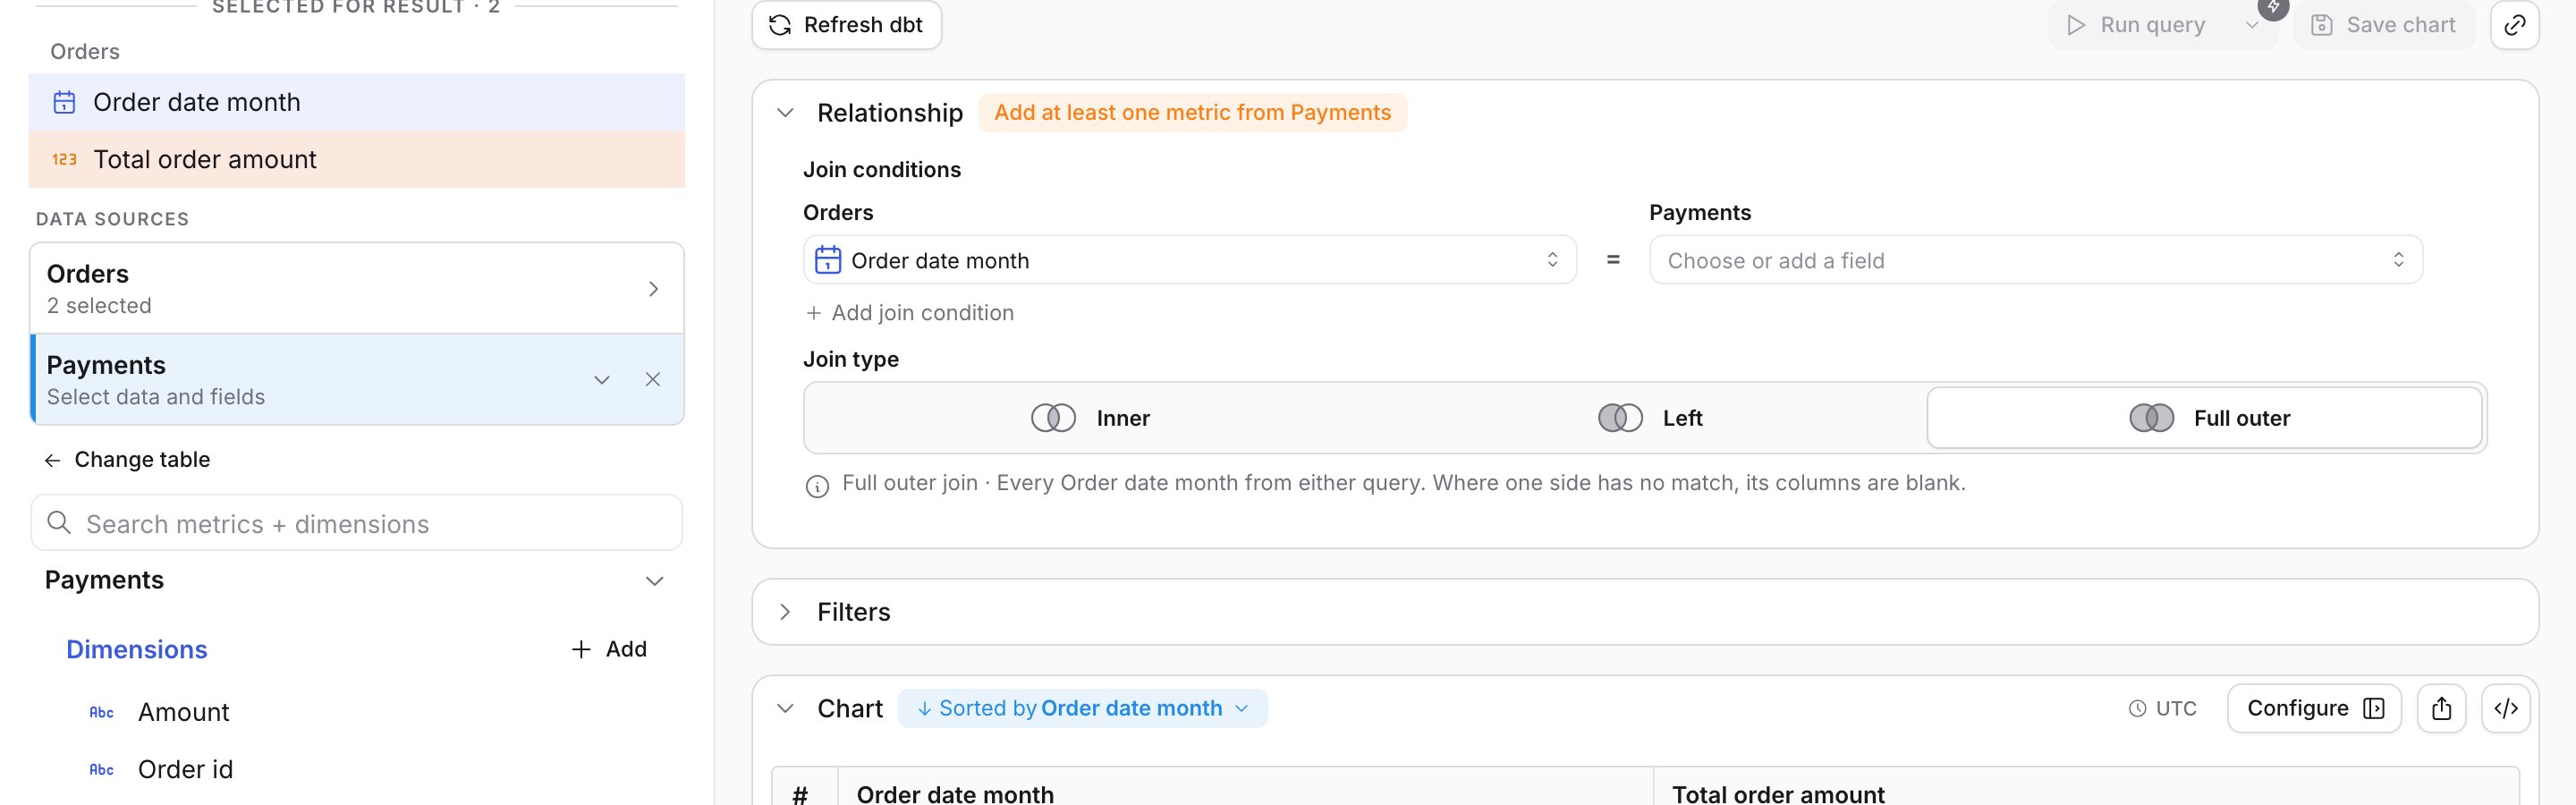
5
Set the join field on each side
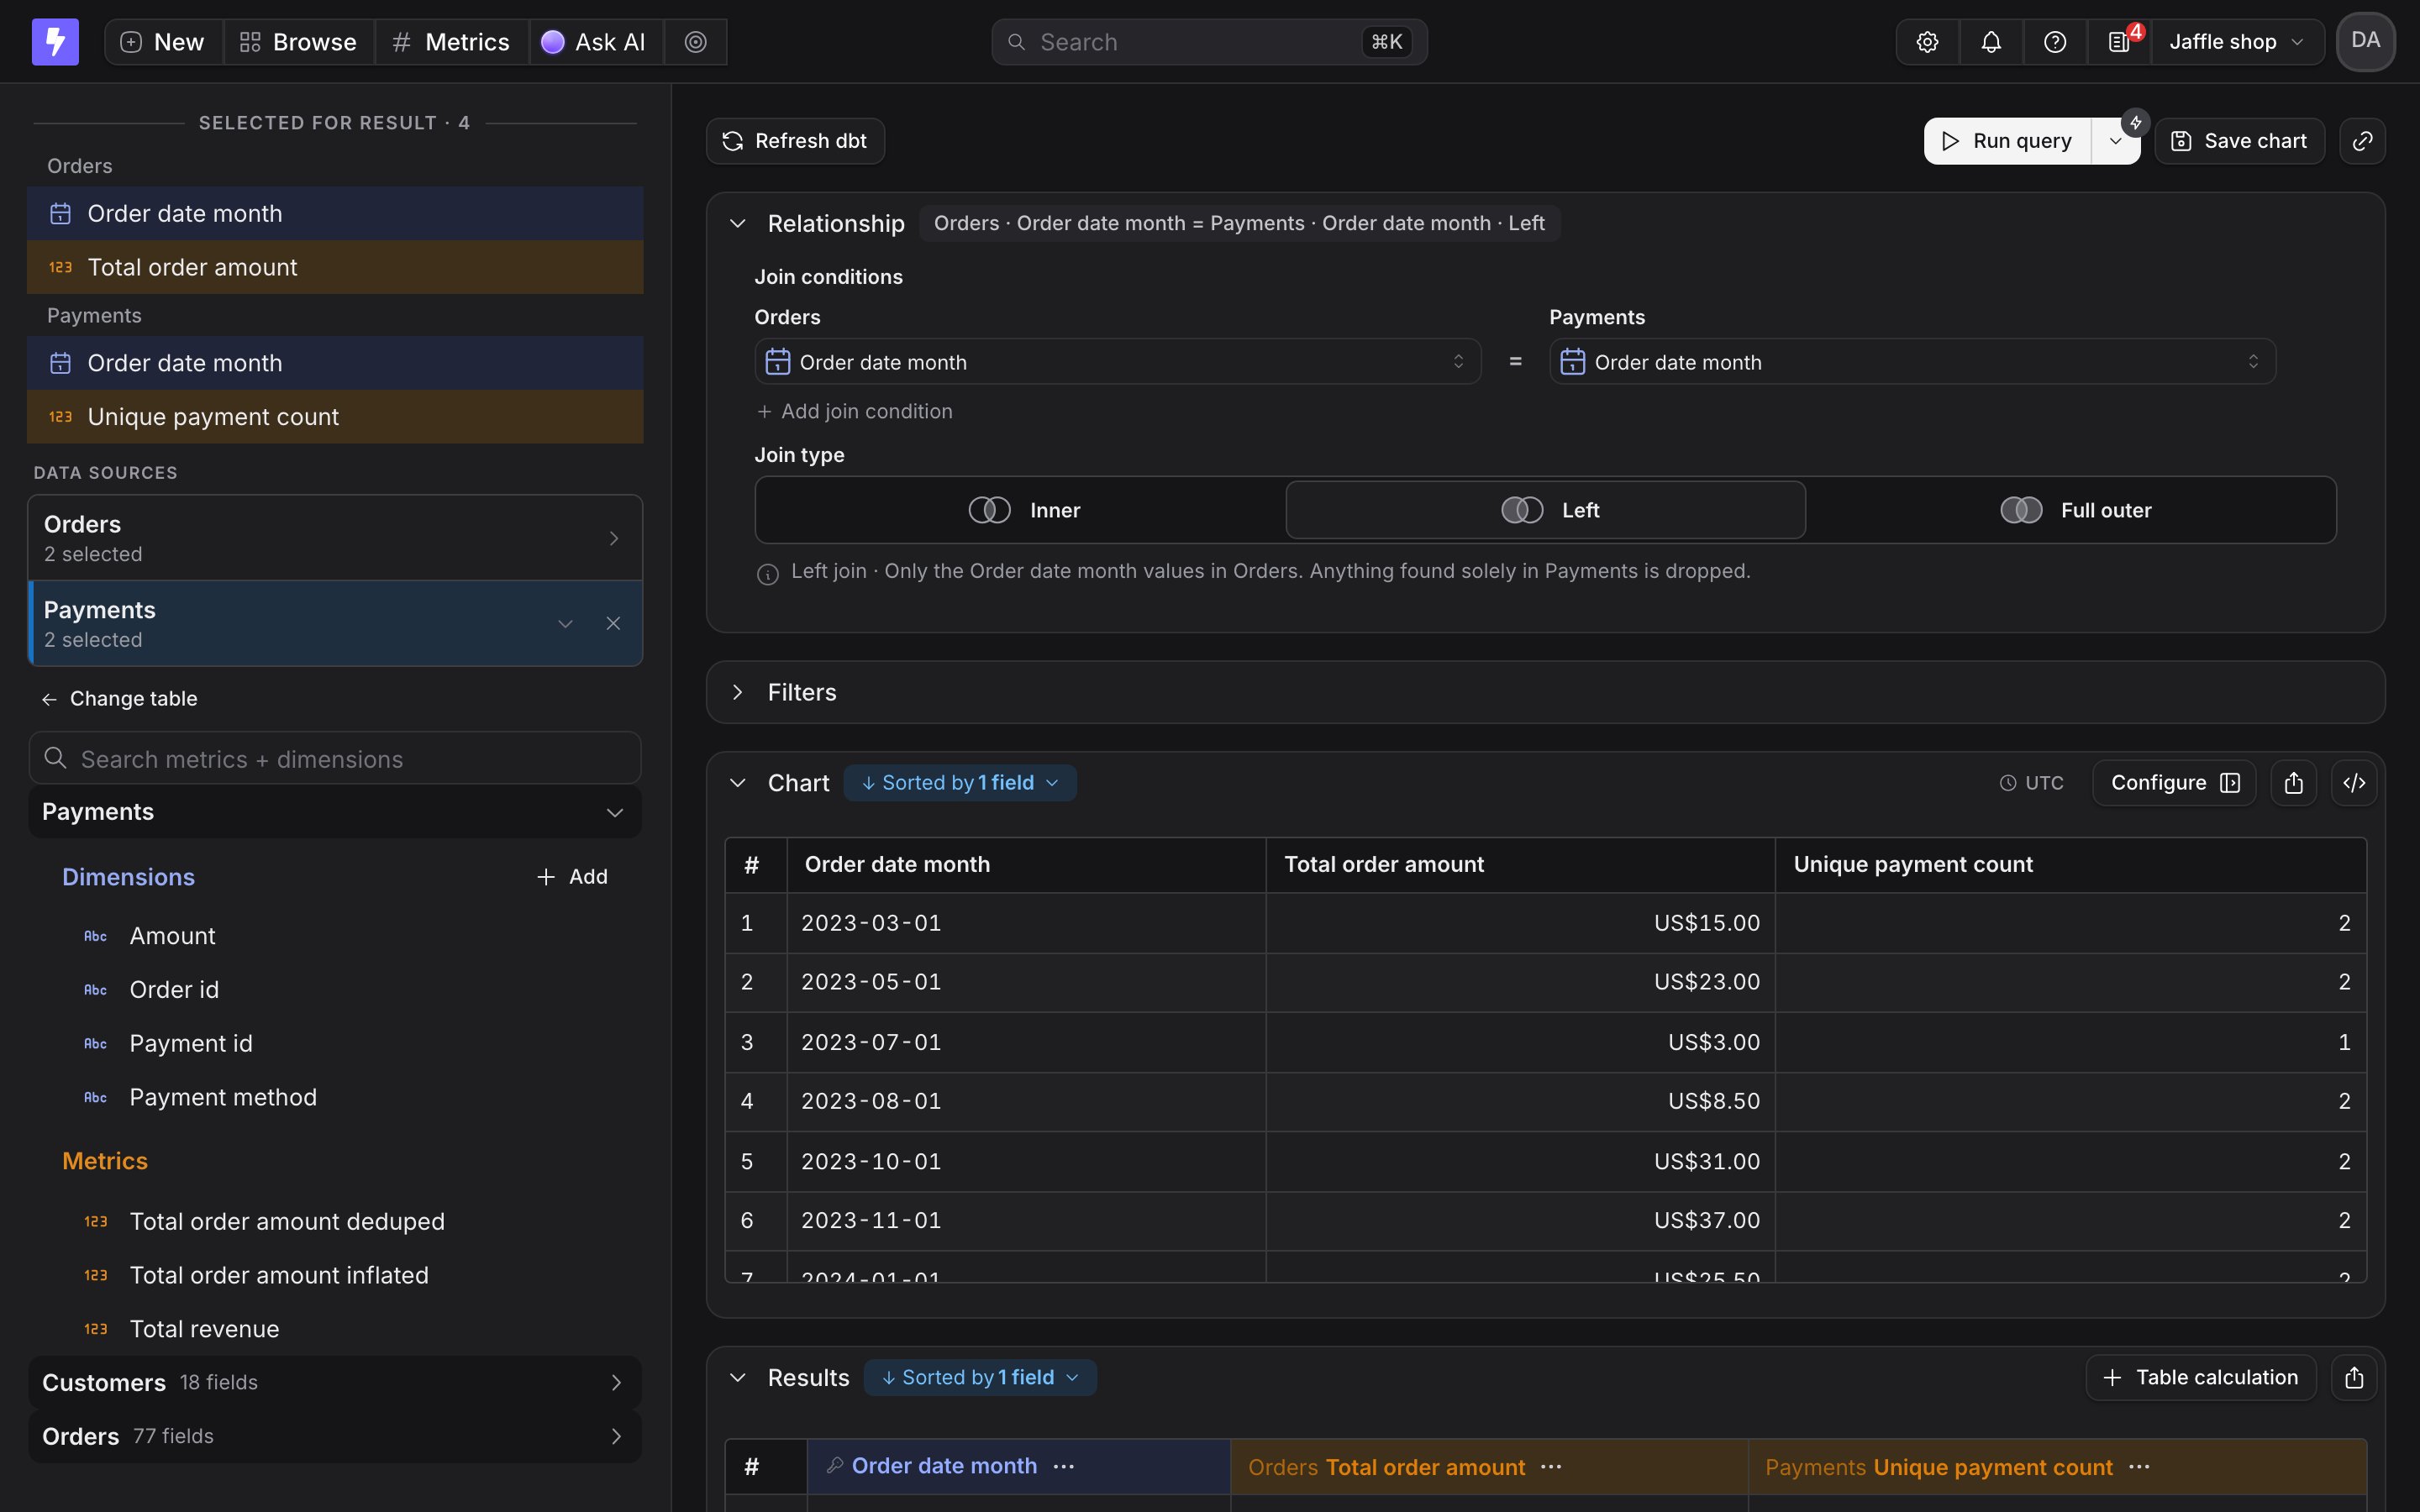
In the Relationship card, each side has a field picker that offers dimensions only. The first side is prefilled with the dimension you already selected. Choose the matching field on the second side. Use Add join condition when the sides match on more than one field.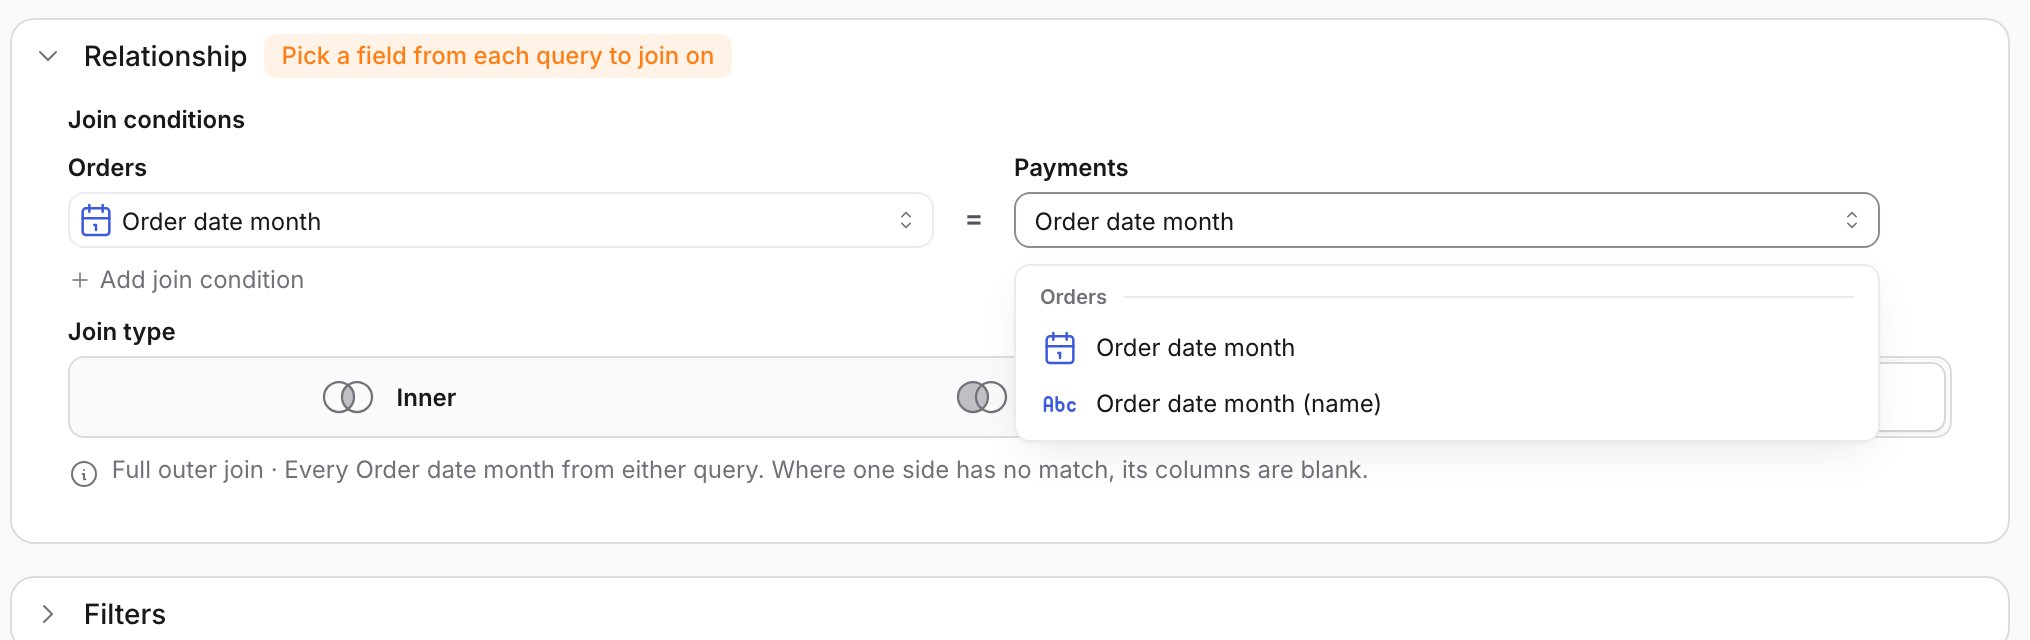
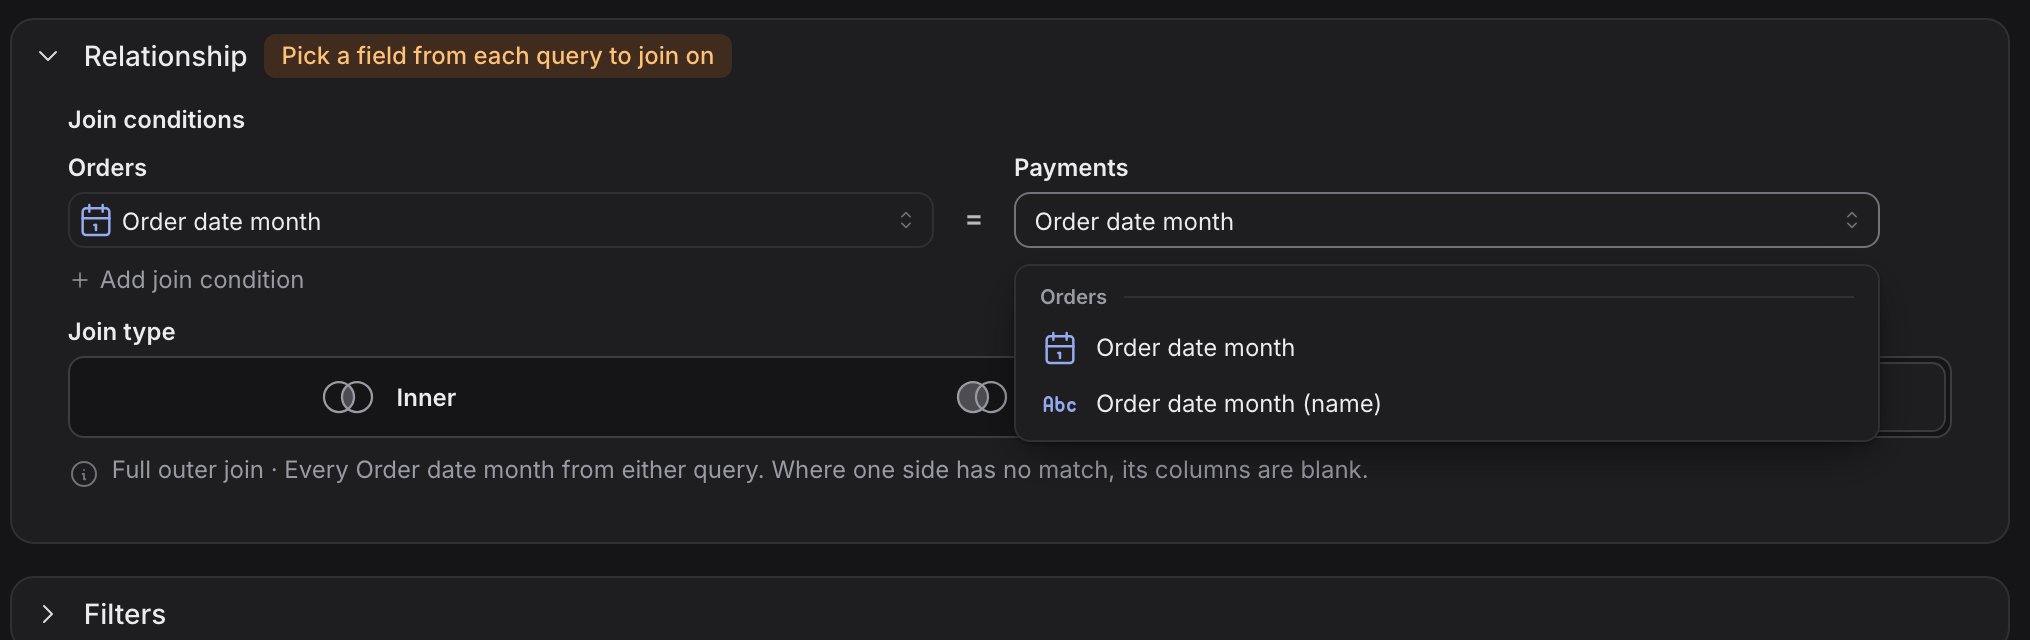
6
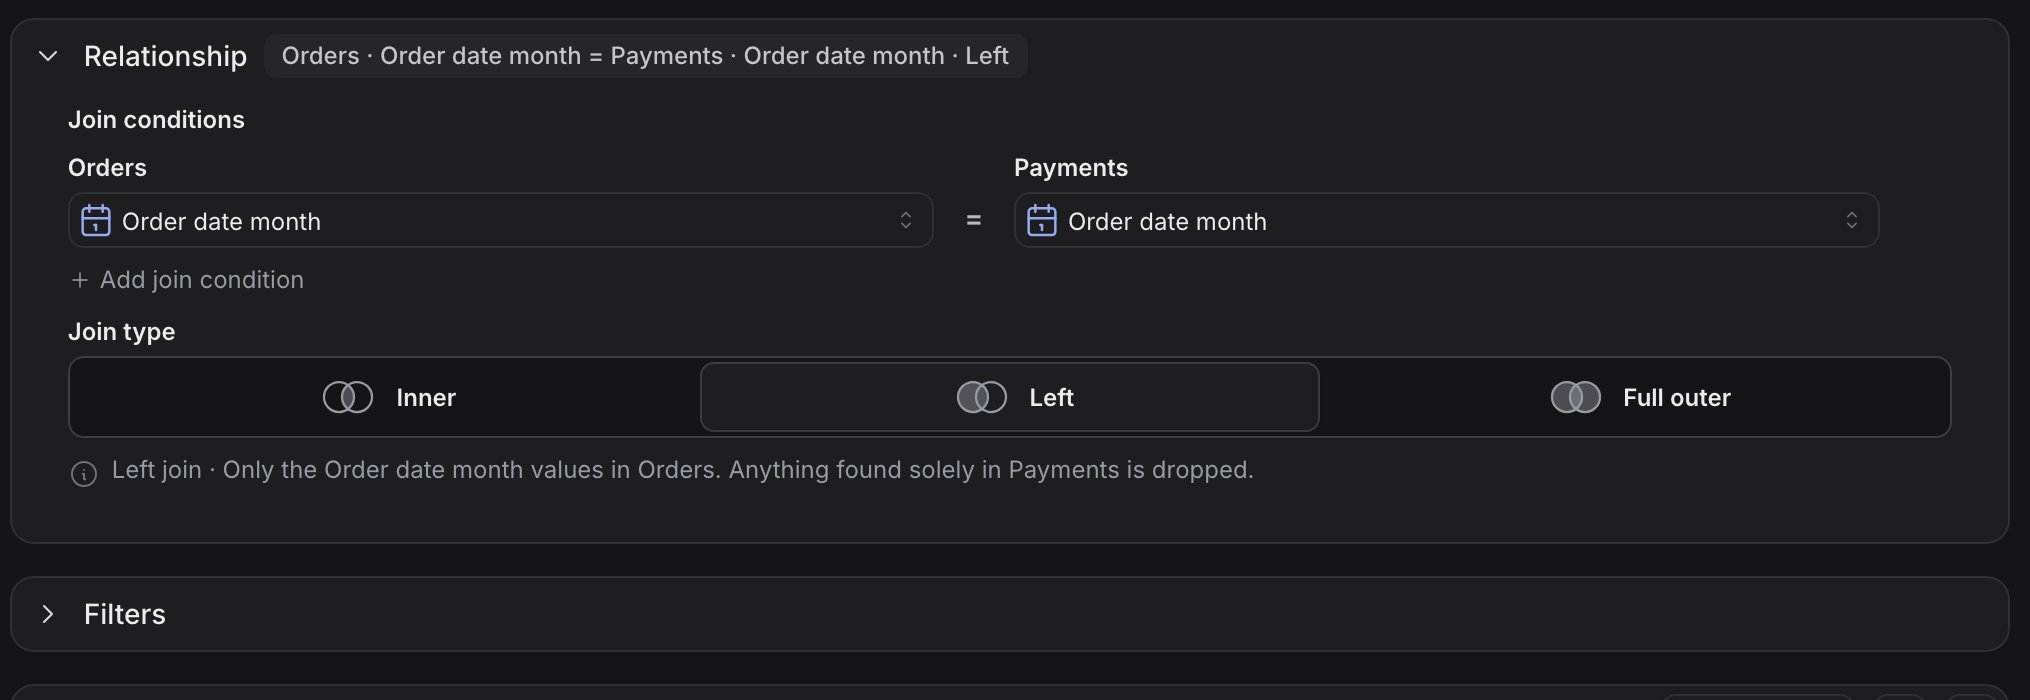
Choose the join type
The summary next to Relationship reads the join back in words. The default is a full outer join. See which join type to choose.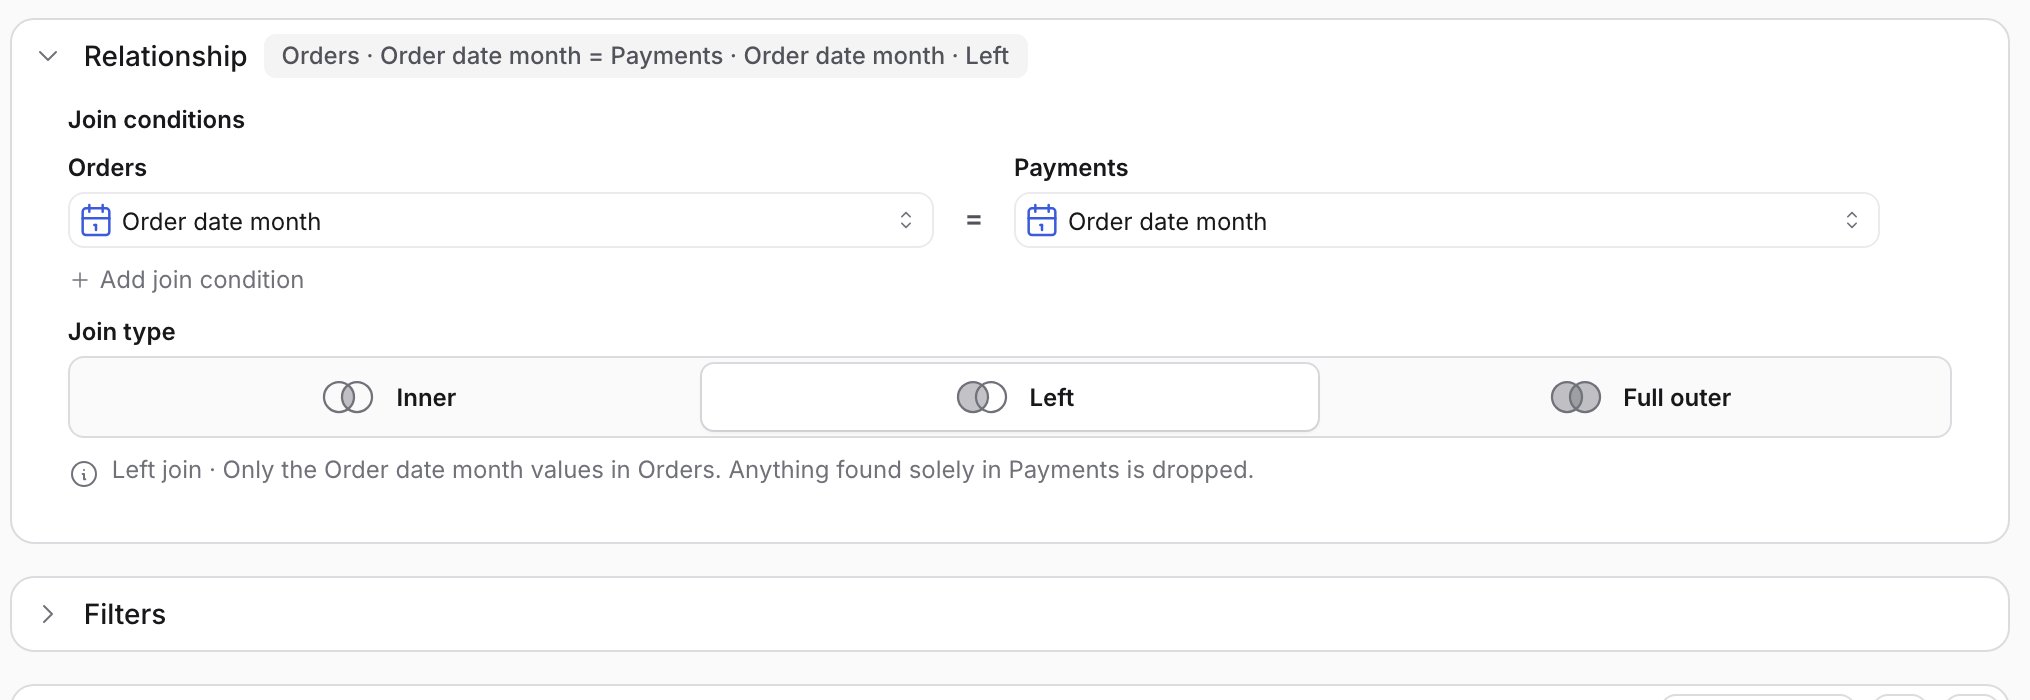
7
Run the query
Results arrive as one table. The join key has a key icon, and every other column carries the name of the explore it came from. Configure the chart the way you would for any explore.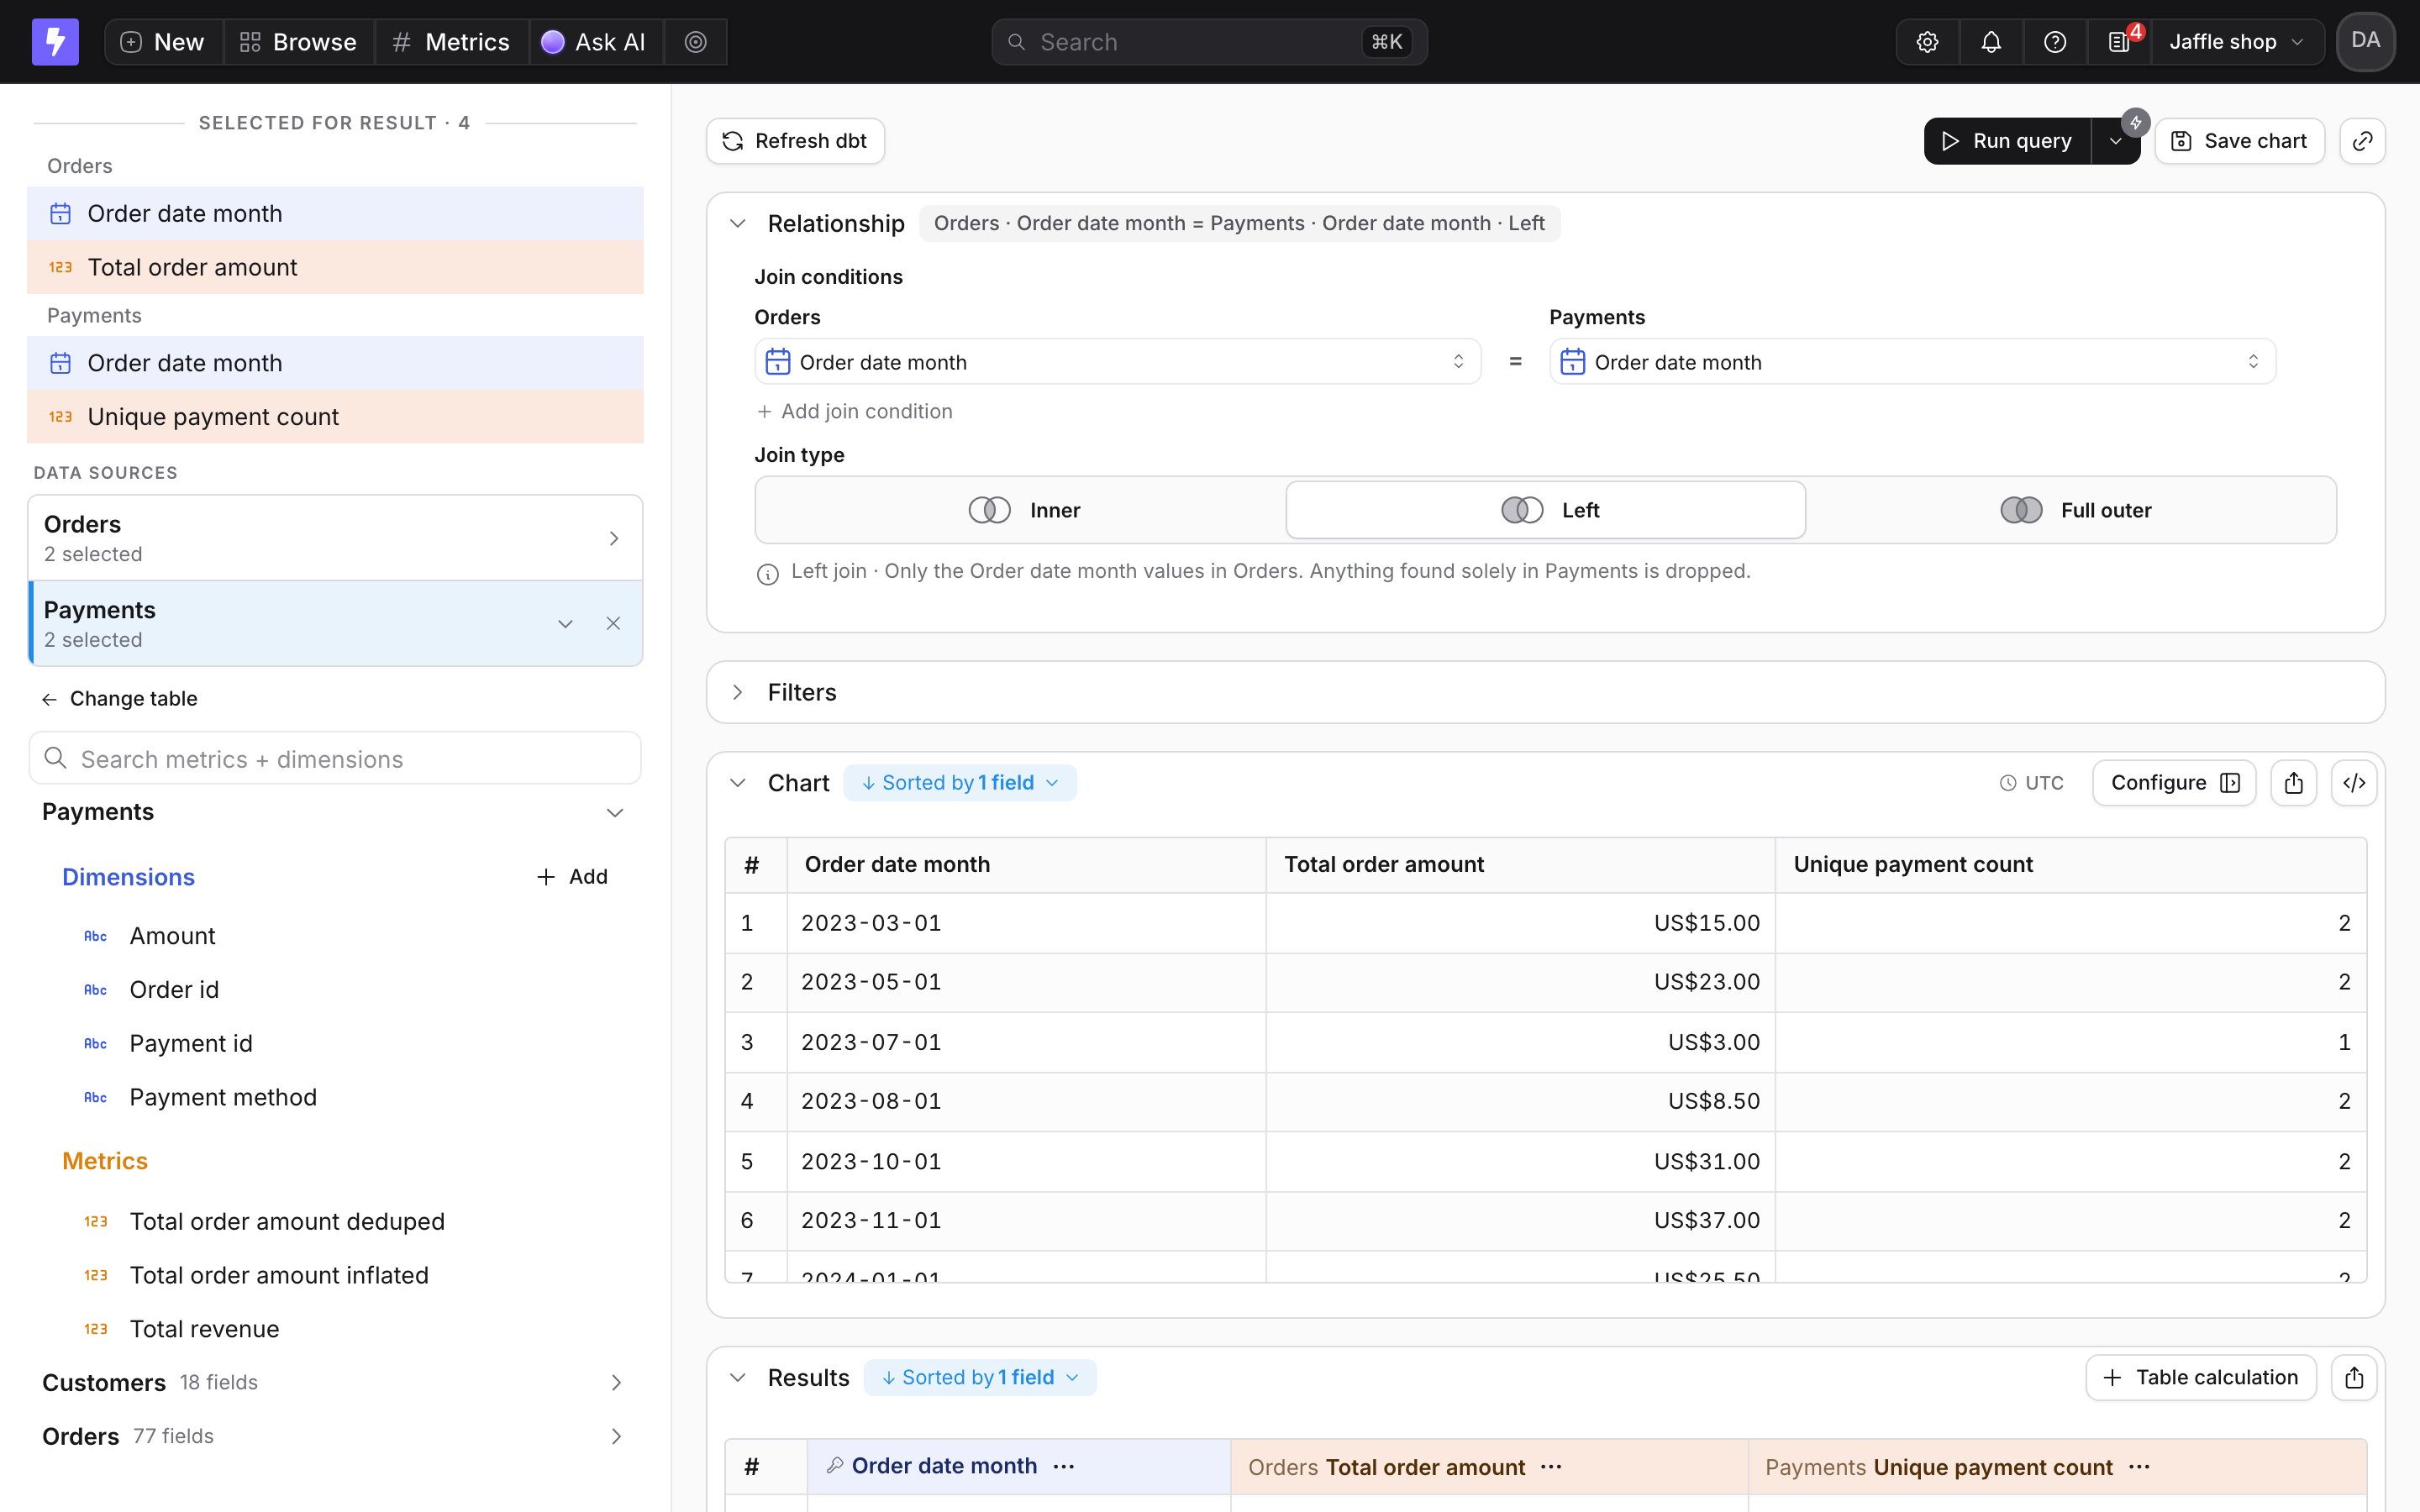
8
Save the chart
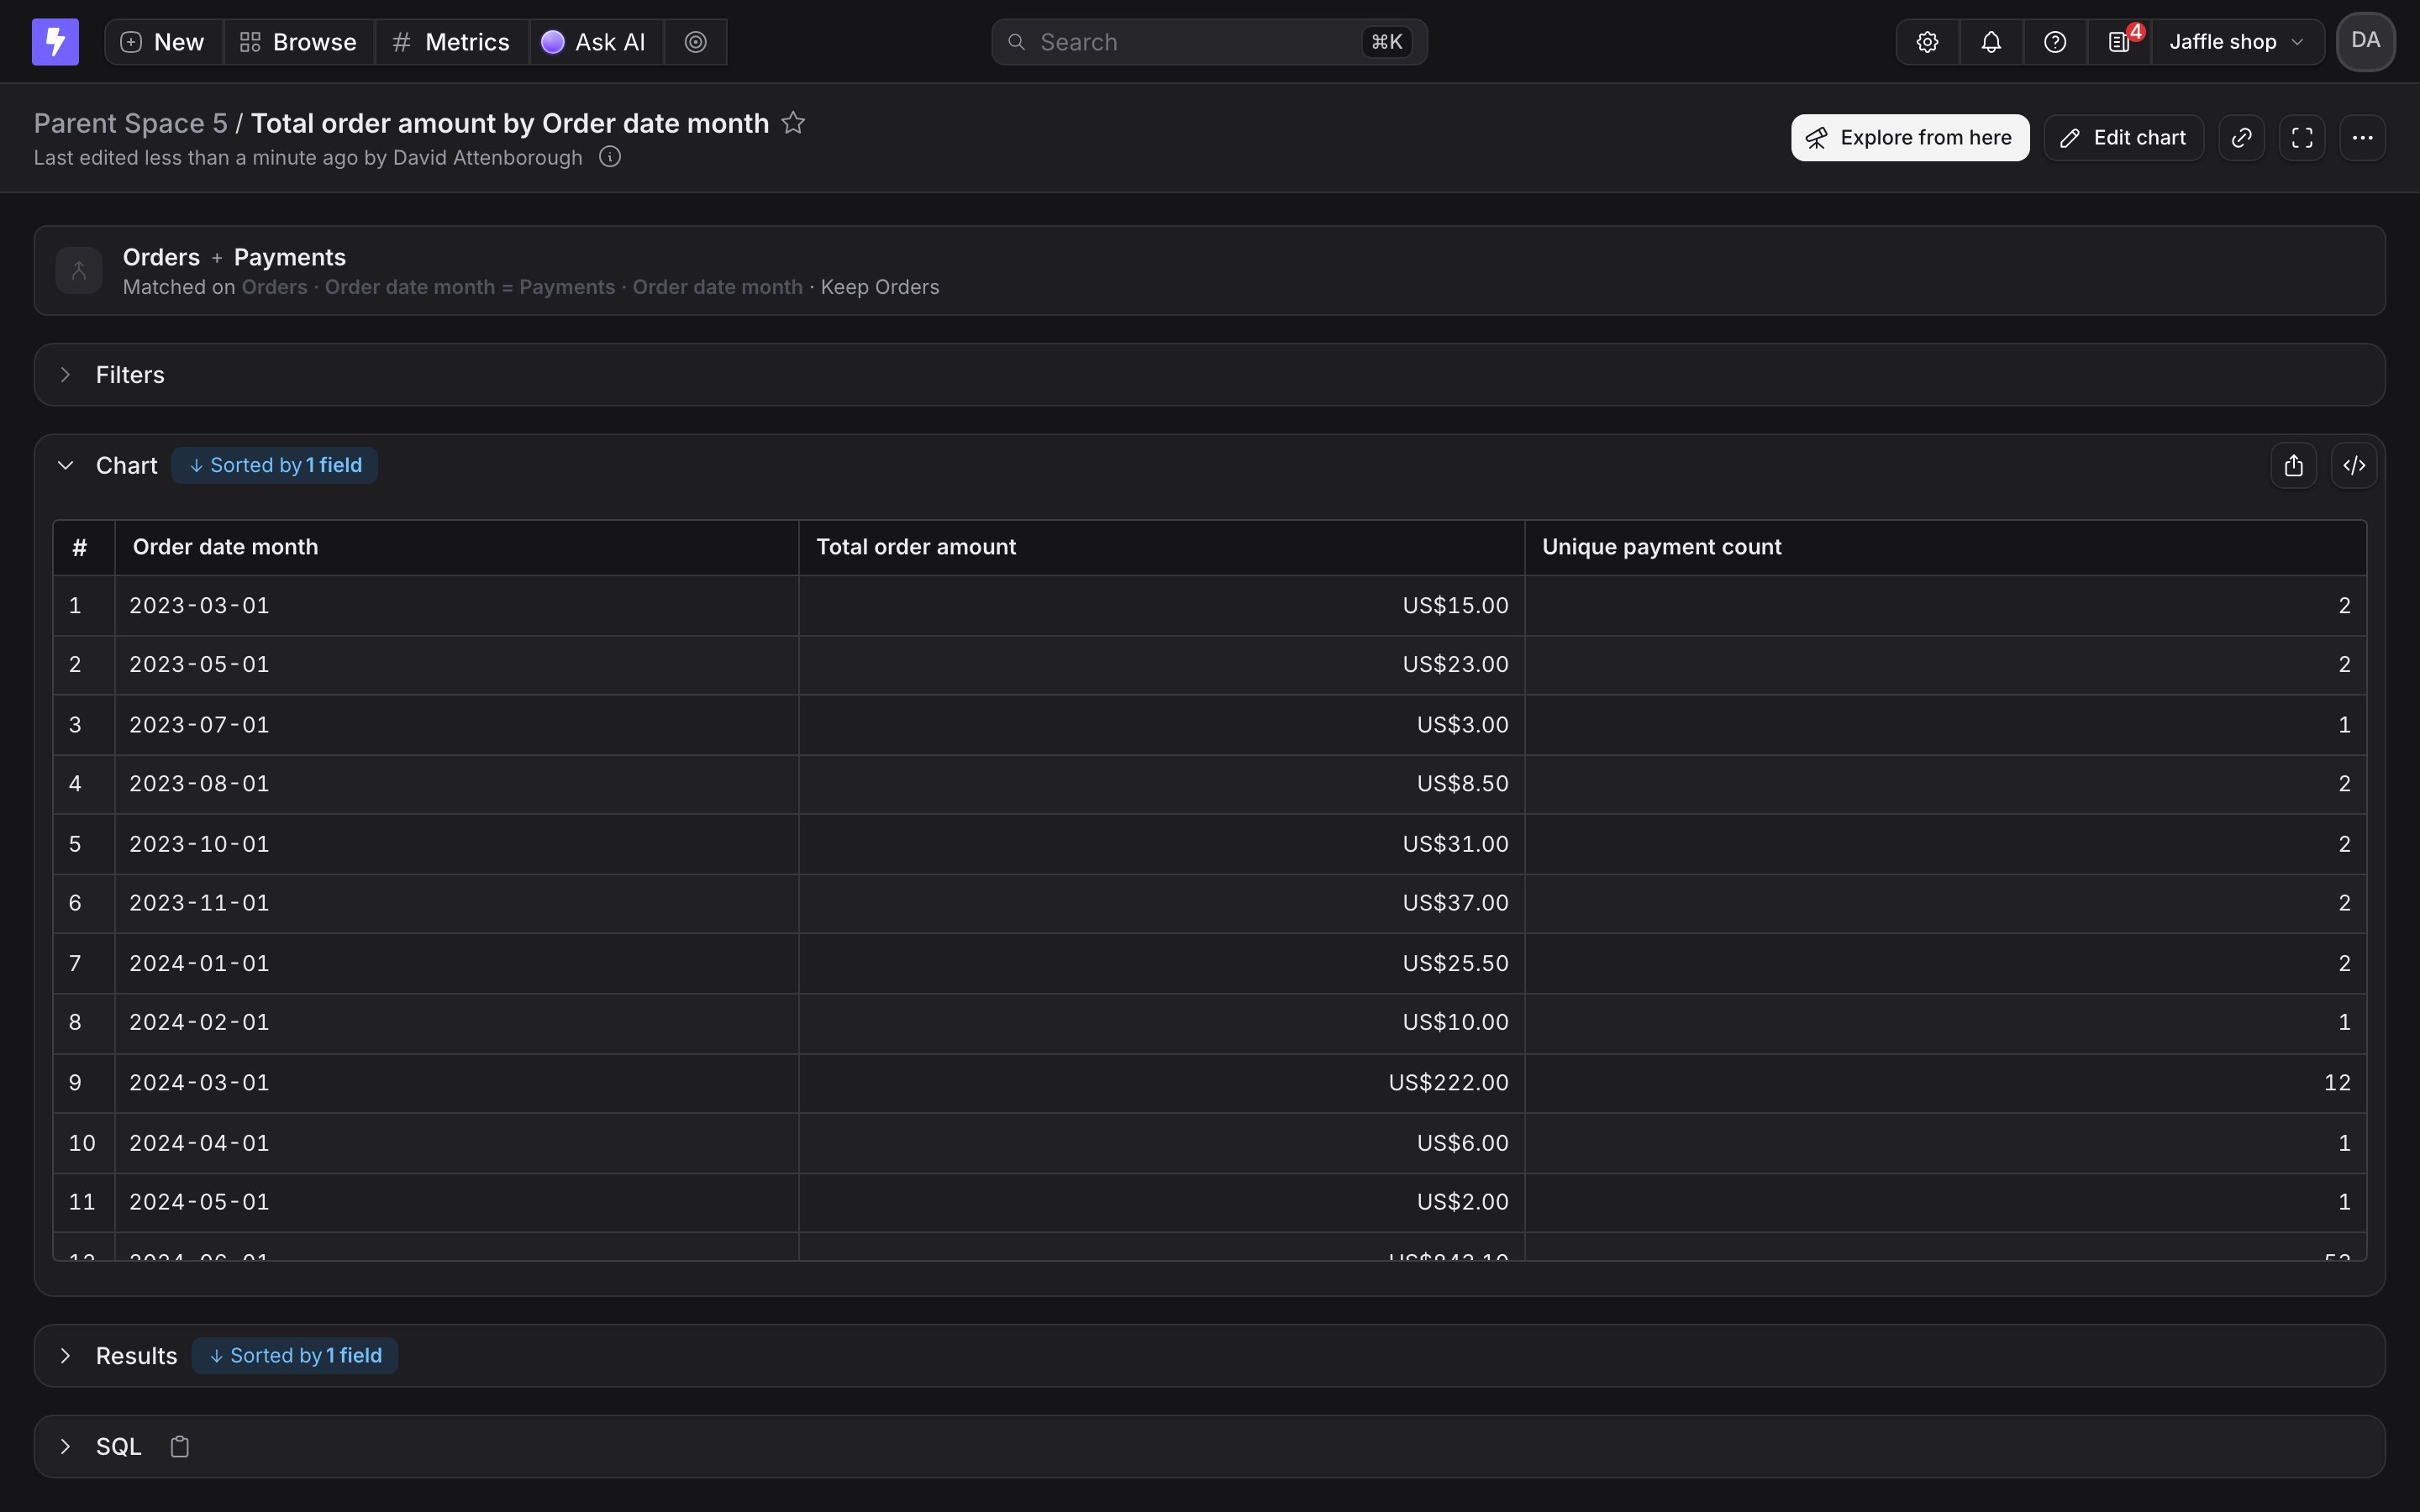
Save chart works as it does for any chart. The saved chart shows the relationship at the top and can be added to dashboards and scheduled deliveries.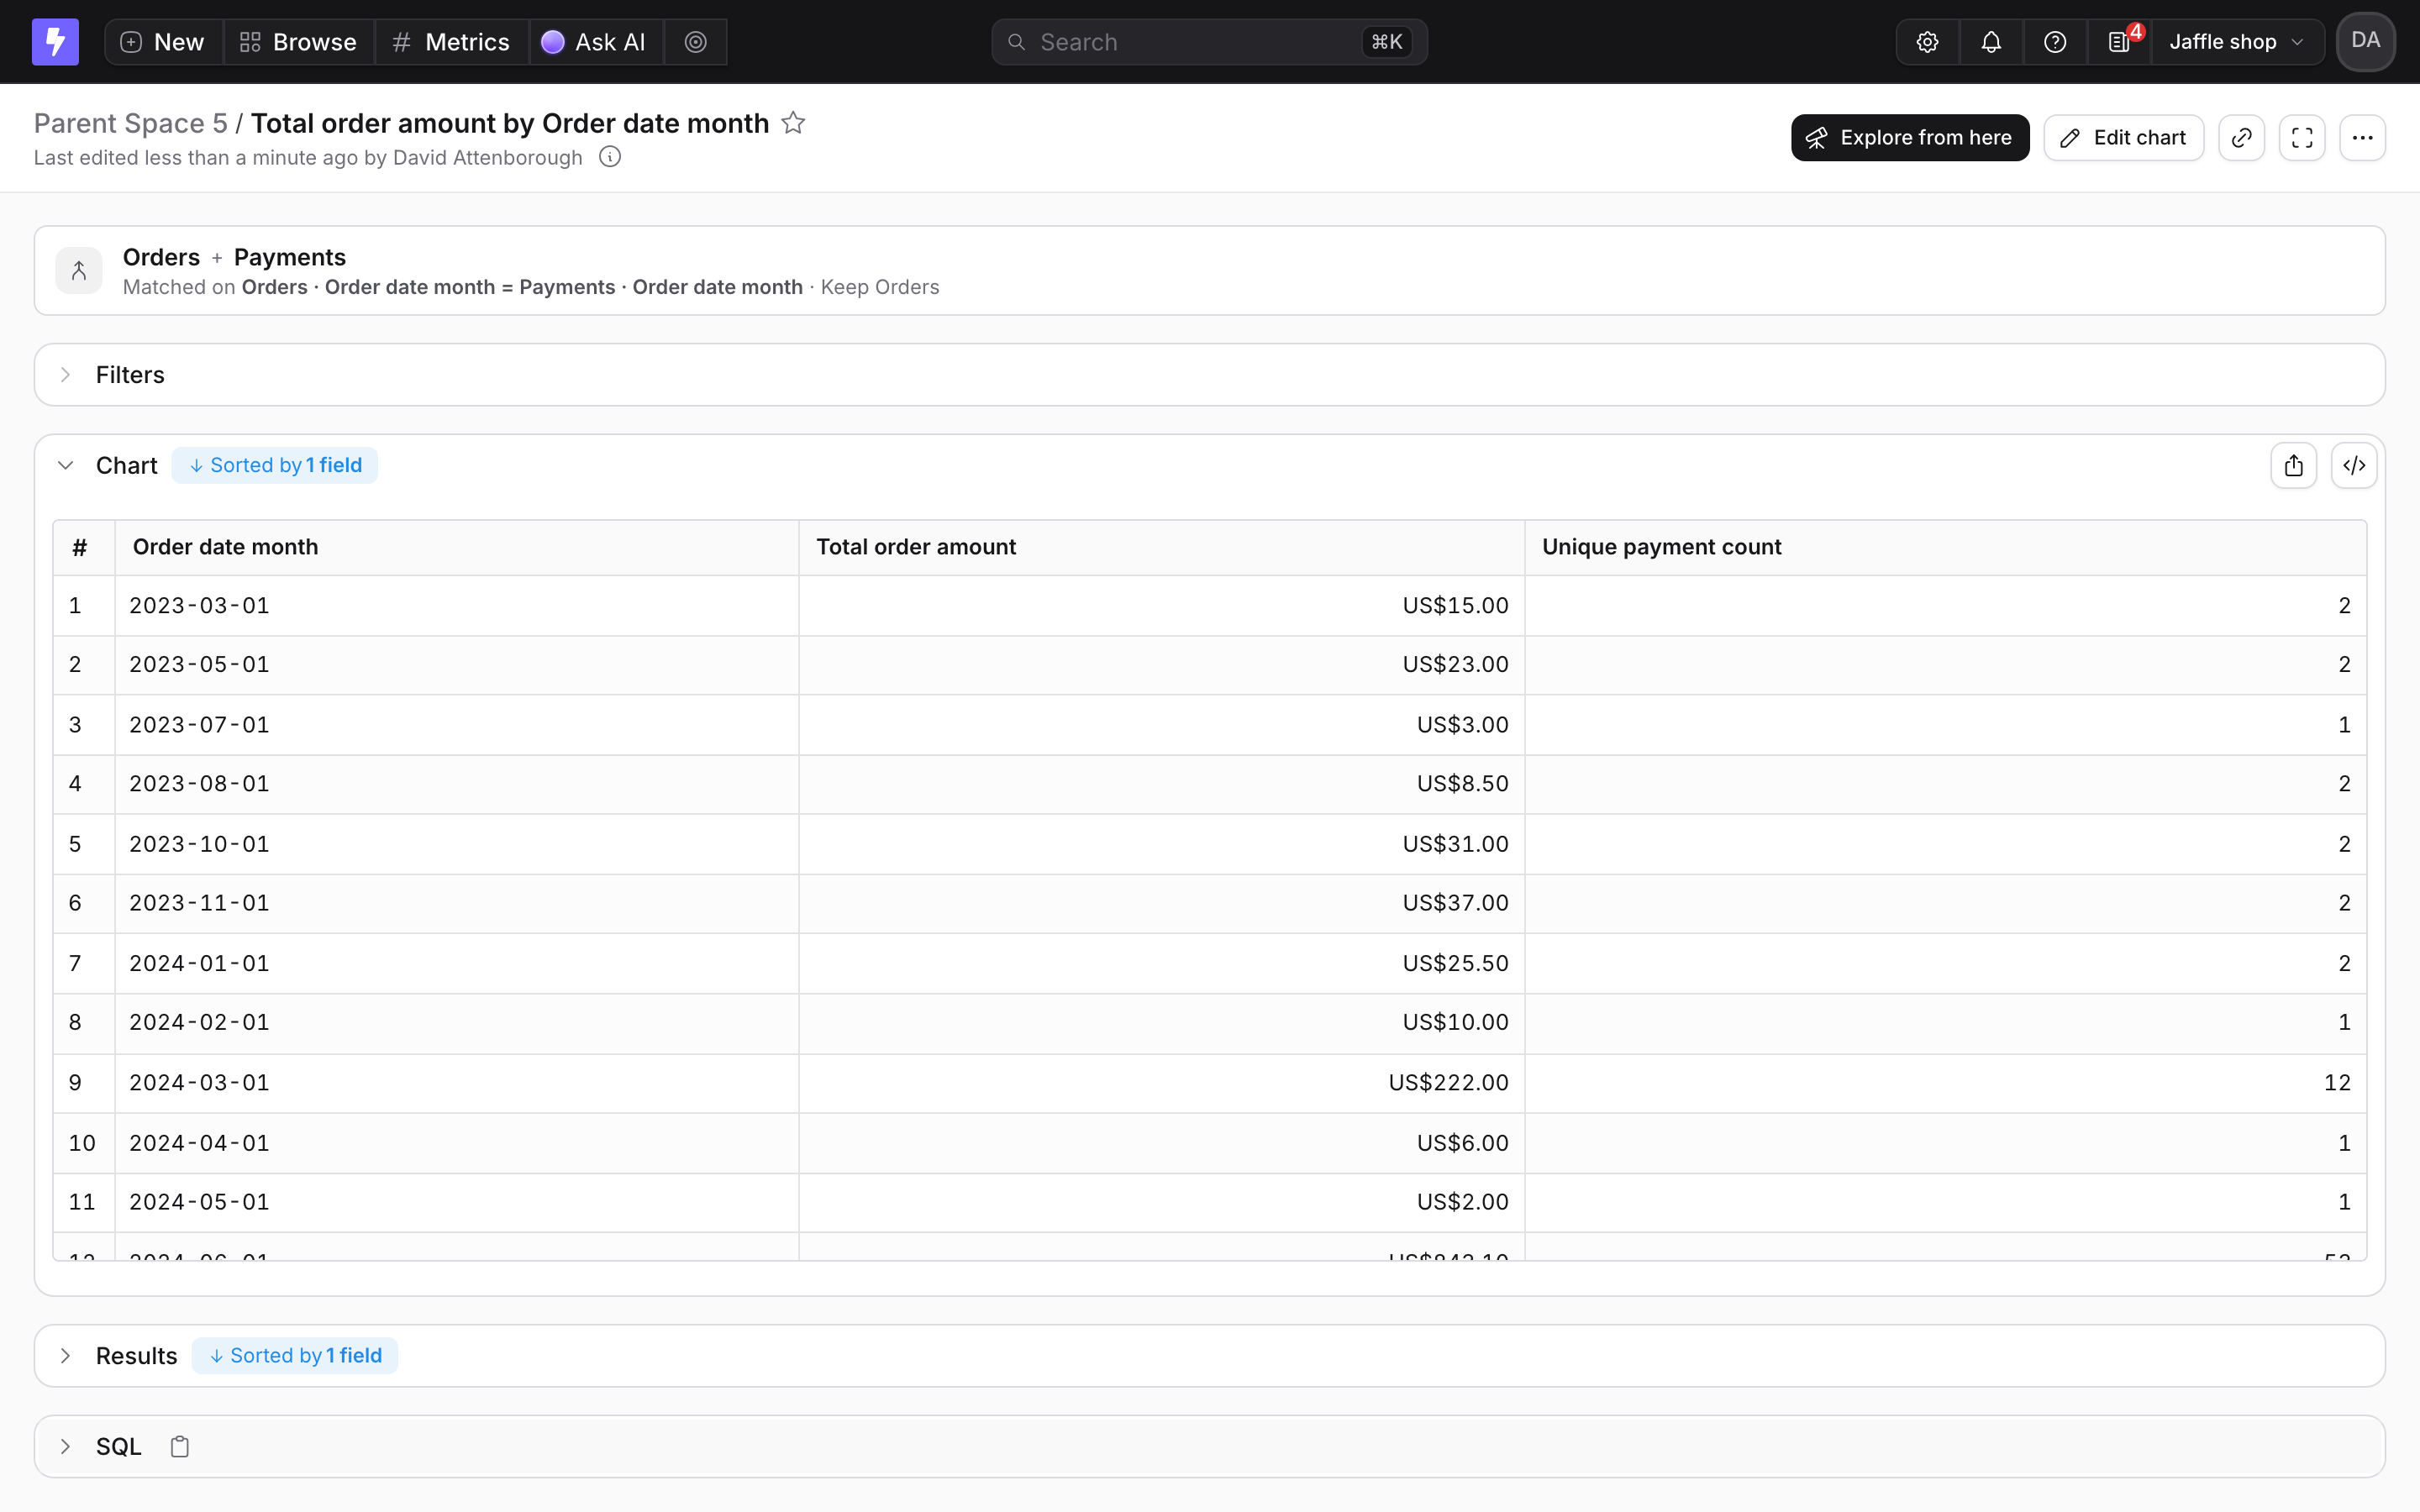
Which join type to choose
The three options answer one question: when a key exists on only one side, what happens to it?How the join stays honest
A merge is only safe when each side has exactly one row per join key. Because an explore query groups by its dimensions, that comes down to one rule: every dimension you select on a side must be a join key. Metrics are already one value per key, so any number of them is fine. When a selection breaks the rule, the query refuses with a message rather than multiplying rows. Either add that dimension as another join condition on both sides, or remove it. For example, reviews byproduct merged with returns by product, joined on product, works. Reviews by product and month merged with returns by product, joined on product only, refuses, because the review side has many rows per product. Add month to both sides and to the join conditions and it works again.