Layout
This is where you can pick the columns from your results table that you want to plot on your x and y axes or that you want to group by. You can group by up to 3 fields in your chart. For bar charts, this is also where you have the option to stack your bars, or leave them unstacked (grouped).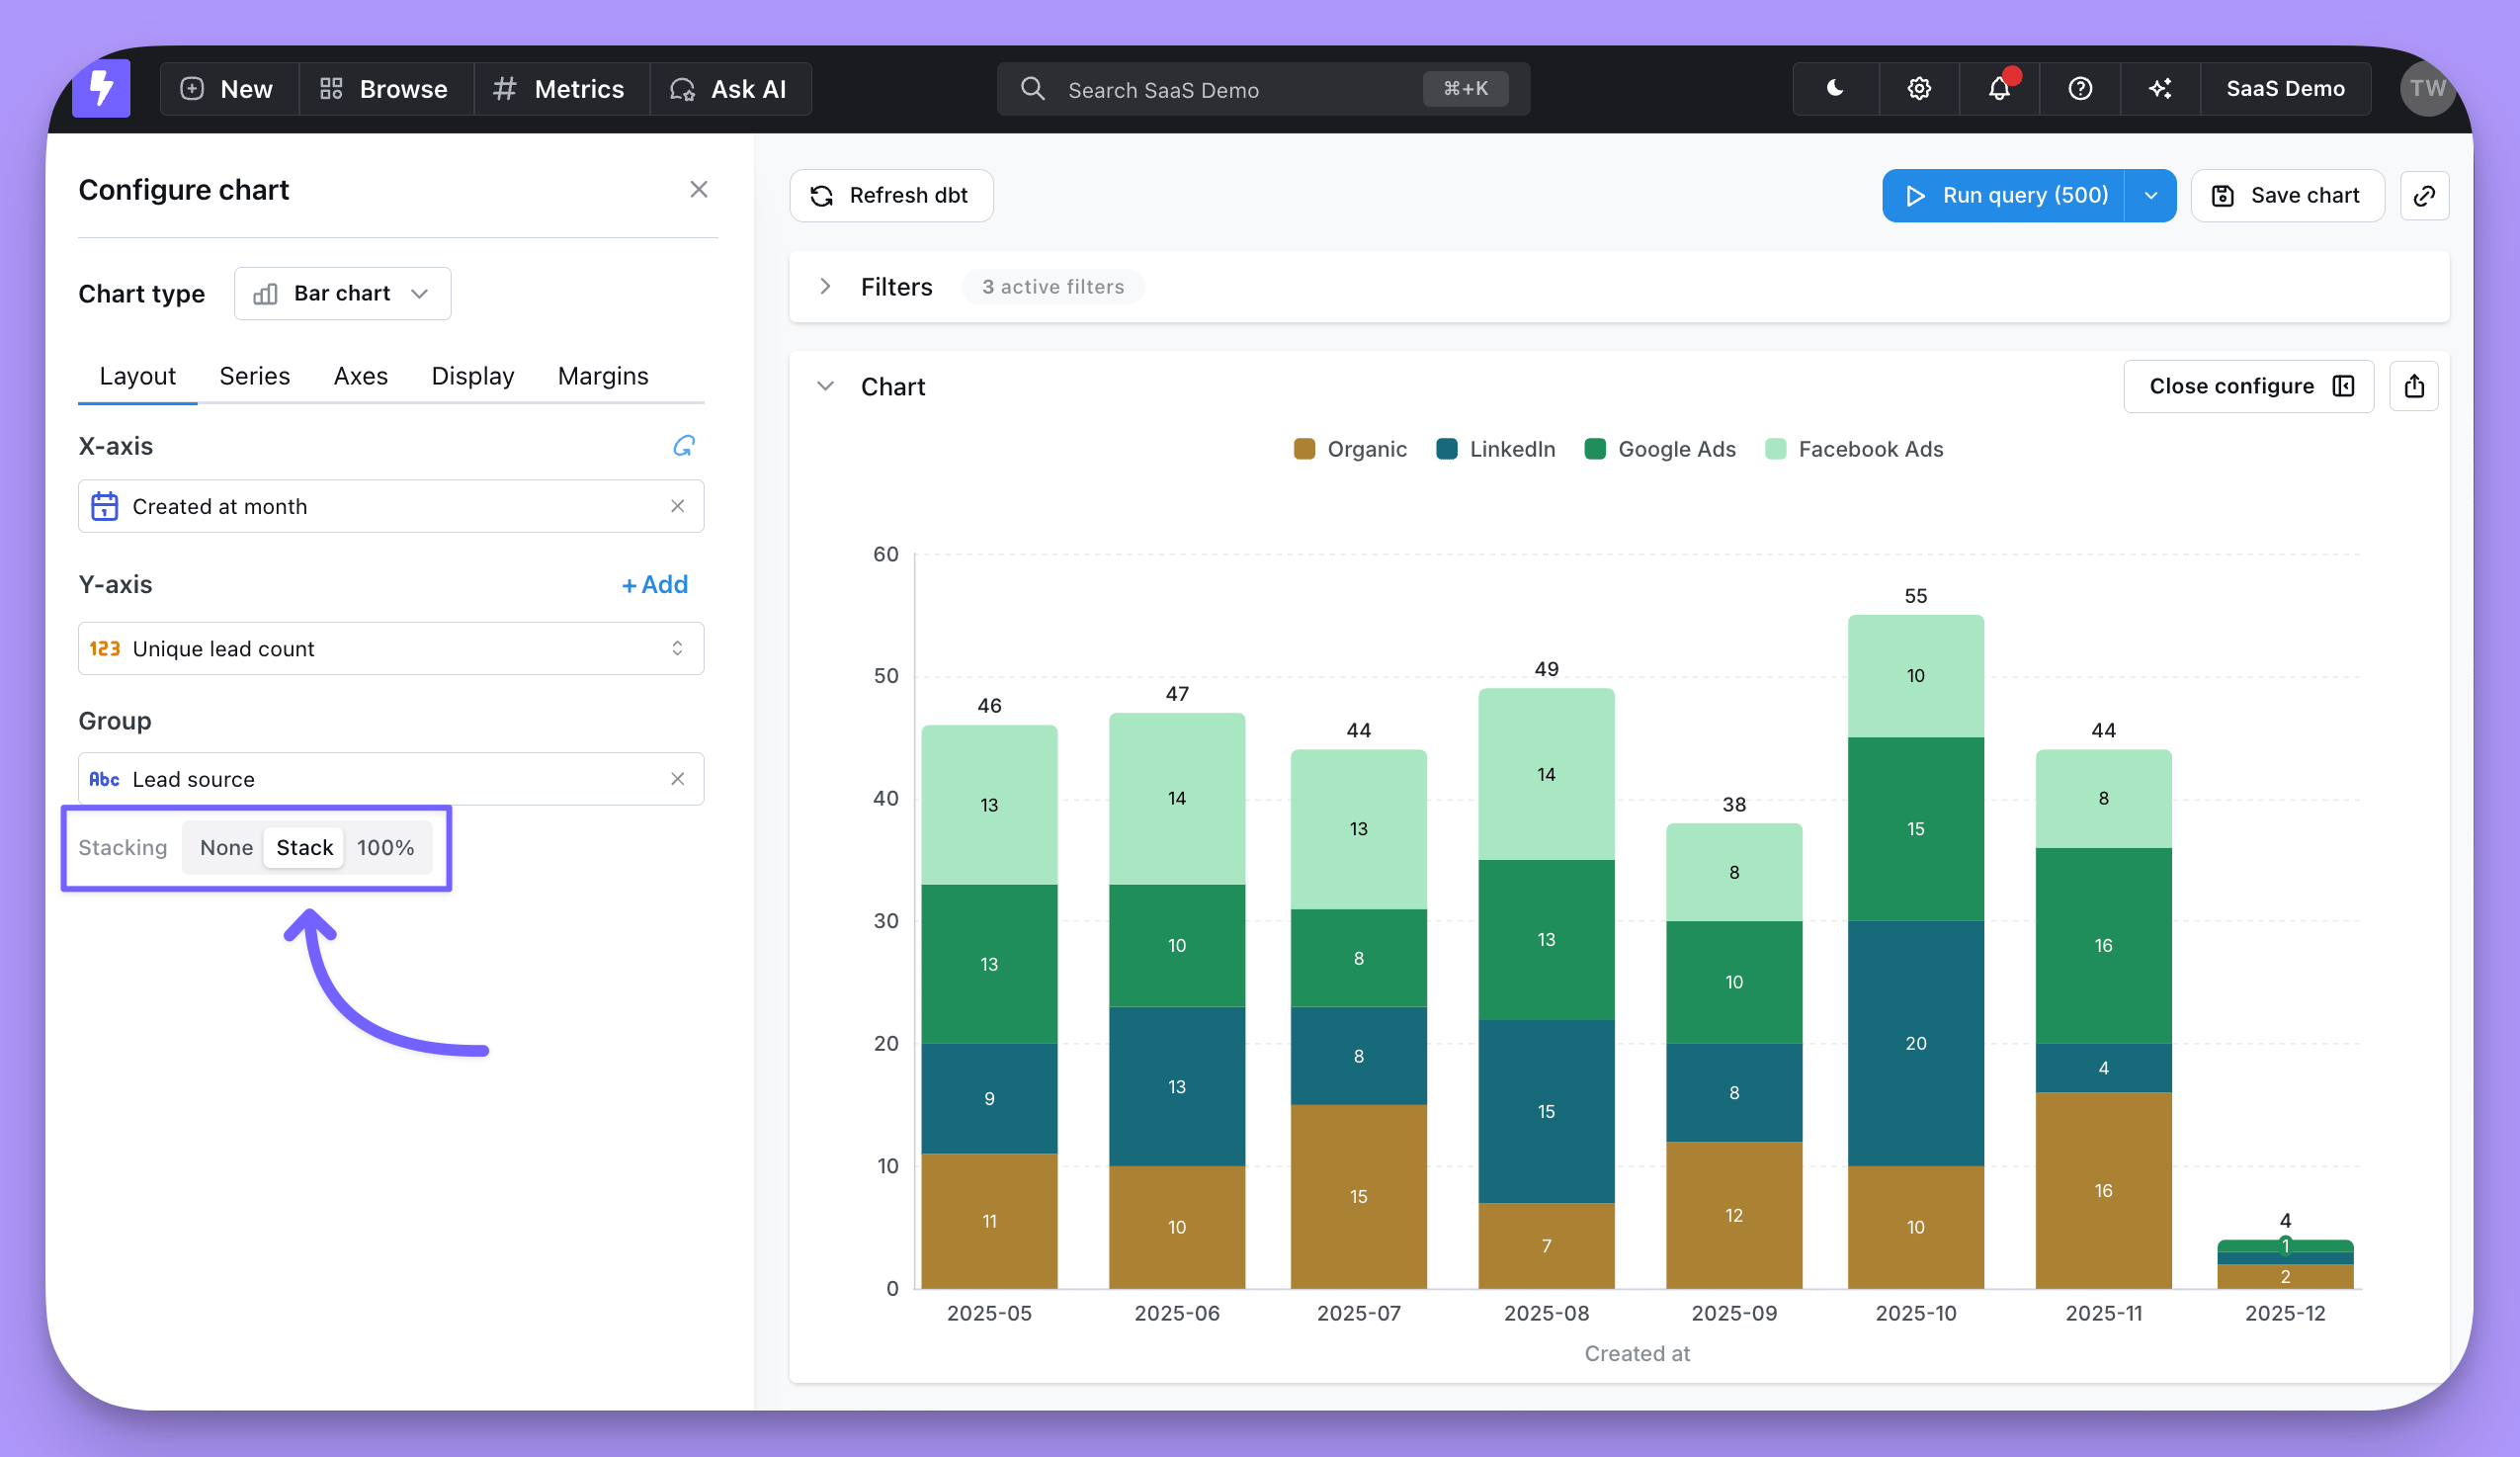
Series
The series tab is where you can adjust how your chart shows each data series. A data series is a set of related data points plotted on a chart. For example, the number of new users created each day over a set of dates is a series. In a bar chart, a series is represented by bars of the same color; in a line chart, a series is represented by a single line. You can see a list of the series for your chart in the Series menu, and on the chart legend.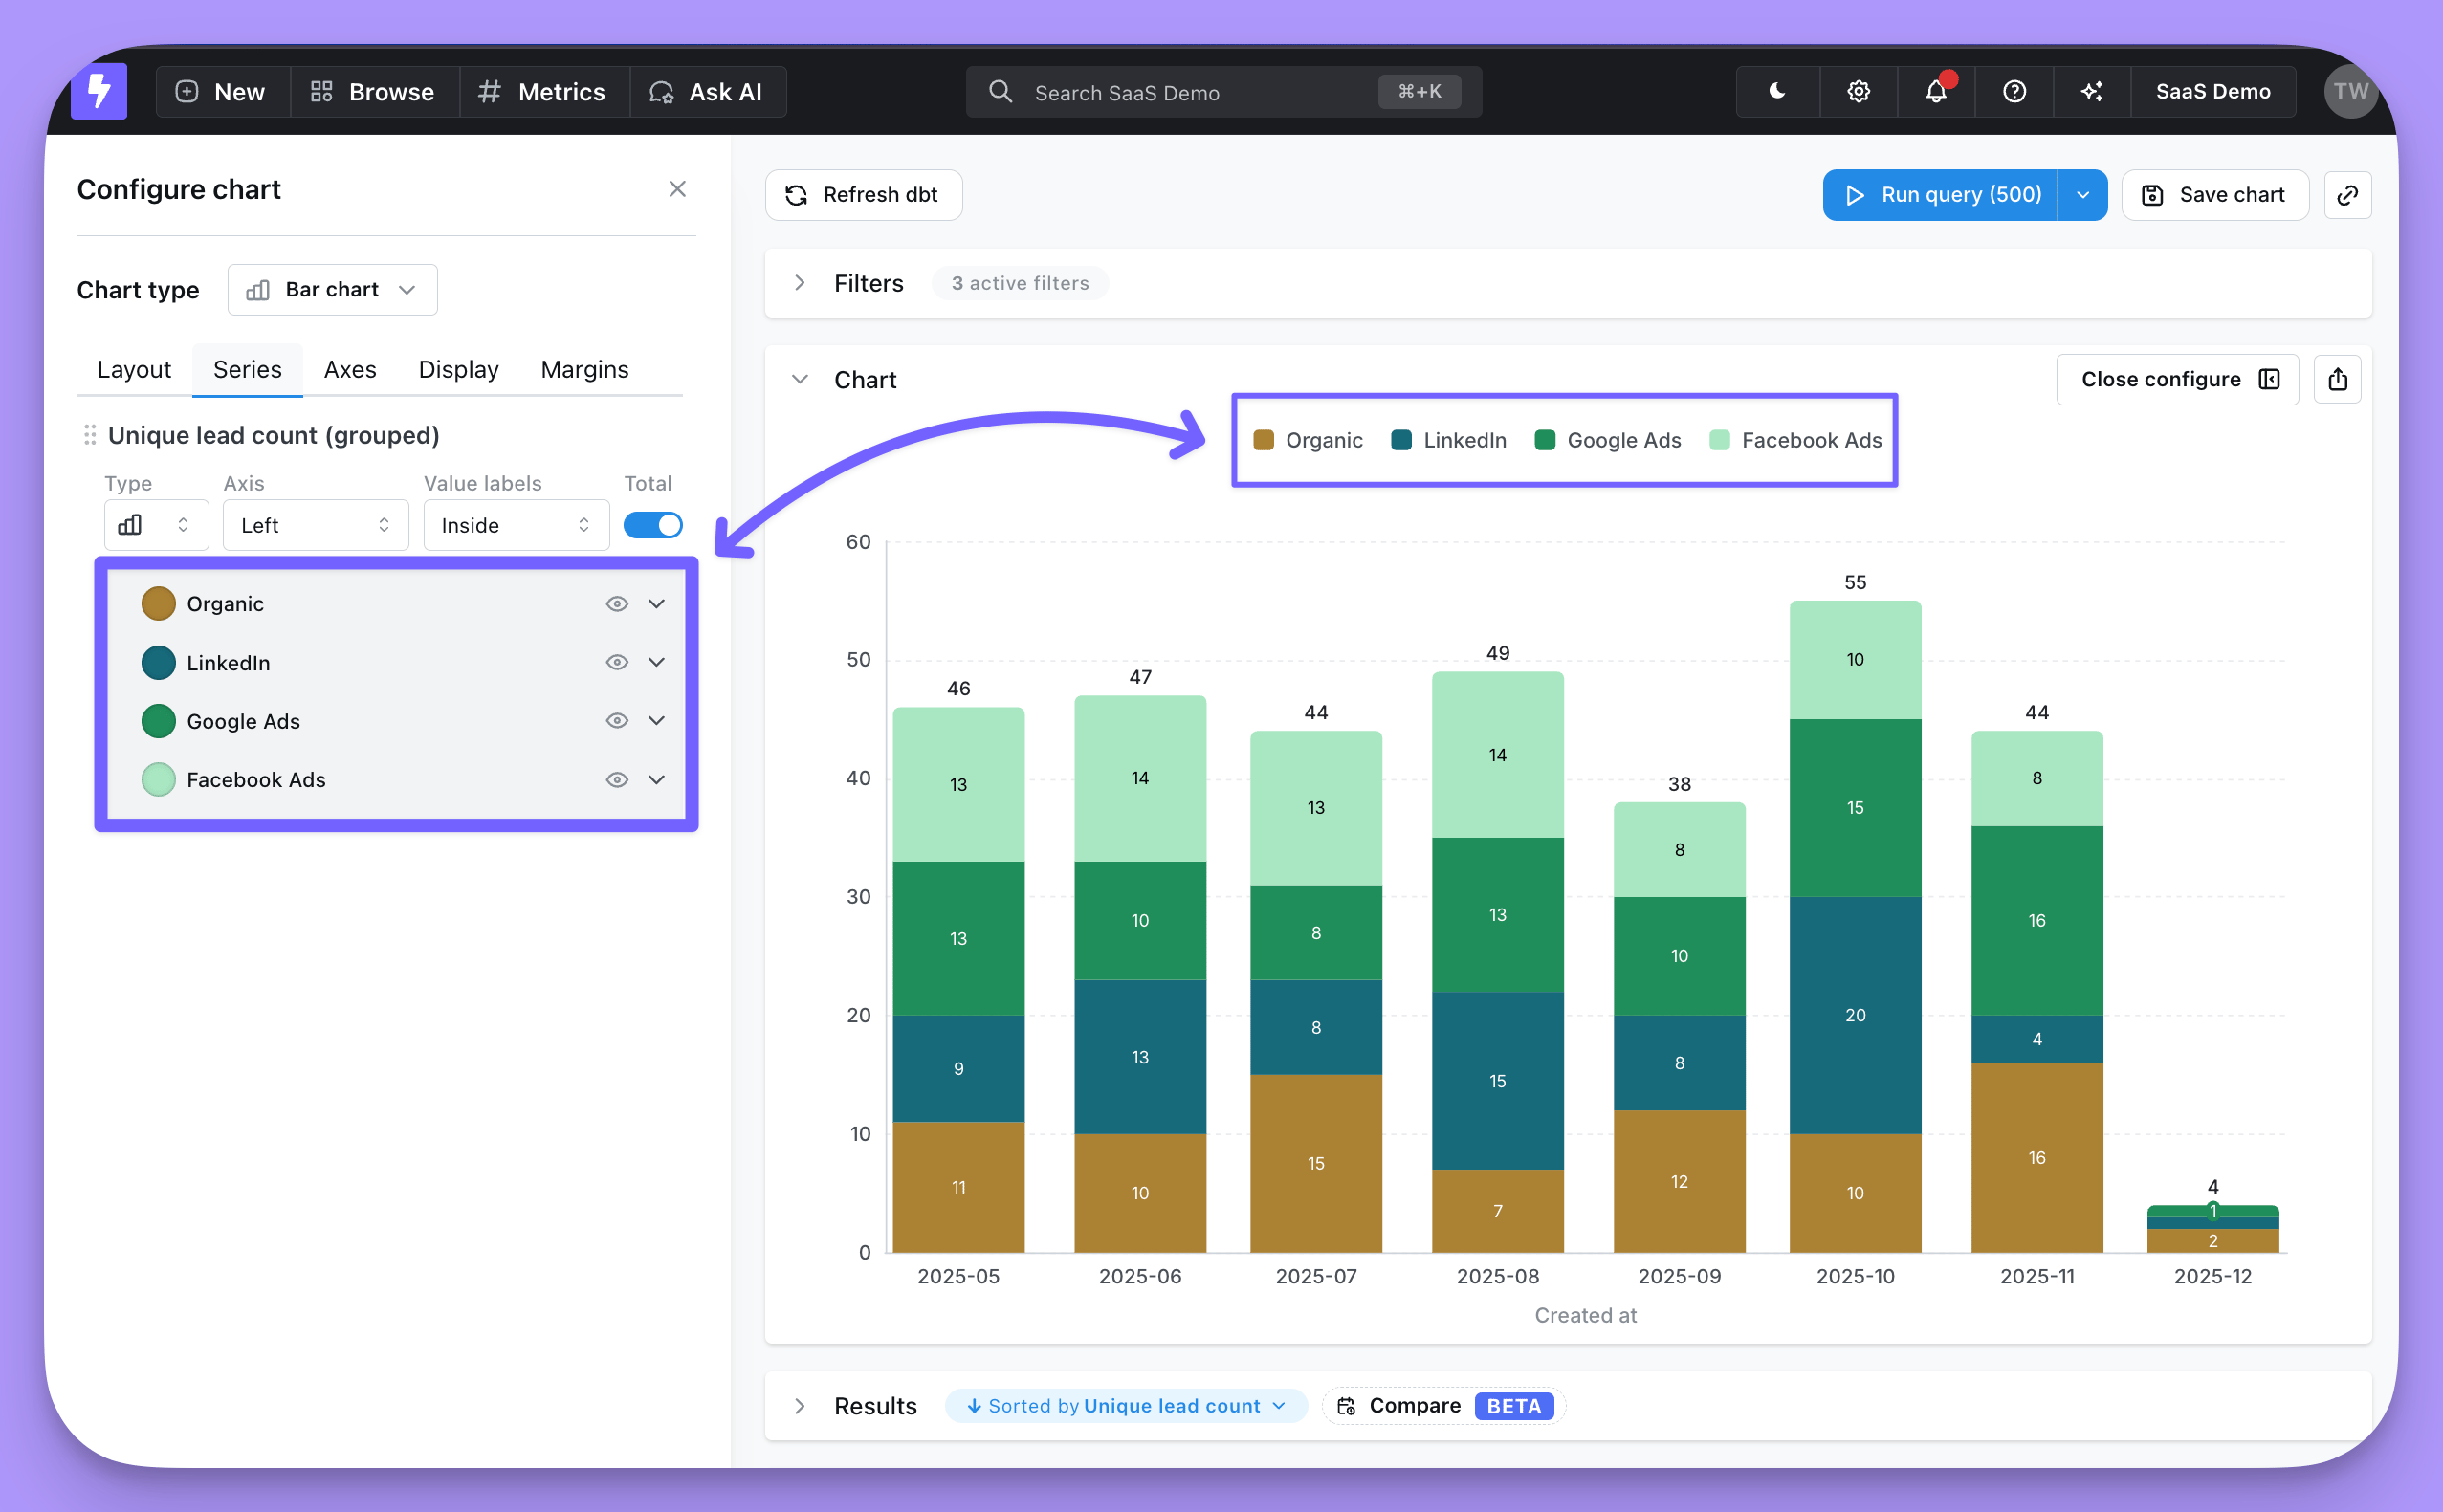
- Set the chart type for each series
- Change series labels or colors
- Put series on a left or right y-axis
- Show value labels or group totals on data points
- Hide a series from your chart
- Mark the chart’s current, unfinished period so it isn’t mistaken for a drop
Incomplete periods
When the x-axis is a truncated date or time dimension — year, quarter, month, week, day, hour, or minute — and the chart’s results include the period that hasn’t finished yet (for example, the current week, before the week is over), the Series tab shows an Incomplete periods section with an Indicate incomplete periods checkbox. Turn it on to mark that period so a partial period isn’t misread as a drop: line and area series draw it with a dashed line, and bar series fill it with a hatched pattern instead of a solid color. New charts have this on by default, whether you create them in the UI, through the API, from chart-as-code, or with an agent. A chart you already saved keeps its stored setting instead of picking up that default, so tick Indicate incomplete periods to turn it on for an existing chart.Series order
The Series tab lists series in draw order, from Back to Front: a series lower in the list is drawn on top of the ones above it. On a stacked chart, the first series sits at the bottom of each stack. Drag a series by its handle to move it, and expand a group to drag the series inside it. With more than one y-axis field, hover a field and select Bring to front to move it to the end, or select Reverse to flip the order. Save the chart to keep the order. When the results are sorted by the Group field or by a y-axis field, the series follow that sort and can’t be dragged. To put the group with the largest values at the bottom of each stack, sort the results by the metric, descending.Value label position
Use the Value labels dropdown on a series to choose where its labels sit: Hidden, Top, Bottom, Left, Right, or Inside. Hidden turns the labels off. The position is set per series, so different series on the same chart can use different positions. For a grouped series, the dropdown on the group sets every series in it, and shows Mixed when the series in the group use different positions. Expand the group to set the position of one series.Value label colors
When you show value labels on bar, line, area, or pie charts, Lightdash chooses a label color automatically:- Labels on lines and areas, labels outside bars, and labels outside pie slices use the series or slice color.
- Labels inside bars and pie slices use black or white, depending on which has better contrast with the fill color.
Value label content
Once a series shows value labels, select the gear icon next to its Value labels to choose what each label shows: Show value (on by default), Show label, and Show metric name. Show label adds the series name, or the group value on a grouped chart, and Show metric name adds the metric name in parentheses. Labels always use the formatName (Metric): Value, for example Outdoor (Revenue): 1,200. You can’t change the separator or the order of the parts.
Stack totals
On a stacked bar chart with a Group field, turn on Total under the group’s Value labels to show each stack’s total above it. To show only the totals, set the group’s Value labels to Hidden and leave Total on. The Total switch only appears for a metric split by a group, so a stack built from several metrics without a group doesn’t have it. In chart-as-code YAML, Total setsstackLabel.show on every series in the group:
Custom colors (conditional formatting)
On bar charts, toggle Apply custom colors in the Series tab to recolor bars based on rules you define. Each rule targets a specific metric via the Target metric picker and only recolors that metric’s bars — other metrics keep their default colors, even where their values match the same condition. For example, on a chart withrevenue and orders bars grouped by product category, you can add one rule that turns revenue bars red when revenue is below 1000, and a second rule that turns orders bars orange when orders are below 50. Categories where only revenue is below the threshold keep the default color on their orders bar, and vice versa.
When to use it
- Conditional formatting — highlight bars whose value matches a rule (e.g. below target, above threshold). Available on bar charts with one or more metrics, including stacked and 100% stacked bar charts when the stack is built from multiple metrics. Every series on the chart must be a bar; mixed bar/line charts are not supported.
- Color by category — assign a fixed color to each x-axis category. Only available on single-metric, non-stacked bar charts. When both modes are available, use the Category / Conditional formatting toggle at the top of the section to switch between them.
revenue is less than 1000 colors a $900 segment even when it renders at the same height as an $1,100 segment in a different category.
Not yet supported: pivoted (grouped) stacks, and color by category on any stacked layout.
Configuring a rule
- In the Series tab, toggle Apply custom colors on. A new rule opens expanded so its inputs are immediately visible.
- Pick the Target metric the rule applies to. On stacked and 100% stacked charts this target is shared across all rules.
- Add one or more conditions (for example,
revenue is less than 1000) and choose a color. A rule with no condition filled in shows No condition set until you add one. - Add more rules for other metrics or other thresholds as needed.
Axes
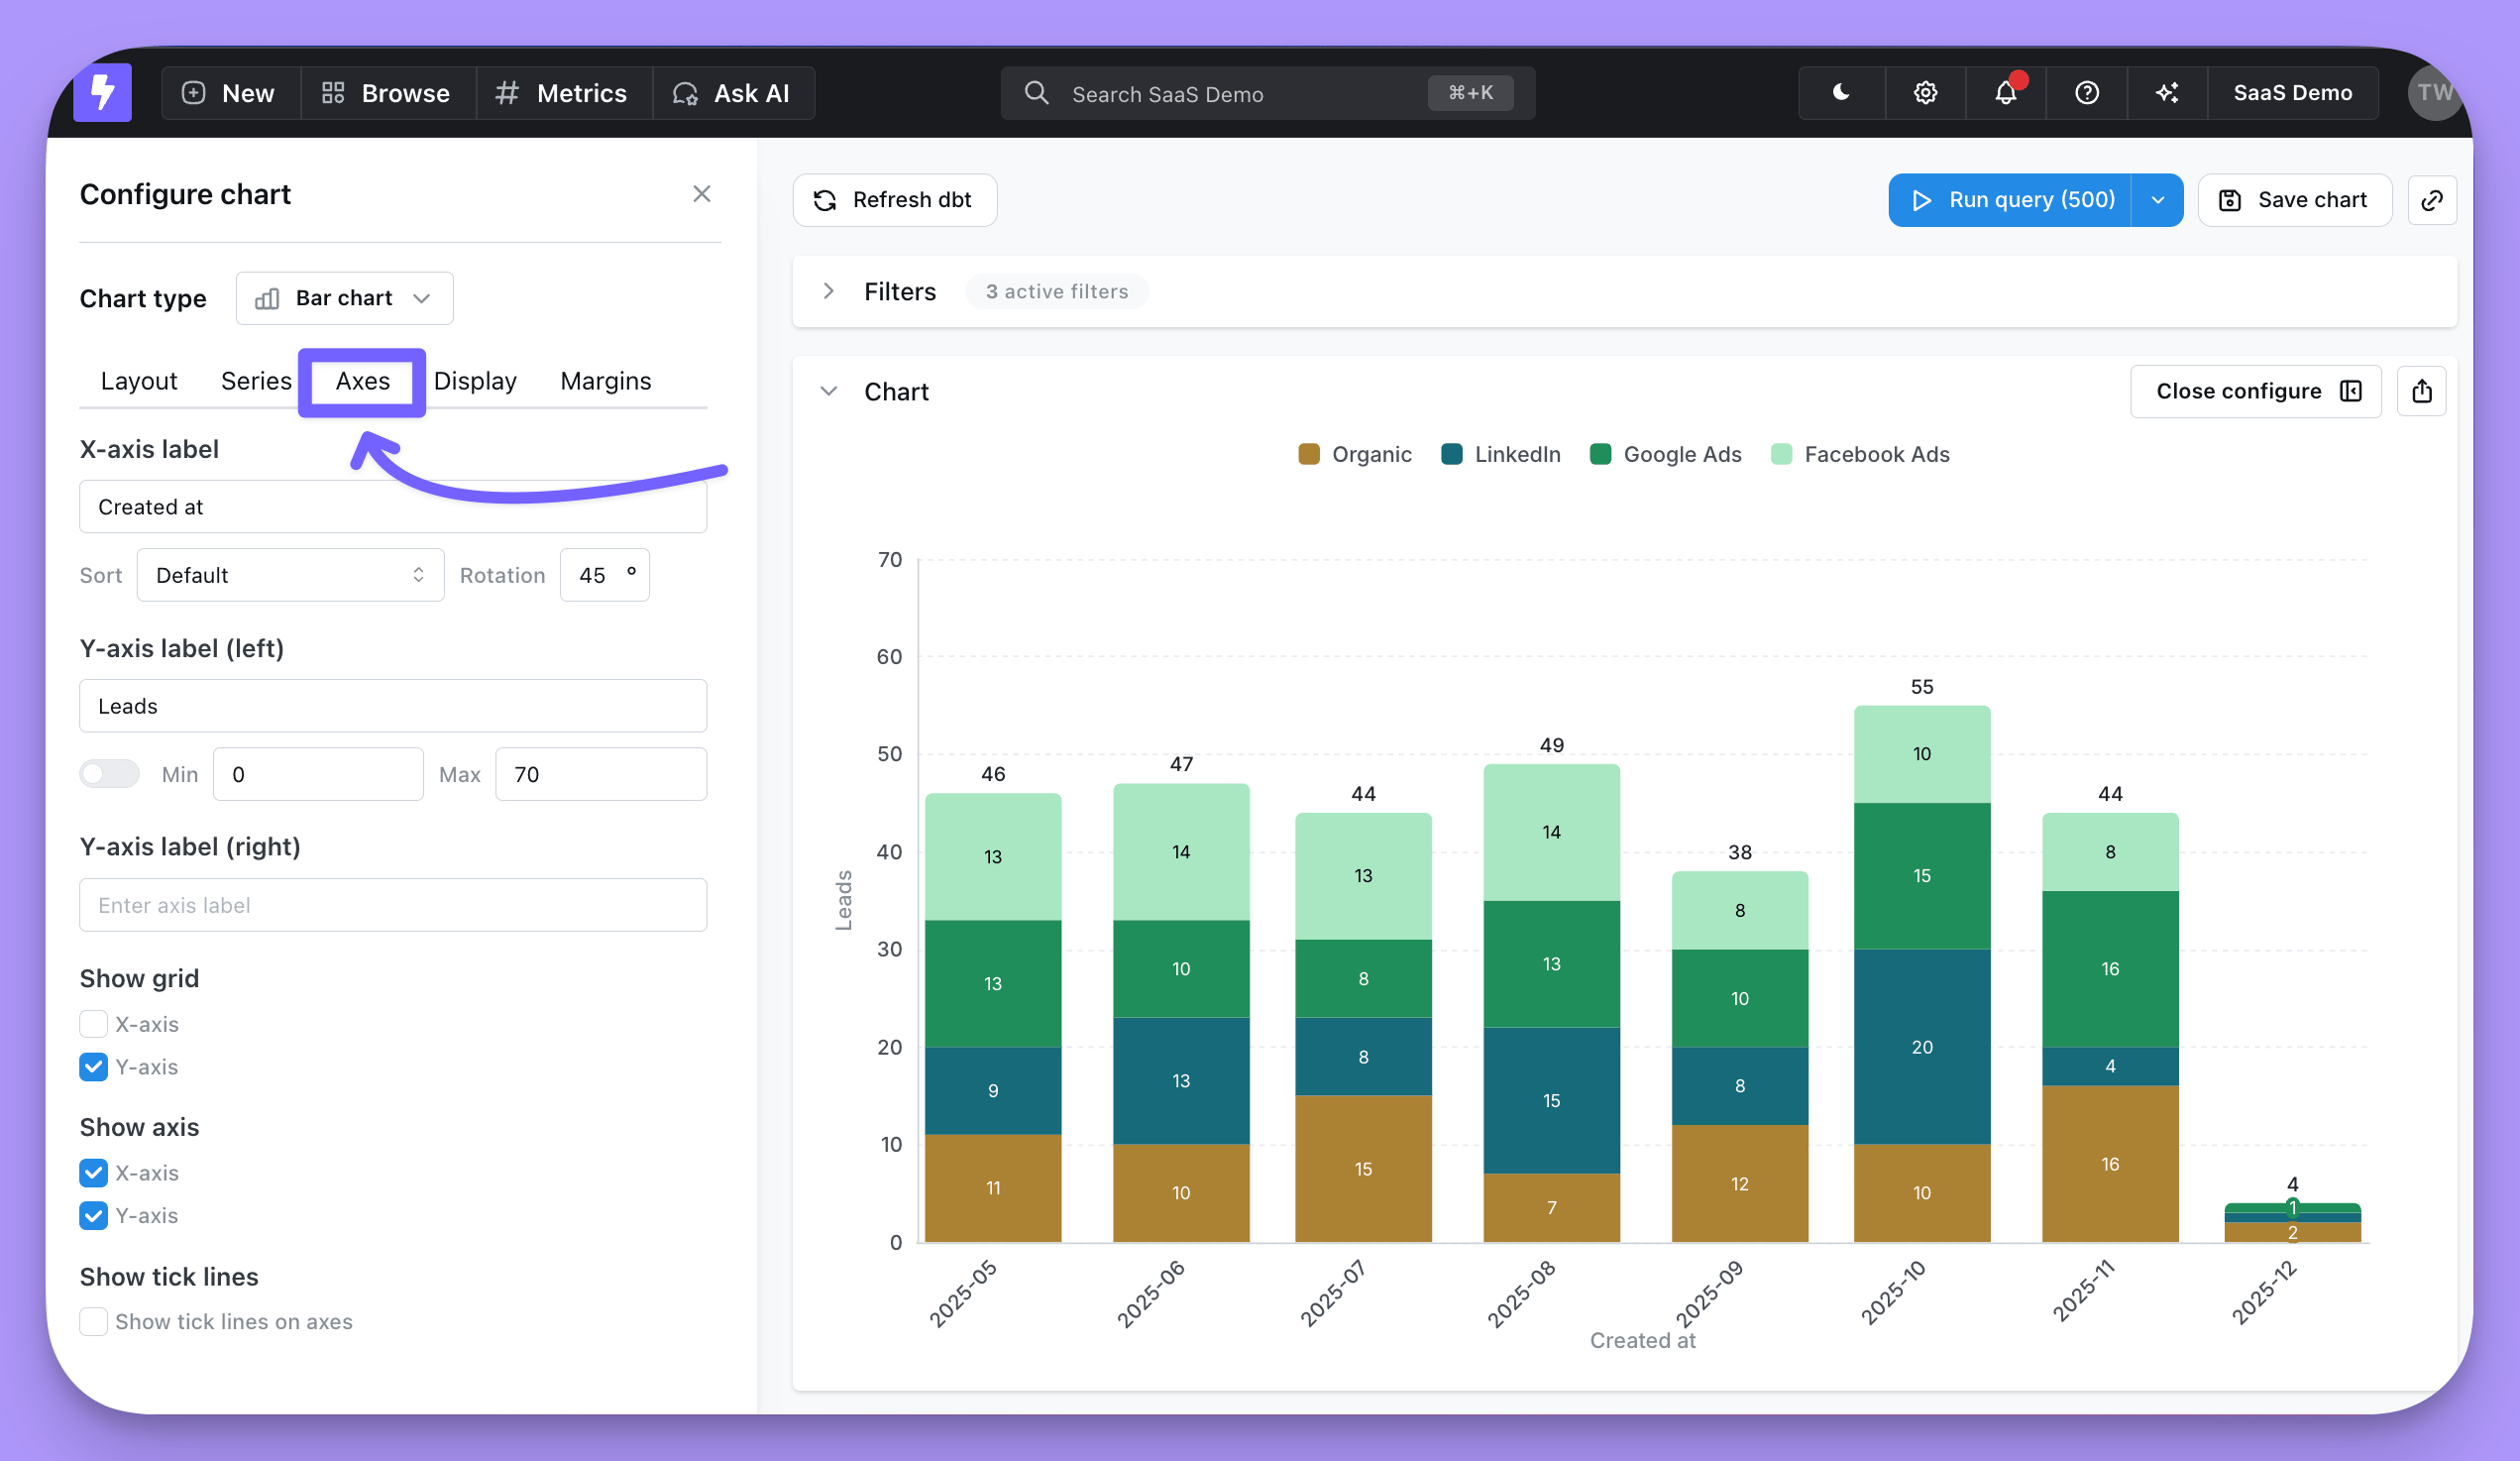
In this section you have options to:- Override the default text for your axes labels
- Adjust sort order of your x-axis
- Space a numeric x-axis evenly with Treat as category
- Rotate x-axis labels
- Set the min and max axis values for your y-axes (or keep the default auto y-axis range)
- Set a minimum tick interval on numeric axes
- Show x-axis and y-axis grid lines
- Hide x-axis completely
- Hide y-axis completely
- Enable a scrollable chart for charts with many x-axis values
X-axis sort
Use Sort under the x-axis label to order the x-axis:- Default uses the order of your query results on a category axis, and the values’ own order on a date or number axis. Default (reversed) flips it.
- Ascending and Descending sort by the x-axis values. On a category axis, values are sorted as text.
- Bars ascending and Bars descending sort by each bar’s total, adding up stacked segments. They’re only available on bar charts with a category x-axis, and only reorder text values.
Treat a numeric x-axis as categories
A number x-axis plots values on a continuous scale, so the bars at either end are centred on the first and last values and can overlap the y-axis. Turn on Treat as category under the x-axis label to space the values evenly, with padding at both ends. While it’s on, the x-axis range and Min tick interval settings don’t apply. The switch only appears when the x-axis is a number field and the axes aren’t flipped.Auto y-axis range
With Auto on, Lightdash doesn’t always zoom the axis in on your data — it only drops 0 as the axis minimum when your lowest value sits far clear of the rest of the data, specifically when the lowest value is more than 3 times the spread between your lowest and highest values. Data that sits closer to 0 relative to its spread keeps 0 as the axis minimum even with Auto on — for example, percentages that range roughly between 30% and 80% still start at 0. The same rule applies to the axis maximum when your values are entirely negative. This behavior applies to left/right y-axes with line, area, or scatter series. An axis with a bar series always starts at 0 when Auto is on, since a bar’s height represents its value. To zoom in on a narrower range than Auto gives you, turn Auto off and set a manual Min and/or Max instead.Min tick interval
Use Min tick interval to force a minimum step between ticks on a numeric axis. This is useful when the auto-scaled ticks show duplicate or decimal labels — for example, a count that only produces the values0, 1, 2 can otherwise render as 0, 0.5, 1, 1.5, 2. Setting the min tick interval to 1 forces integer-only ticks.
The control is available on each numeric axis (left/right y-axis, and top/bottom x-axis for scatter charts). Leave the field blank (or set it to 0) to let Lightdash pick the interval automatically.
Crowded x-axis labels
When there isn’t room for every x-axis label, such as on a daily chart over several months, the chart leaves some labels out so the rest stay readable. Every bar or point is still drawn: hover over one to see its x-axis value in the tooltip.Axis label format
On charts built in the Explore view, axis tick labels use the format of the field on that axis, the same format its values have in tooltips and the results table. There’s no separate format setting for an axis, so compacting a field to show1.5M on the axis also compacts its tooltips and table values.
Charts built in the SQL runner have a Format setting under each y-axis that sets how its tick labels are rendered:
- None — show the raw numeric value.
- Percent — format the value as a percentage.
- SI — apply dynamic compact formatting. Values are automatically scaled and suffixed with
K,M,B, orTbased on their magnitude, so1,500becomes1.50Kand2,300,000becomes2.30Min the same axis.
Reverse a y-axis
To flip a y-axis so the smallest value is at the top, for example to plot rankings with rank 1 at the top, setinverse: true on the axis in chart-as-code YAML. There’s no switch for this in the chart editor. yAxis is a list: the first entry is the left axis and the second is the right axis, and each series moves with the axis its yAxisIndex points to. On a chart with flipped axes, these entries control the bottom and top axes instead.
Referencing the active granularity in axis and series labels
Axis names and series names support a${table_field.granularity} placeholder that resolves to the active date granularity (for example day, week, month) — including the granularity selected via date zoom. This lets a label like Orders per ${orders_order_date.granularity} render as Orders per week when viewers zoom to a weekly granularity.
See Referencing the granularity in chart labels for the full syntax and the complete list of supported labels.
Scrollable chart
For bar, line, and area charts with many x-axis values, turn on Enable scrollable chart to display a fixed-size window of data points that viewers can scroll through, instead of squeezing every value into the chart. When enabled, you can configure:- Initial scroll position — Choose whether the chart opens anchored to the Start (oldest or first values) or End (newest or last values) of the data. Use End for time series where the most recent values matter most.
- Visible items — Set how many x-axis items appear in the window at once (between 2 and 100, default 10).
Display
This tab is where you’re able to control the legend, reference lines, and custom tooltips in your chart.Reference lines
You can add reference lines to your charts to easily visualize goals or thresholds.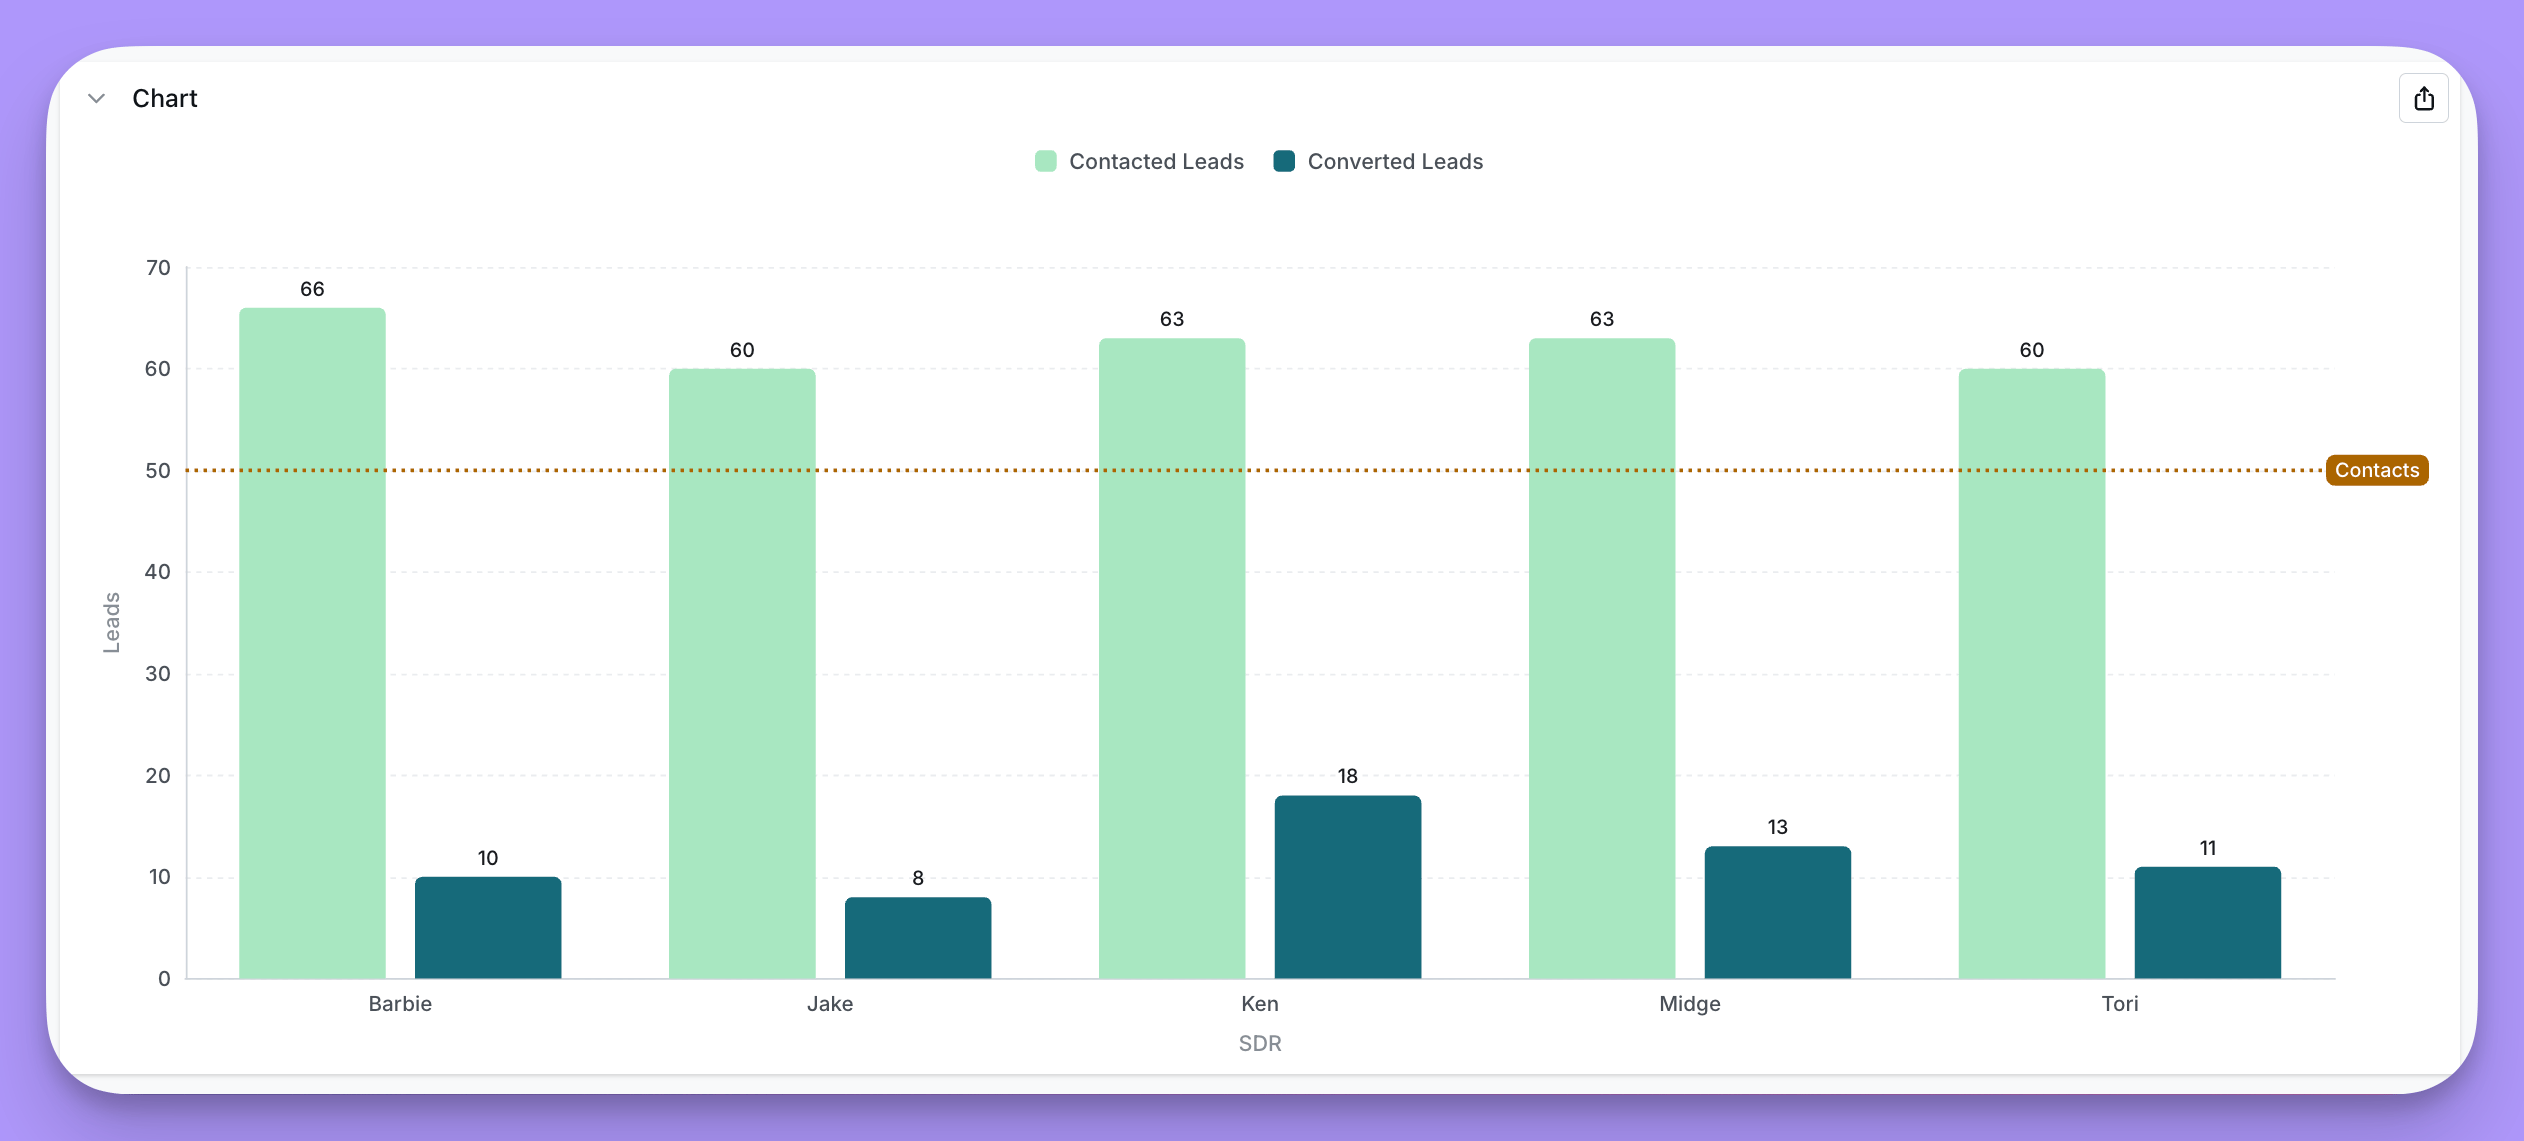
+ Add under Display -> Reference lines.
You have these options in the settings:
- Select a field you want to linke to your reference line (Page views in the image above)
- Set a static value (50,000 in the image above)
- Add a label (
Halfway to our goal!in the image above) - Change the line color (green in the image above)
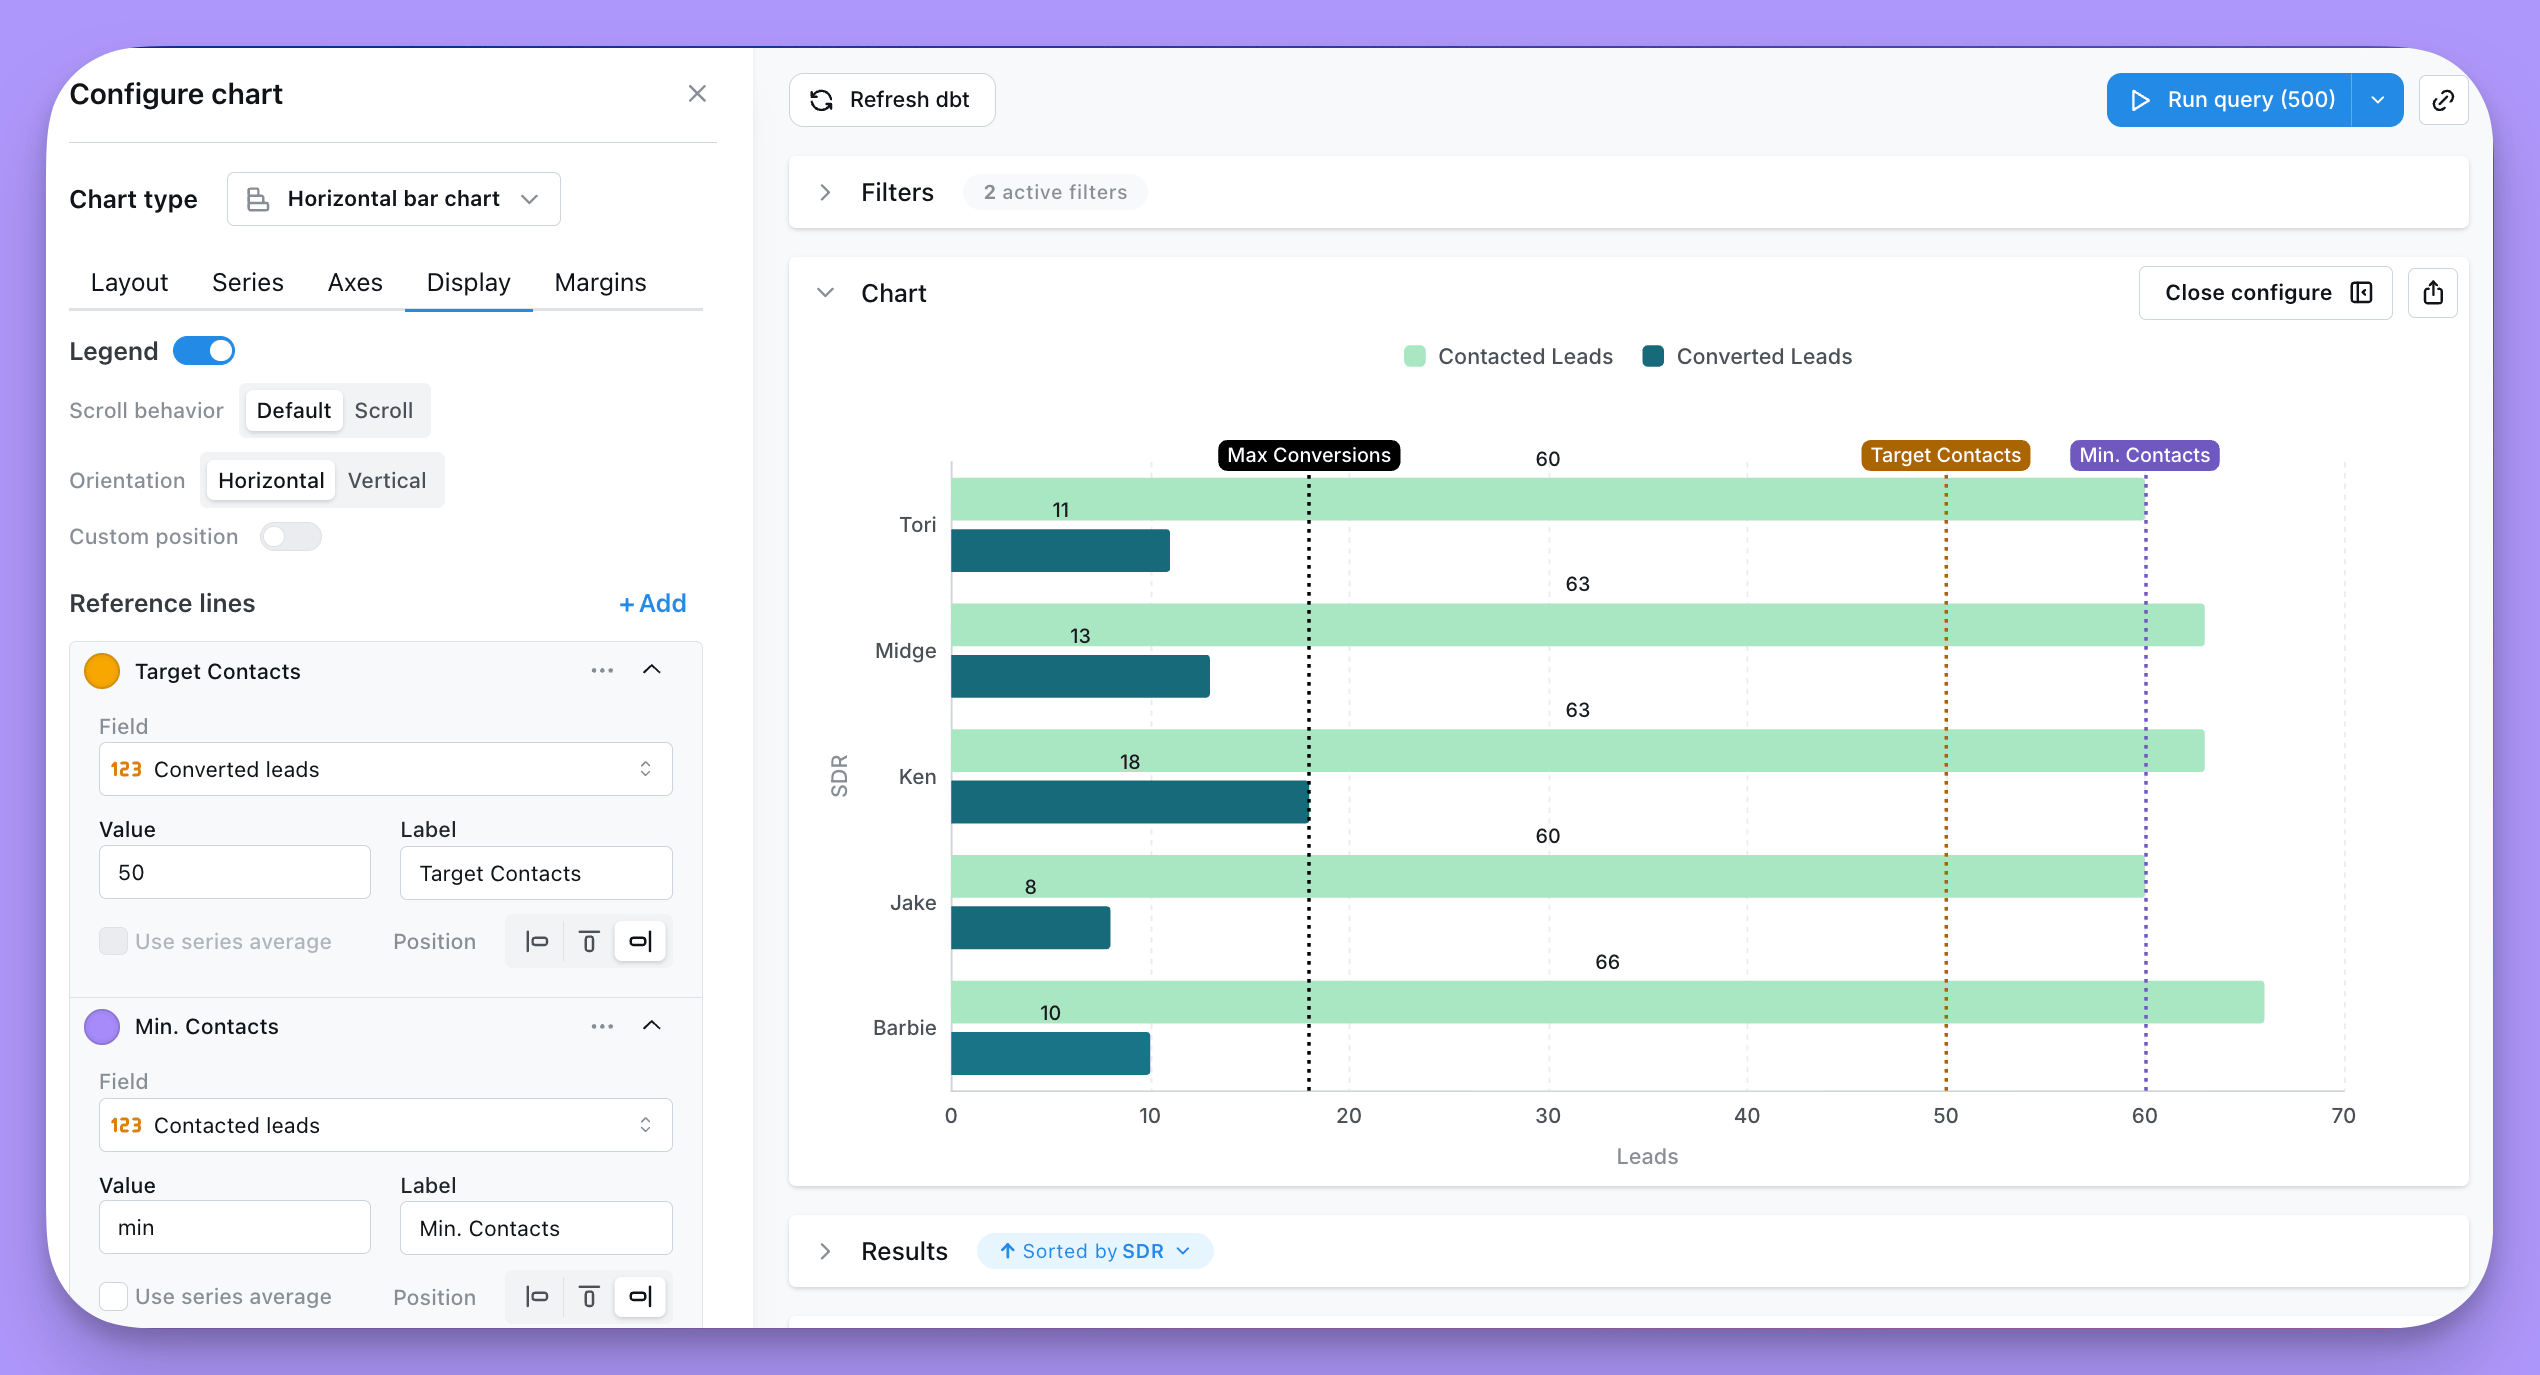
min, max, median, average.
That way your reference line will automatically update to the global min, max, median, or average of the field you selected. See image below for examples.
Legend
You can add and adjust the legend in your chart to help people understand what data’s been plotted.- Show or hide the legend
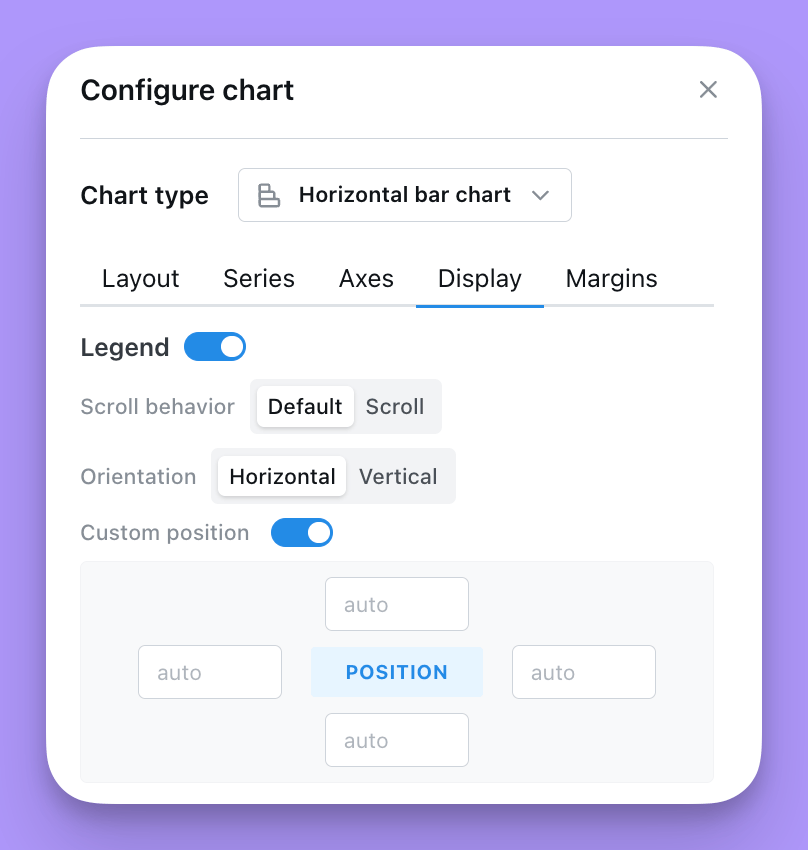
- Choose a Placement for the legend:
- Chart area overlays the legend on top of the plot. You can fine-tune its
position, scroll behavior, and orientation (see below). - Outside right or Outside left renders the legend beside the plot and reserves space in the chart grid so the legend never overlaps your data. When you pick an outside placement, set the Legend area width (in
%orpx) to control how much horizontal space is reserved for the legend.
- Chart area overlays the legend on top of the plot. You can fine-tune its
- When Placement is set to Chart area:
- Adjust the position of the legend on your chart. The values in
positionare the coordinates of the legend on your chart. They can either be numbers or percent. We suggest using %. - If you want the position to be in the bottom right, you would set: Right = 0%, Bottom = 0%. For the legend to be in the middle of the chart, you’d set: Top = 50%, Left = 50%.
- Set your legend to scroll (if you have so many groups that they overlap your chart).
- Orient the values in your legend to form a list vertically, or horizontally.
- Adjust the position of the legend on your chart. The values in
[group] Field name. For example, two metrics grouped by four statuses give eight entries. There’s no option to collapse the legend to one entry per group. To get one, plot a single y-axis field with the group, or build the chart as a custom chart type in Chart Studio.
Saving the default legend selection
On cartesian charts (bar, line, area, scatter, mixed), the legend entries you toggle off in the chart editor are saved with the chart. When someone opens the chart again — in the explore view, a saved chart, or a dashboard — the same series start greyed out. Disabled series stay listed in the legend so viewers can still click them back on for their session; those ephemeral toggles are not written back to the saved chart. To change the default:- Open the chart in the editor.
- Click legend entries to disable or re-enable series. For example, on a chart pivoted by
product_category, click Apparel and Home Goods in the legend to focus on Electronics. - Click Save. The next time anyone opens the chart, only Electronics is plotted, with Apparel and Home Goods greyed out in the legend.
eChartsConfig.legend.selected. It’s an optional map from legend entry name to boolean, and only entries set to false are stored — series that don’t appear in the map default to visible, so new series (for example a new quarter added to a pivoted chart) show up automatically. Re-enabling every series in the editor and saving removes the selected field entirely.
Data
The Data and Column limit sections at the bottom of the Layout tab let you trim what gets shown on the chart without changing the underlying query. Both controls run client-side on the already-fetched results, so totals, exports and underlying data are unaffected.Limit displayed rows
Toggle Limit displayed rows to show or hide a slice of rows from the top or bottom of your results.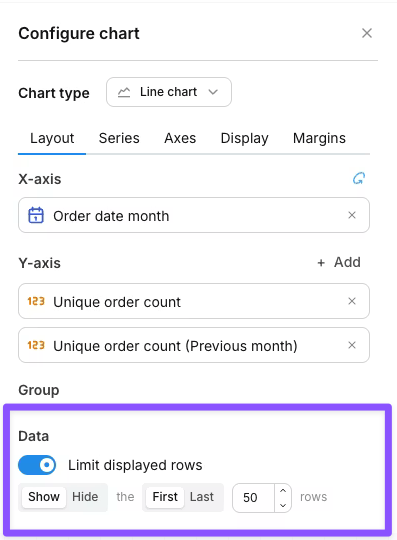
- Show / Hide — keep only the targeted rows, or remove them.
- First / Last — anchor to the top or bottom of the results.
- N — how many rows to target (default 50).
The row limit only affects what’s drawn on the chart. Your query still returns the full result set, totals are calculated against all rows, and CSV exports include every row.
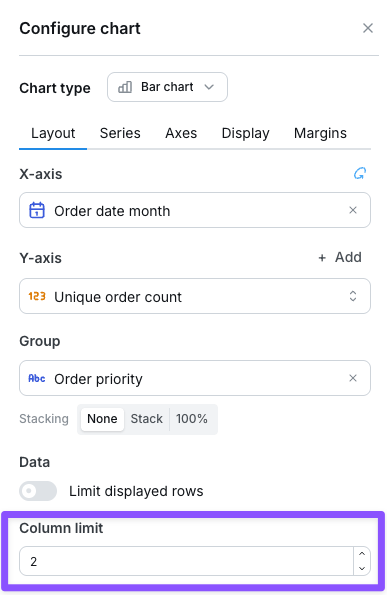
Column limit
When your chart has a pivot dimension, the Column limit controls how many pivot groups (and therefore series) are drawn. Lightdash keeps the first N pivot groups in display order and drops the rest. Dropped groups aren’t combined into an “other” series. Enter a whole number from 1 to 200. To keep the groups with the largest values, sort the results by the metric, descending. The limit is saved with the chart, ascolumnLimit under chartConfig.config in chart-as-code YAML.
Margins
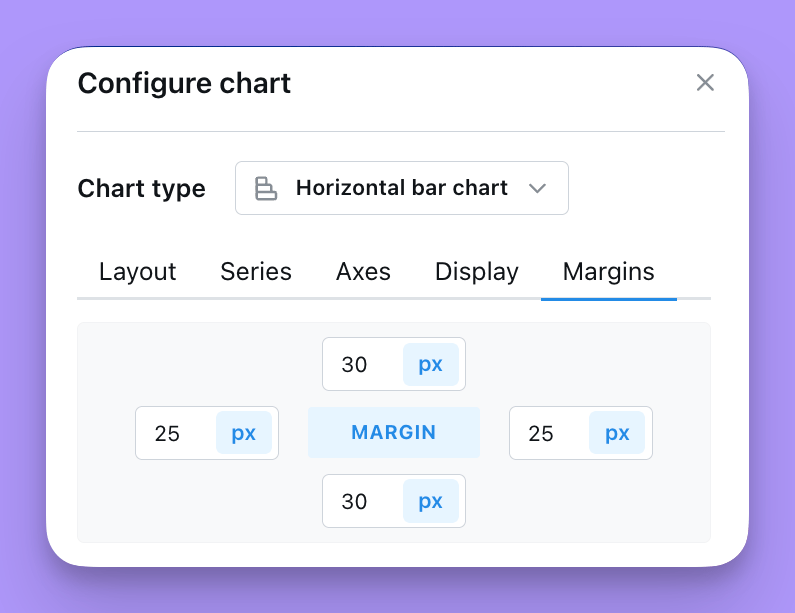
The Margin tab is where you’re able to add or remove margin around the grid. Removing margin means that your chart will fill more of the space in the chart tab. Adding margin will shrink your chart into a smaller space. You can either add numbers (e.g. 50) or percent values (e.g. 50%) to the margin settings listed. The default margin is set totop = 70, bottom = 30, left = 5%, right = 5%