

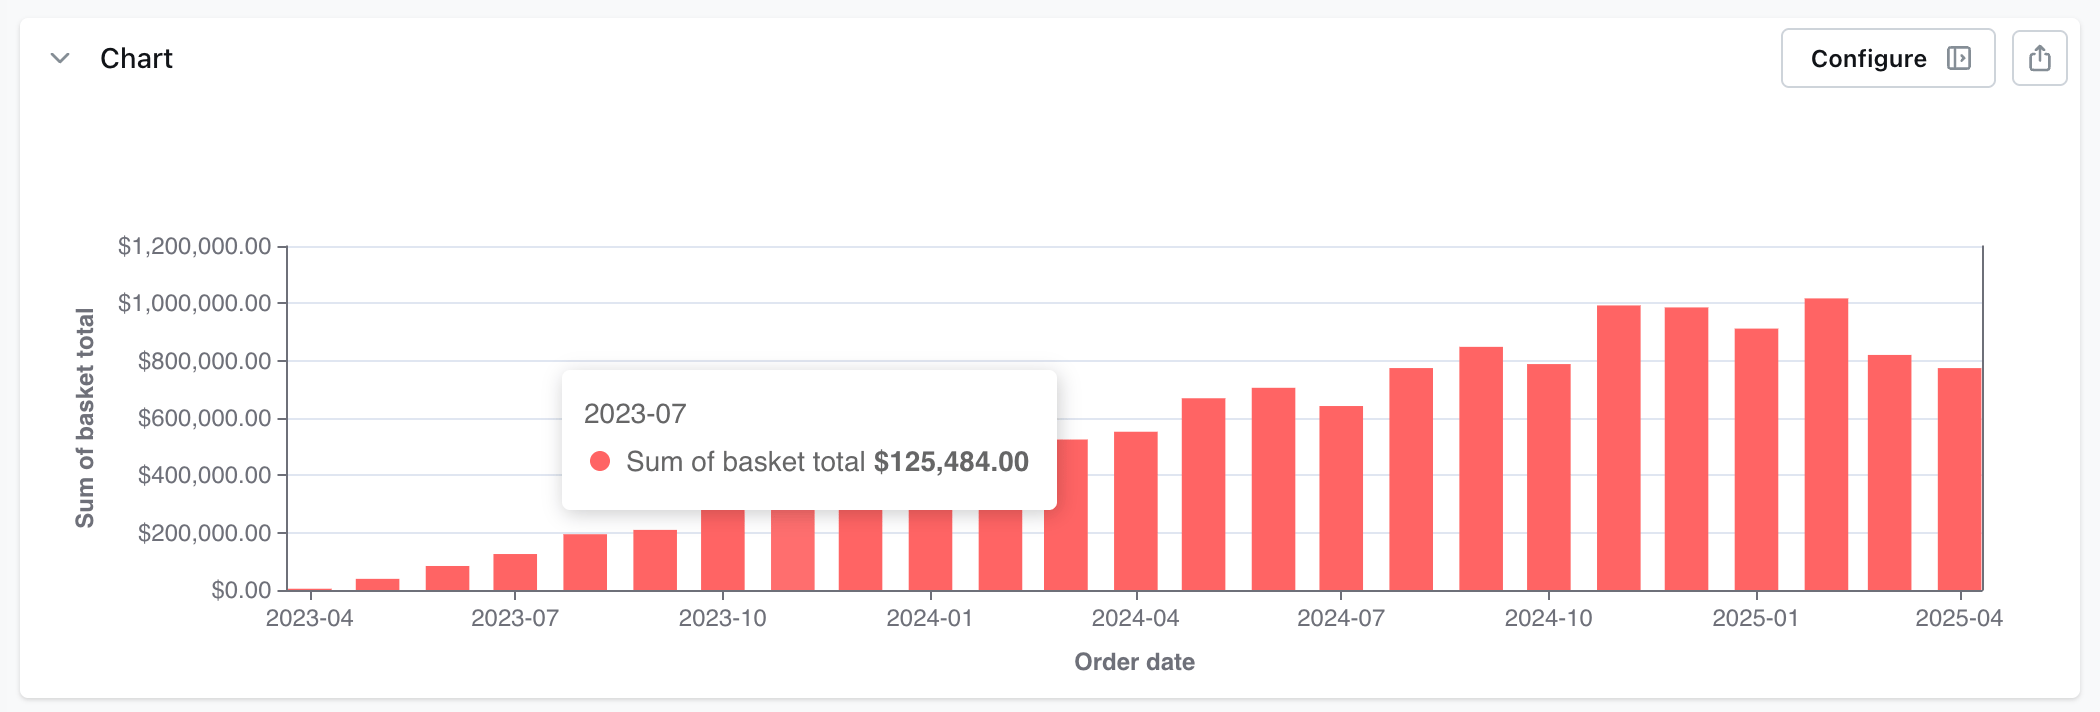
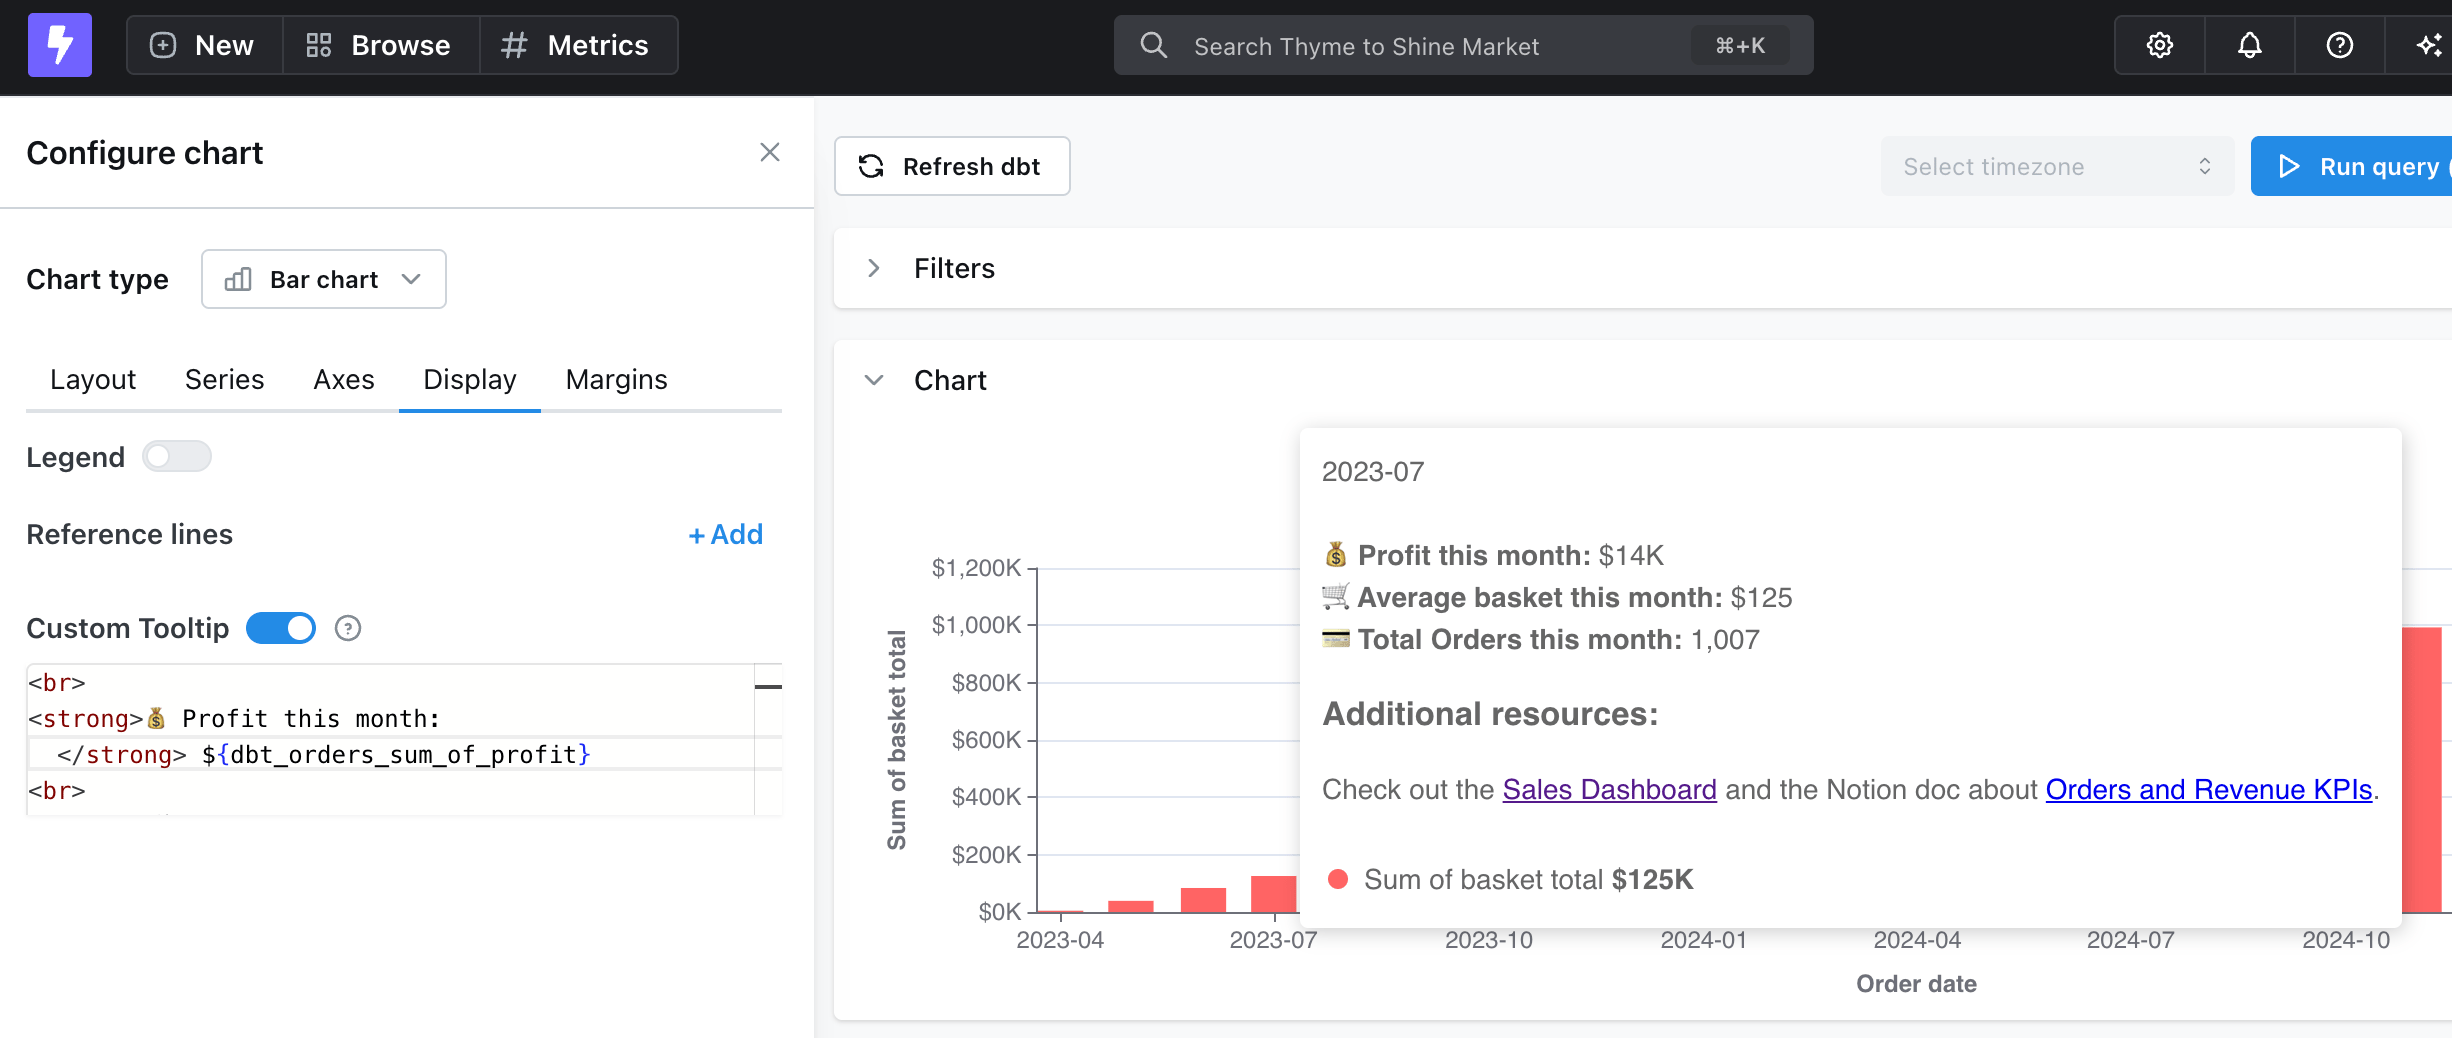
.yml. To explain what a metric means, type the definition into the tooltip. It won’t update when the .yml description changes. Table charts show each field’s .yml description when you hover its column header.
Repeated tooltip entries
If a tooltip lists the same field several times for one x-axis value, check the query for dimensions that aren’t used on the x-axis, y-axis, or group. Each extra dimension splits a category into several result rows, and the chart plots one point per row. Lightdash flags this with a yellow warning icon on the chart that names the unused dimensions. Remove them from the query to get one entry per series.Tooltips on grouped charts
Which fields a tooltip can use depends on whether the chart has a group set in Layout. Without a group, every dimension, metric, and table calculation in the query results is available as a variable, whether or not it’s plotted. With a group, only fields plotted on the chart are offered when you type$ and resolve in the tooltip, so a table calculation that appears only in the results table renders blank.
To use an unplotted field on a grouped chart, add it as an extra y-axis field. If you don’t want it drawn, click the eye icon next to its series in Configure chart → Series to hide it. A hidden series still resolves in the tooltip.
Reference a specific group
On a grouped chart,${field_id} resolves to the value for the group you’re hovering. When the tooltip covers every group at once, such as when you hover a whole stacked column, it has no single group to use and shows the first group’s value. To show each group, reference it explicitly as ${field_id.group_field_id.group value}:
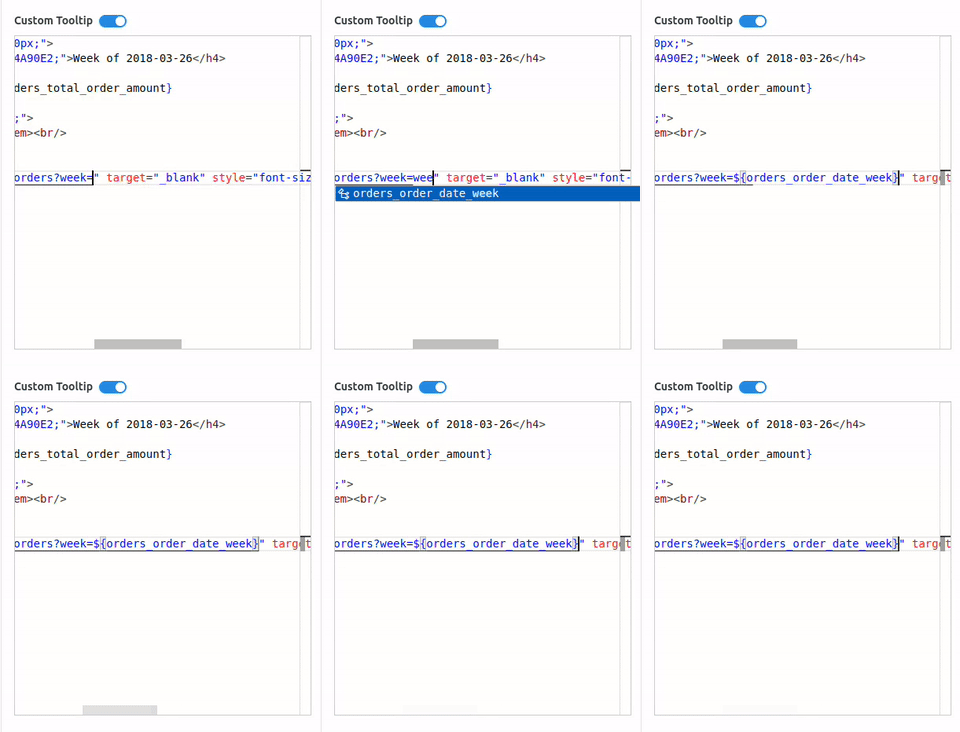
$ autocomplete.
Explicit references don’t resolve for group values that contain
&. Group by a custom dimension that replaces the & instead.