How to use the Canvas view
- Filter your metrics: Use the search bar, categories, or table filters to narrow down the list. Canvas view works best with fewer than 30 metrics for smooth performance. Need help creating categories? Learn more here.
- Enable Canvas view: Switch to the Canvas view toggle in the metrics catalog.
- Add metrics: Drag metrics from the sidebar into the canvas workspace.
- Create connections: Drag between node handles to draw edges representing relationships and dependencies.
- Remove nodes: Select a node and press Backspace to delete it.
Viewers can see trees and connections but cannot make edits.
Saved Trees
Experimental: Saved Trees is behind a feature flag. Reach out to support to enable it for your organization. Learn more about Feature Maturity Levels.
Creating a Saved Tree
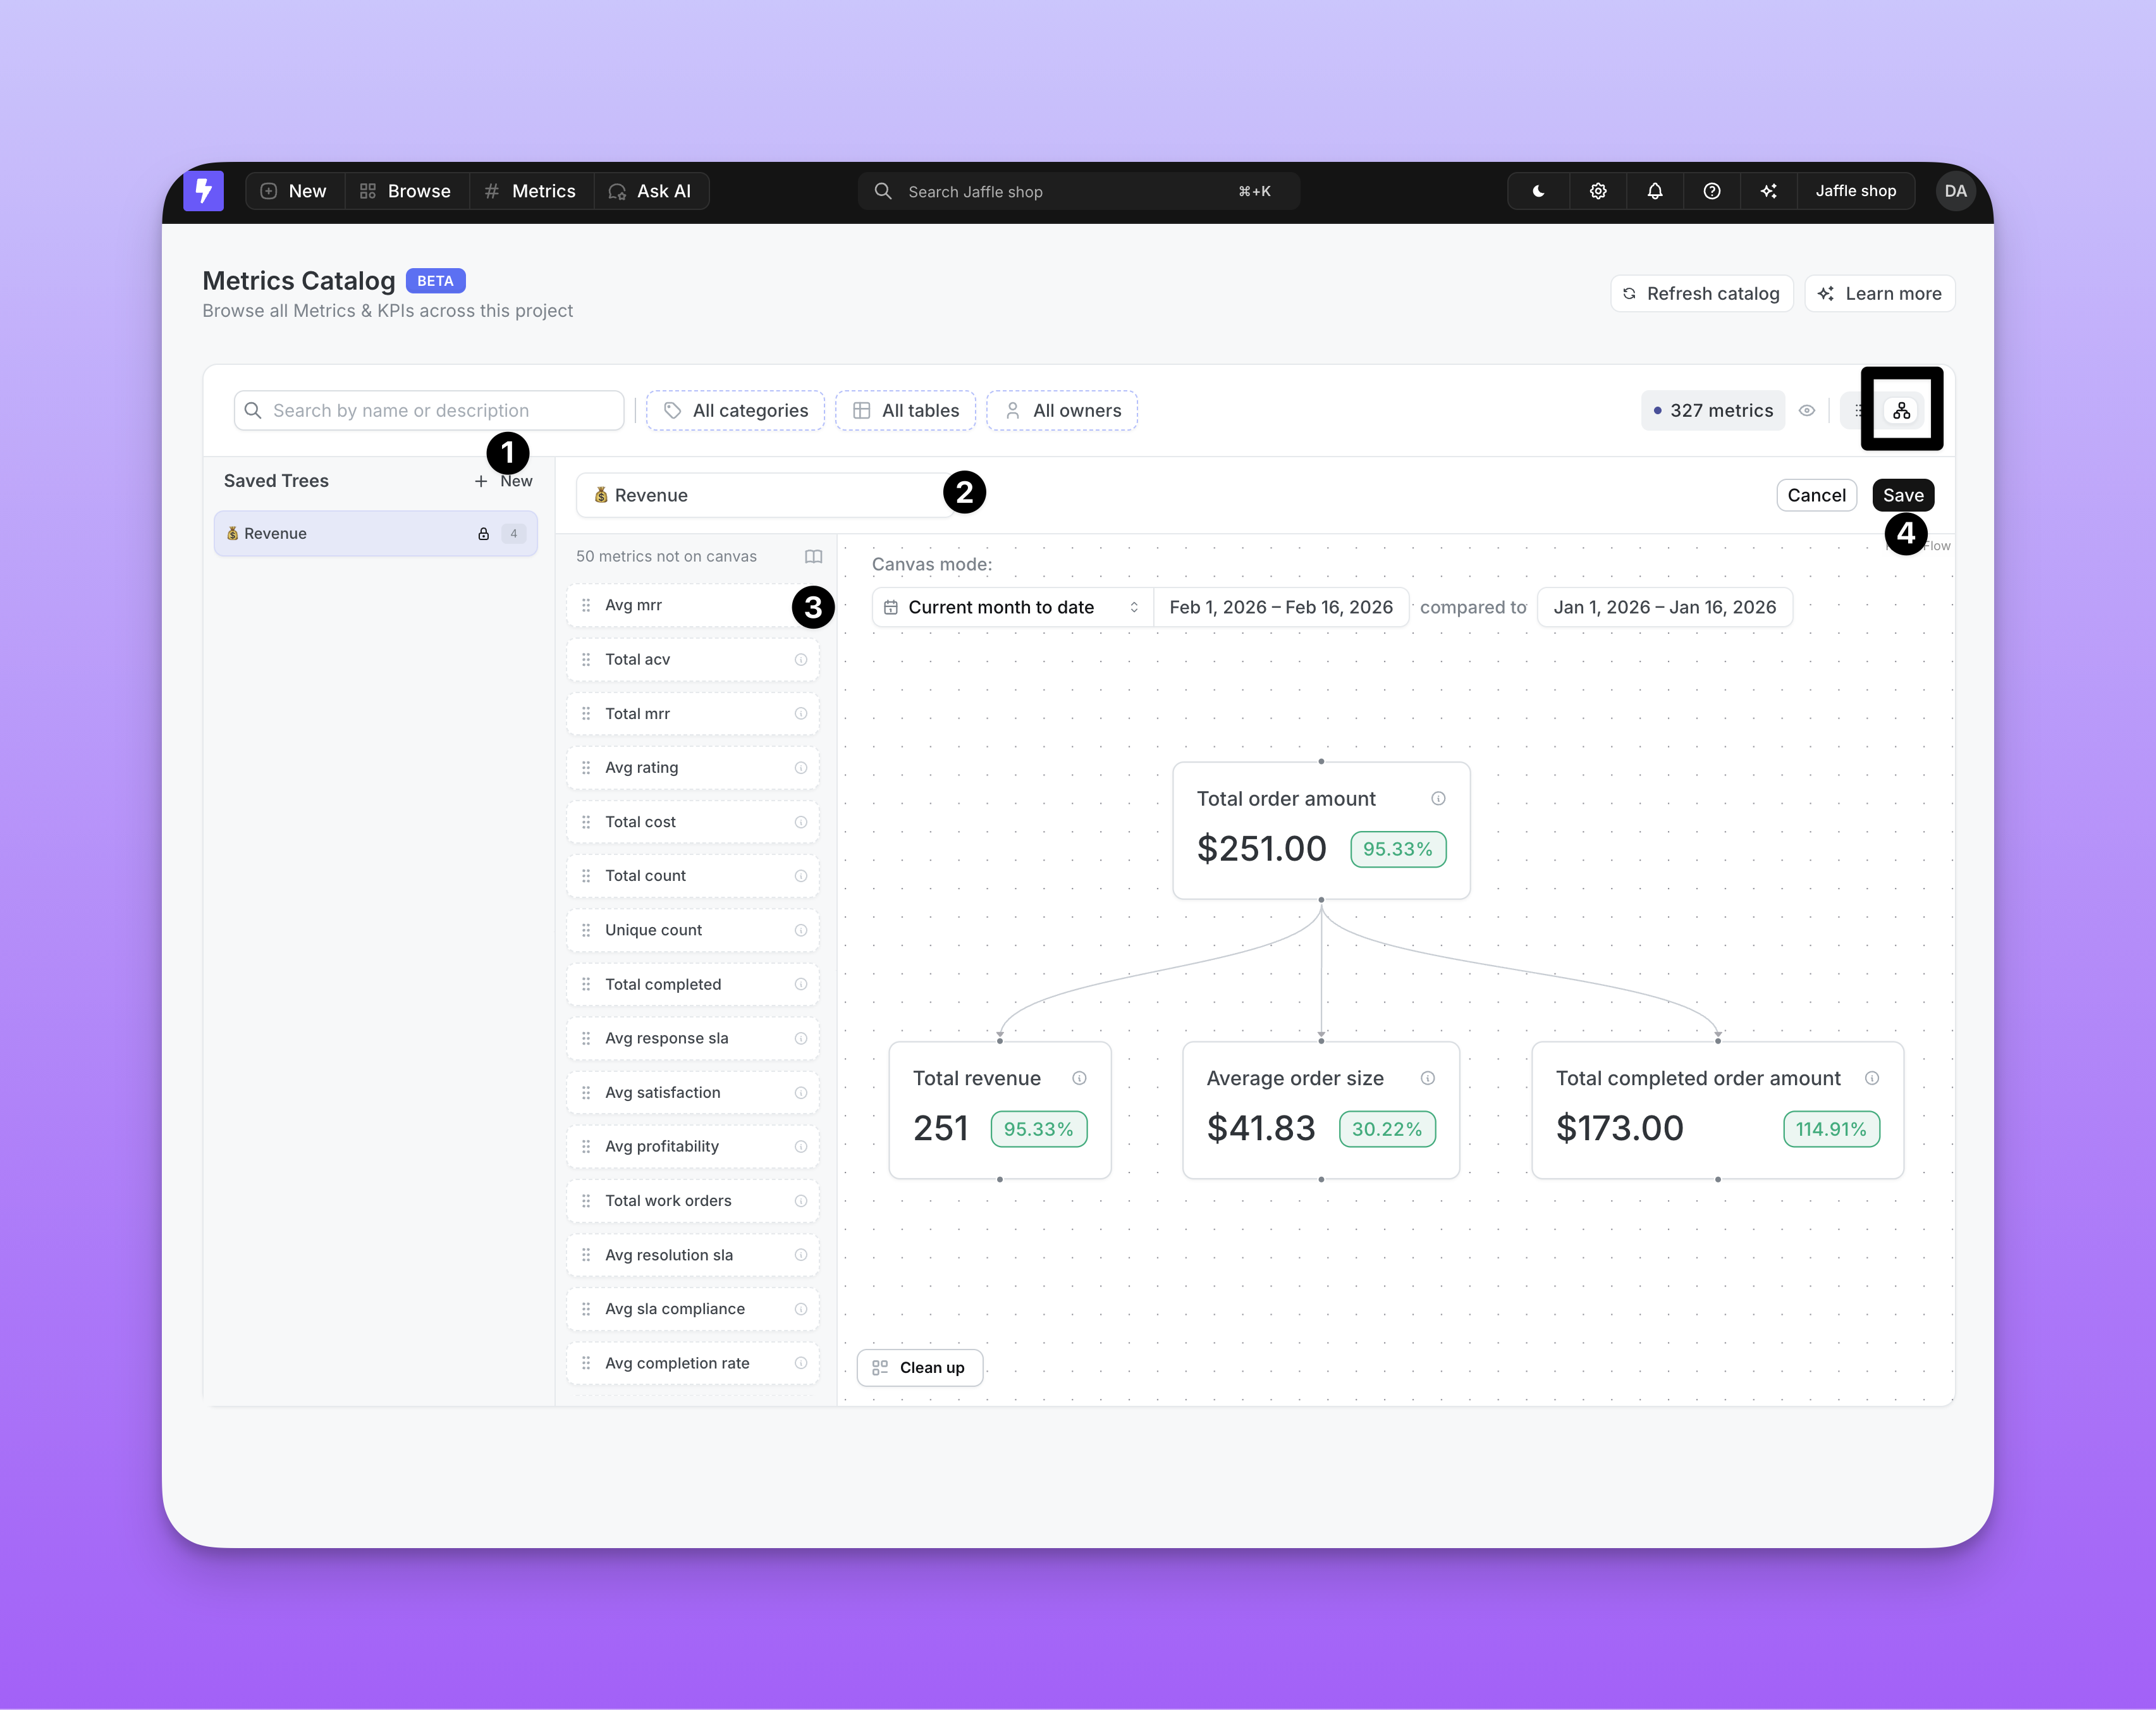
- In the Canvas View, click New Tree to enter edit mode.
- Type a name in the text input at the top of the canvas.
- Drag metrics from the sidebar into the canvas and draw connections between them.
- Click Save. The button is disabled until you provide a name and add at least one node.
Driver edges are not stored with the tree — they are injected automatically whenever matching nodes are present.
Collaborative locking
Only one user can edit a Saved Tree at a time. When you start editing, the tree is locked to you. The lock stays active while you work — if you stop editing for more than 2 minutes, the lock is automatically released so others can make changes. When a tree is locked by another user, you’ll see an “Editing by ” badge in the header, and the Edit and Delete options are disabled until the lock is released. Your changes are automatically saved as a draft while you edit, so if you accidentally close the tab or refresh the page, your work-in-progress can be recovered when you return.Permissions
| Action | Admin | Developer | Editor | Interactive Viewer | Viewer |
|---|---|---|---|---|---|
| View a Saved Tree | |||||
| Create a Saved Tree | |||||
| Edit a Saved Tree | |||||
| Delete a Saved Tree |
Drivers
Drivers are metrics that directly influence or feed into another metric. By defining drivers in your.yml files, you can automatically visualize how metrics relate to each other in the Canvas view — no manual drawing needed.
For example, total_order_amount is a driver of total_revenue, average_order_size, and total_completed_order_amount — because each of those metrics is influenced by the total order amount. On the canvas, this creates a tree where total_order_amount fans out to the metrics it drives.
Defining drivers
Add adrivers property to any metric listing the metrics that flow into it. You can reference metrics from the same table or across tables using the table.metric syntax:
- dbt v1.9 and earlier
- dbt v1.10+ and Fusion
- Lightdash YAML
total_order_amount → total_revenue, total_order_amount → average_order_size, etc.).
How drivers appear on the canvas
- Automatic: Driver edges appear as soon as both the driver and target metrics are on the canvas.
- Read-only: You cannot delete or modify driver edges from the UI — they are managed through your
.ymlconfiguration.
Driver edges cannot be removed from a Saved Tree. If you don’t want a driver edge to appear, remove one of its endpoint nodes from the canvas.
