

Syncs & Scheduled Deliveries overview page. See Scheduled deliveries and Google Sheets for those.
This page covers the part that is different for apps: what ends up in the file.
What gets delivered
A chart delivers one result set. A dashboard delivers a known set of tiles. An app declares neither — so Lightdash renders the app the way a viewer would, watches which queries it actually runs, and turns each one into its own file (or its own tab, for a Google Sheets sync). That has a few consequences worth knowing before you set one up:- One file per query, not per chart. A chart fed by two queries produces two files. A KPI row and a table driven by the same query produce one. The count you get is the number of distinct queries the app executed, which often isn’t the number of things you can see on screen.
- Files are named after the query. The label comes from the app itself — the same label you see in the Queries tab of the network inspector. Two queries sharing a label are given distinct names so neither overwrites the other.
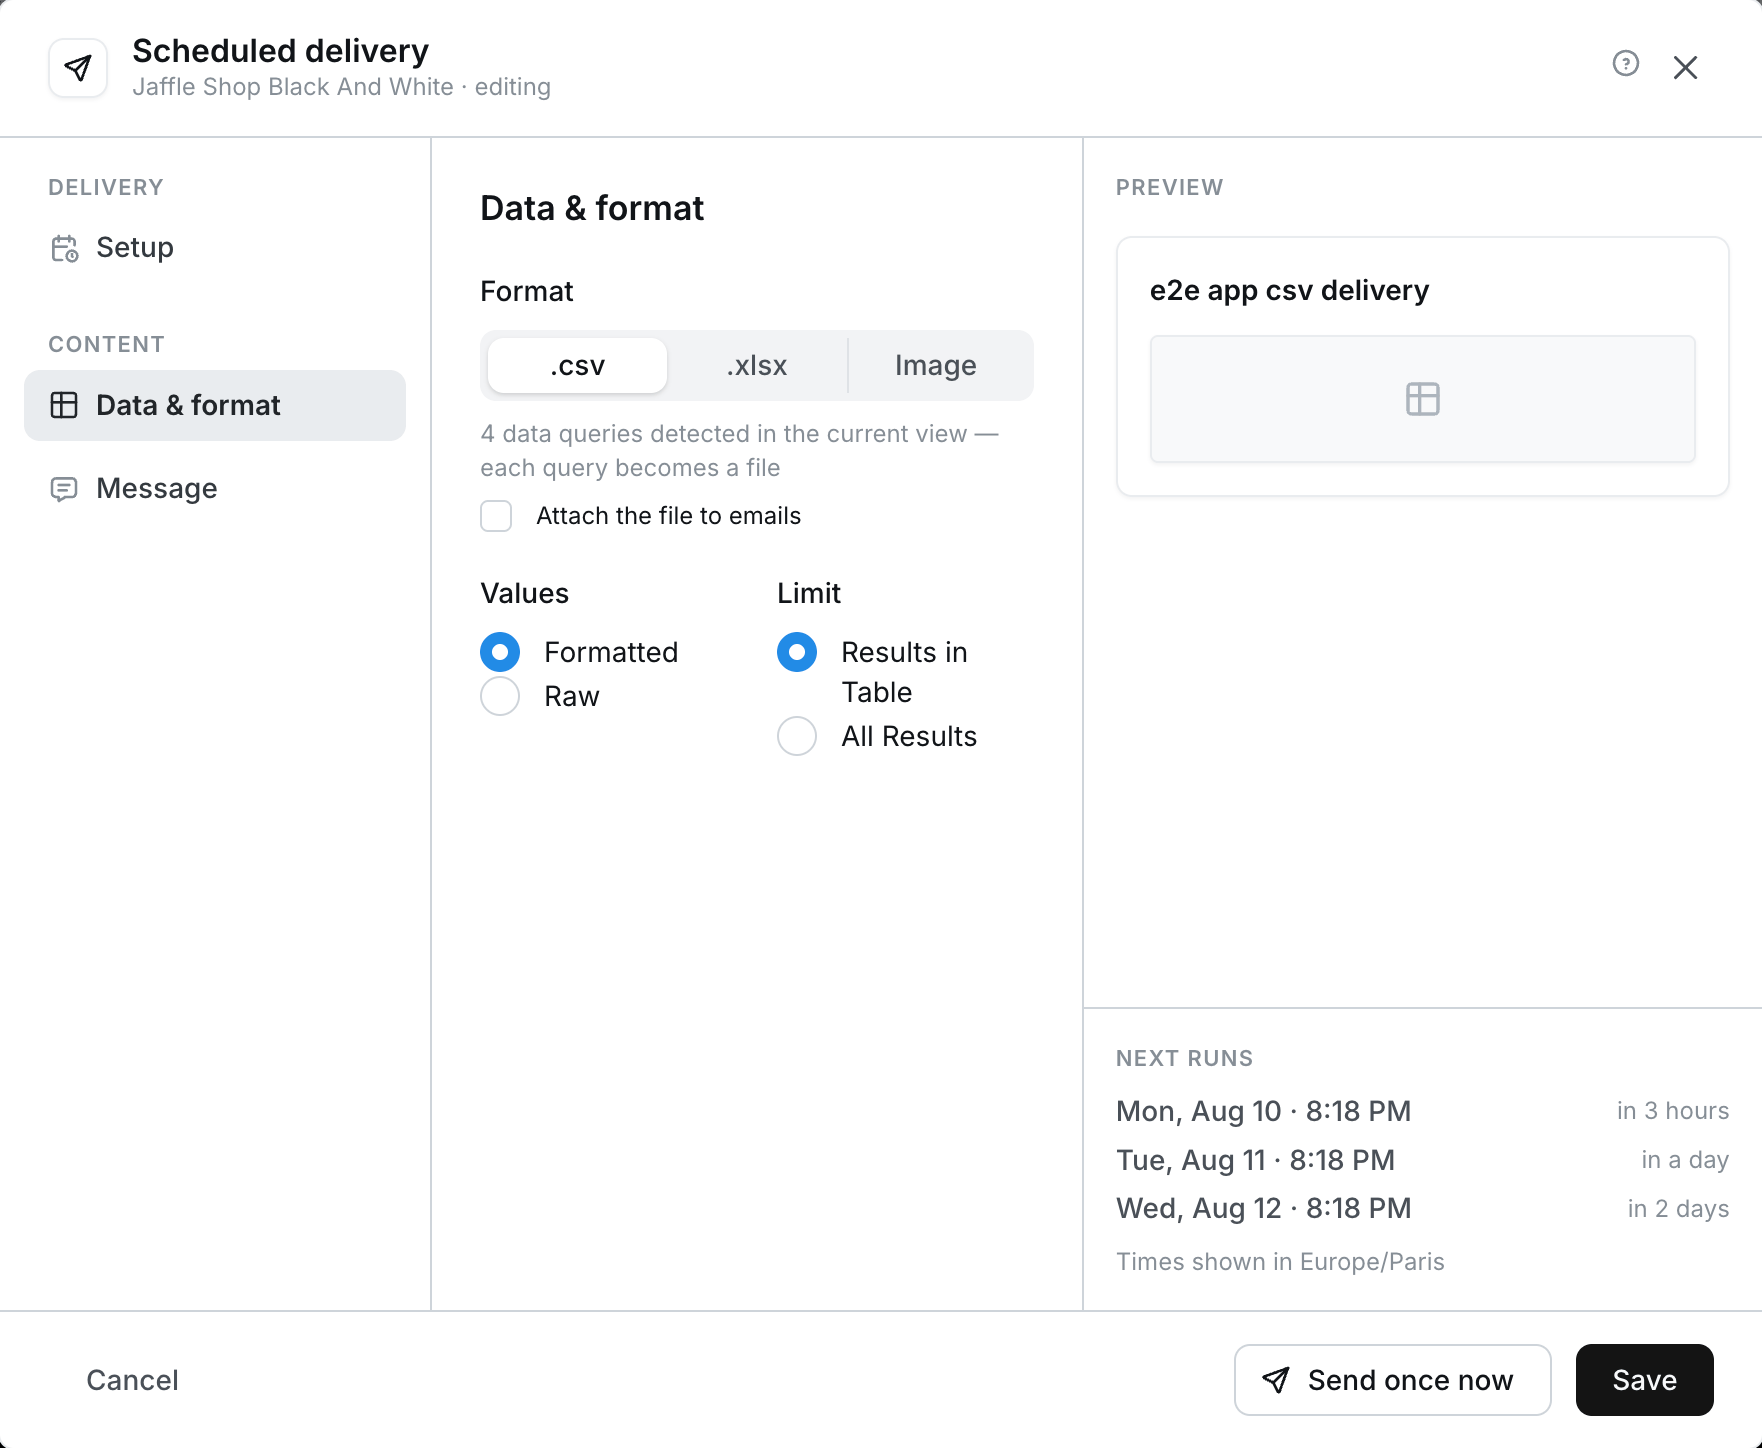
- The delivery form tells you what it found. When you open the delivery configuration, a caption under the format control reads
N data queries detected in the current view — each query becomes a file. It’s a live preview of the current app state, not a limit — an app that fetches more data during delivery renders (see Tabs and coverage) can capture more than the count suggests. - There’s a cap of 50 distinct queries per delivery. Beyond that, the extra queries are dropped and reported alongside the delivery — or, for a Google Sheets sync, the run fails outright.
- An app that fetches nothing has nothing to deliver. If the render captures no successful query, a data delivery or sync fails rather than sending an empty attachment.
Creating a scheduled delivery
Open the app, click the ⋯ menu in the header, and choose Schedule delivery. You need edit access on the app.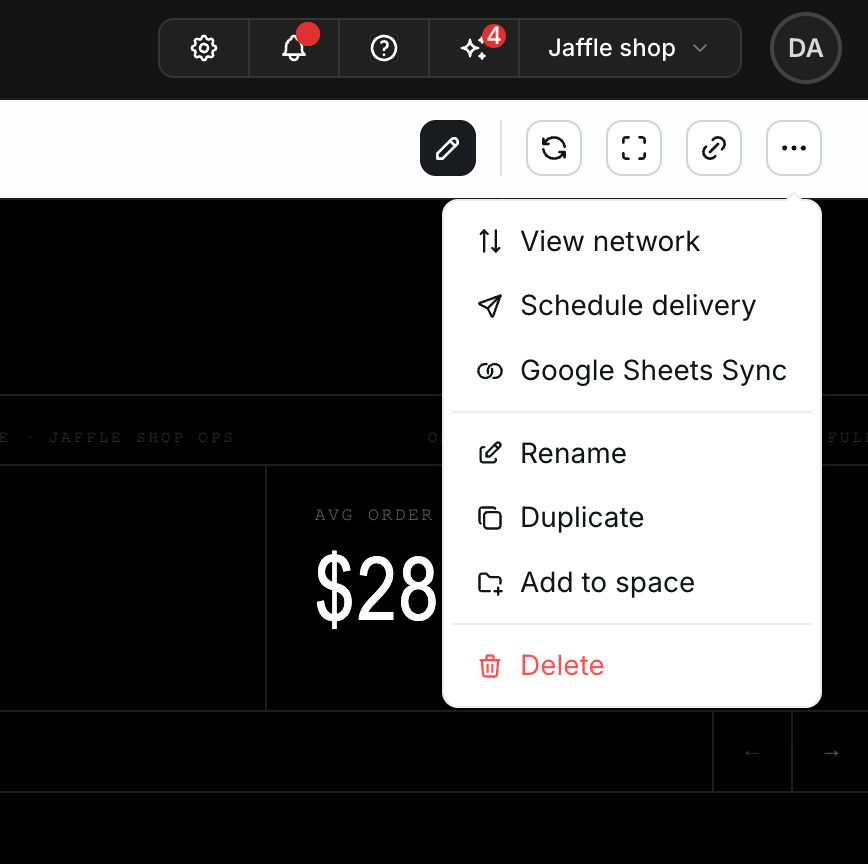
Setup section and a Message section that behave exactly as they do for charts and dashboards, plus the Data & format section covered below. Two things you’ll find on chart and dashboard deliveries are not offered for apps: AI-enhanced messages, and threshold-based alerts.
Format
Apps support.csv, .xlsx, and Image.
.csv/.xlsxdeliver the data — one file per captured query, attached to the email or Slack message.Imagedelivers a screenshot of the rendered app, the same as an image delivery of a chart or dashboard. No data files are attached, so nothing on this page about capture, row limits, or per-query failures applies.
PDF is not offered for apps. If you want a PDF of an app, ask the agent to add a PDF download button to the app itself — see Exporting to PDF.
Send current app state
Dashboards let you adjust saved filters per delivery. Apps use a single toggle instead: Send current app state.- Off (default) — the delivery renders the app’s default view, the same thing a viewer sees when they open it fresh.
- On — the delivery renders the app with the state you have right now: selected filters, the tab or slide you’re on, and anything else the app keeps in its URL.
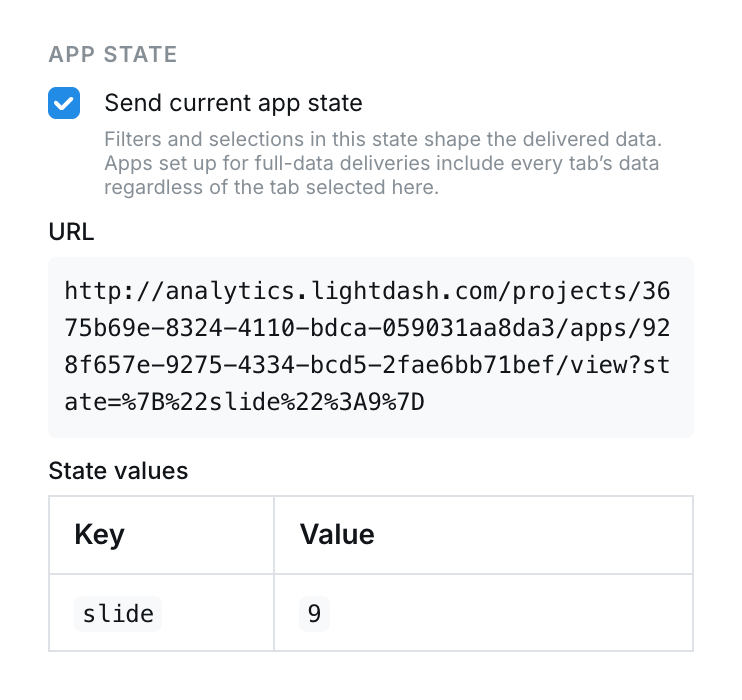
Image delivery it determines the whole render, tab selection included. For .csv and .xlsx the filters and selections in the state shape the delivered data, but an app that fetches every tab’s data during delivery renders (see Tabs and coverage) still captures all of them regardless of which tab was selected when you saved the state.
Rows
For.csv and .xlsx, a Limit control offers two options:
- Results in Table (default) — each file contains the rows the app’s own query asked for.
- All Results — queries that hit their row limit are re-run without a limit at delivery time. Queries that were already under their limit are not re-run.
Custom... numeric option here, because a single row cap can’t sensibly apply across an app’s heterogeneous queries.
All Results re-runs affected queries server-side from their query-history record, under the same identity the delivery already runs as. It makes the delivery slower, and the re-run is still bounded by your organization’s export limits — if a re-run wouldn’t return more rows than the original, Lightdash keeps the original file rather than running a second query for nothing.
Tabs and coverage
Delivery capture is WYSIWYG: it captures what the rendered state actually fetches. For an app with tabs, that means a tab nobody is looking at contributes nothing — unless the app is built to fetch its data during delivery renders. Newly generated apps handle this for you: the agent builds them to detect a delivery render and mount every tab’s data for it, while still fetching only the active tab on normal interactive loads, so an interactive pageload doesn’t pay for data nobody asked for.Apps generated before this behaviour existed aren’t retroactively upgraded — they only capture what the delivered state renders. If a delivery is missing data you expected from another tab, regenerate the app (send any follow-up prompt, or ask the agent to fetch every tab’s data during delivery renders) and the next delivery will pick it up.
When a query fails
If some queries succeed and others fail, the delivery still goes out with the files it has, and the failures are reported alongside it — by name, in the email body or the Slack, Teams, or Google Chat message, and in the run details inSyncs & Scheduled Deliveries. The delivery only fails outright when nothing was captured successfully.
A query that hit its row limit is reported as a notice rather than a failure, since the file is complete as far as the query defined it.
Syncing an app to Google Sheets
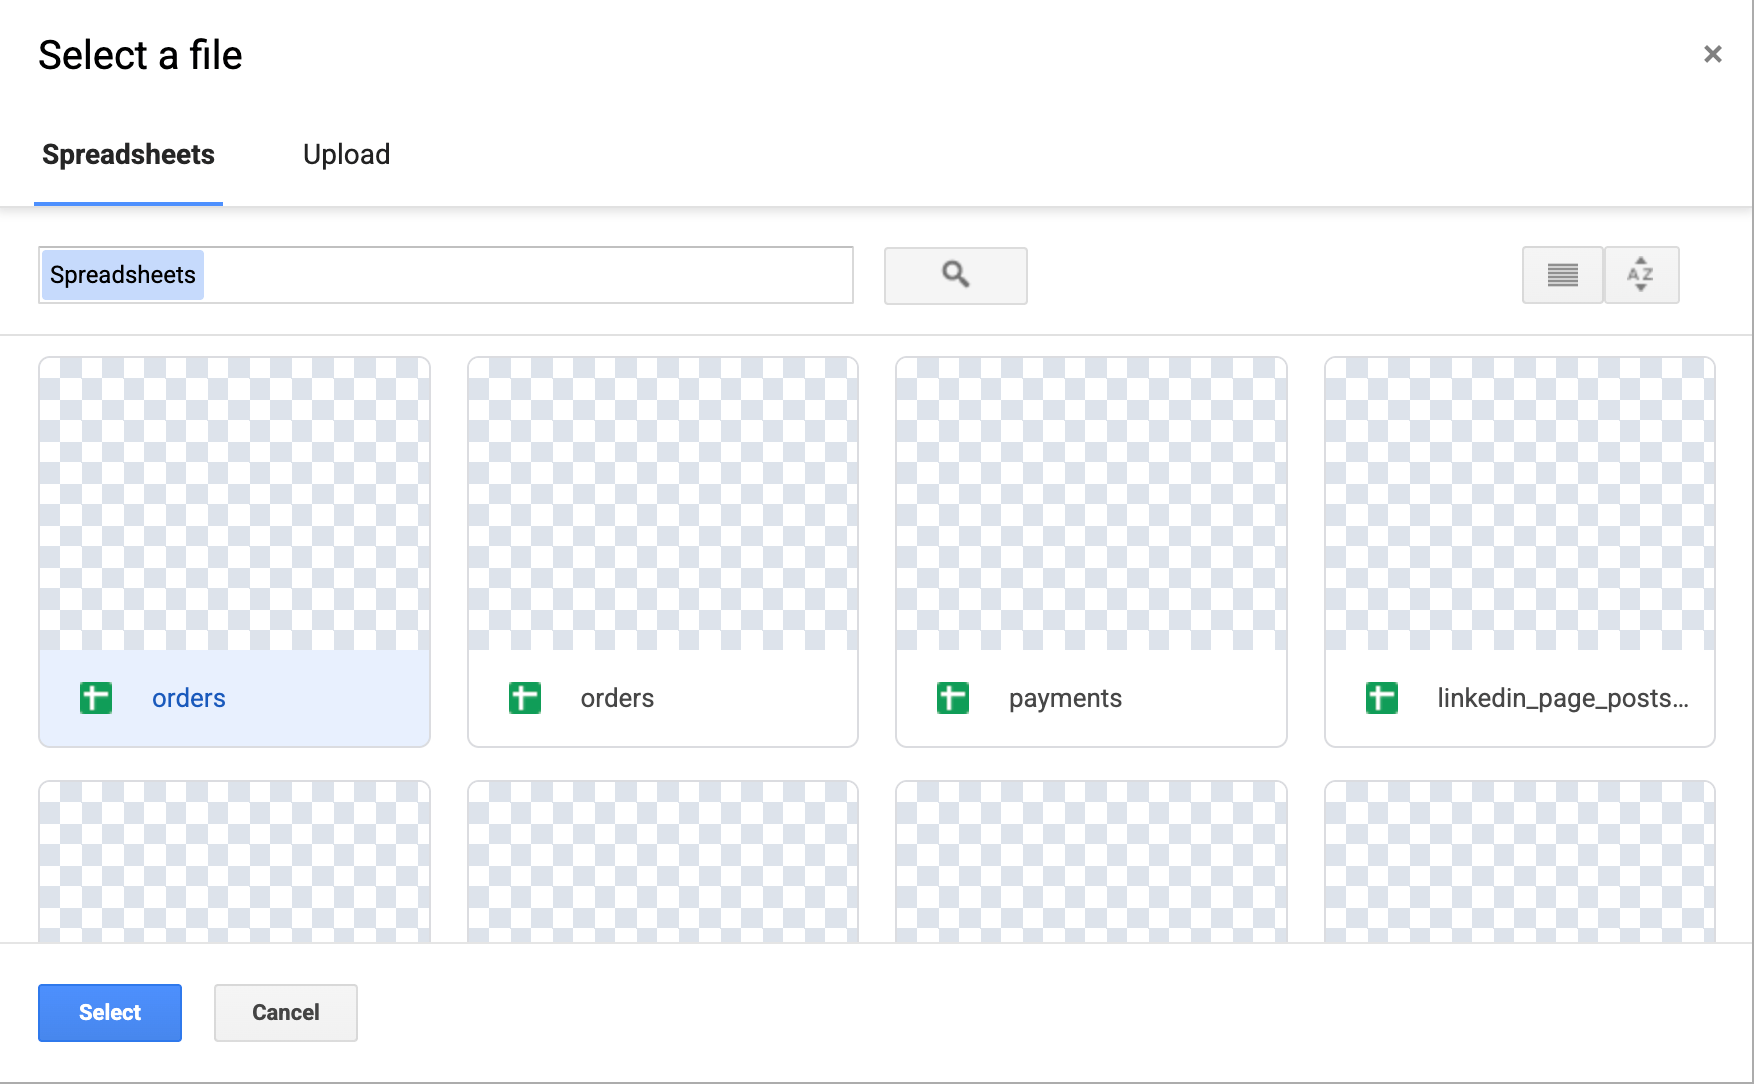
Syncs are set up in their own modal, separate from scheduled deliveries. Open the app, click the ⋯ menu in the header, and choose Google Sheets Sync. You need edit access on the app plus permission to manage Google Sheets, and your organization needs the Google Sheets integration configured. The modal lists the app’s existing syncs, each with a switch to pause it and buttons to sync it now, edit it, or delete it. Click Create to add one.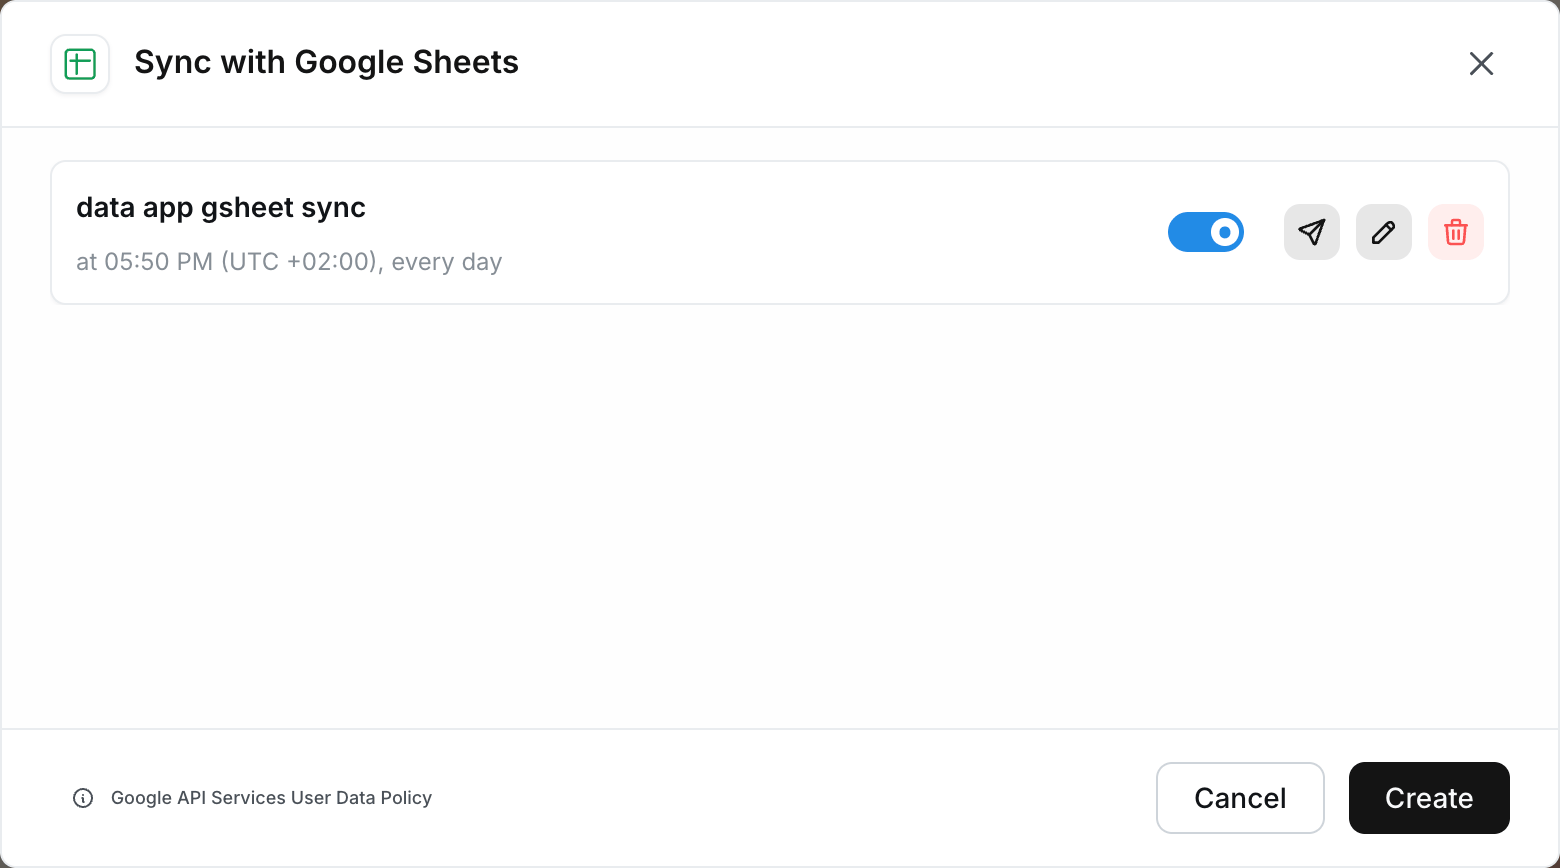
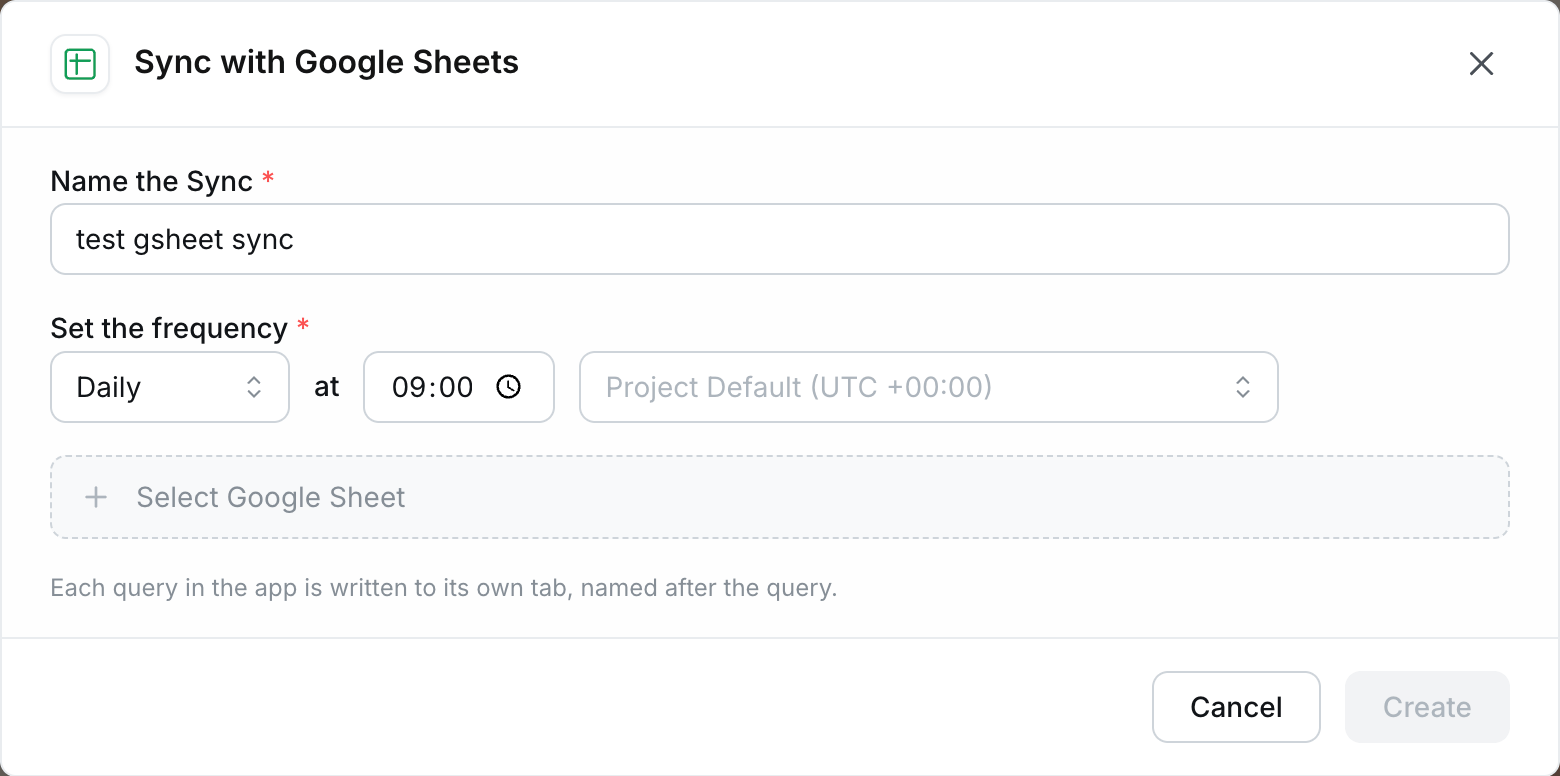
- One tab per query. Every query the app runs gets its own tab, named after the query. There’s no Save in a new tab option, because there’s no single “first tab” for an app to overwrite. Where two queries share a label, each gets a fixed suffix so a given query keeps writing to the same tab run after run.
- No app state. Syncs always render the app’s default view. If you need a specific filtered cut on a schedule, use a
.csvor.xlsxscheduled delivery with Send current app state instead.
metadata tab recording when the sheet was last updated, how often it refreshes, and which tabs were written.
Each run overwrites the tabs it writes. Syncs also fail as a unit rather than partially: if any query errors during the render, or the app runs more than 50 queries, the whole sync fails and names what went wrong. A Google Sheet is a single shared artifact with nowhere to attach a partial-failure notice, so a quietly missing tab would be worse than a failed run.
A sync with many queries is deliberately paced to stay inside Google’s Sheets API write quota, so a large app takes noticeably longer to sync than a single chart does.
Managing app deliveries and syncs
App scheduled deliveries and syncs appear inProject Settings → Syncs & Scheduled Deliveries alongside every other delivery in the project, with the same status indicators, run history, Send now, and owner reassignment. See Overview of your scheduled deliveries.