Public Beta: Data apps are currently in the Beta phase. Learn what this means in our Feature Maturity Levels guide: Feature Maturity Levels.Data apps are free to use during the beta. Pricing after general availability is to be confirmed.
Creating a new app
You create a new data app from the ‘New’ menu in the navigation bar.Choosing a template
Every new app starts from a template. The template you pick tells the agent what kind of layout you have in mind and sets up some of the built in interactions:- Dashboard - a single-page layout with multiple charts and KPIs, optimized for at-a-glance reading.
- Slide show - a presentation-style app you can step through, useful for narratives or executive reviews.
- PDF report - a print-friendly layout designed to be exported as a PDF.
- Custom - start from a blank prompt with no layout assumptions.
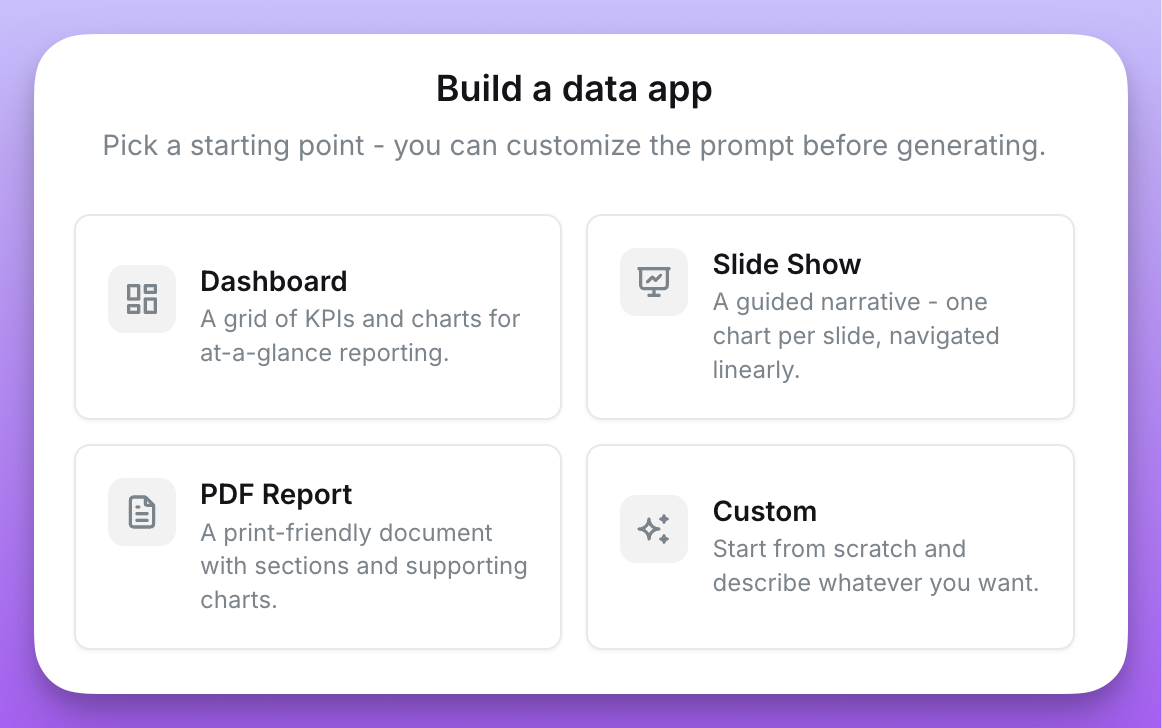
We encourage you to try out Custom apps to make something wildly different - the sky is the limit!
Adding context
The more context you give the agent, the better the result. You can attach several types of context to your prompt:- Charts - pick existing saved charts to give the agent a working metric query it can reuse. The agent gets the structure of the query (the dimensions, metrics, filters, and table) so it knows exactly which fields to use.
- Dashboards - attach a dashboard to pull in every query on it at once.
- Images - upload screenshots, mockups, or design references. Images are one of the fastest ways to nail the visual style you want.
- Sample data - each chart and dashboard chip has an Include sample data toggle. When you turn it on, Lightdash runs the query and passes the first 10 rows to the agent so it can make better decisions about formatting, content, and copy. Sample data is opt-in per resource because rows can be sensitive - the agent will see whatever you send it.
-
Live-linked charts - each chart chip also has a Link toggle next to Include sample data. When Link is off (the default), the agent embeds a frozen copy of the chart’s metric query into the app - later edits to the chart in Lightdash won’t flow through. When Link is on, the app runs the chart live by its UUID on every load, so changes made to the saved chart in Lightdash (metric swaps, filter tweaks, additional dimensions) show up in the app on the next refresh. Linked charts still respect the viewer’s permissions and appear in the Queries tab of the inspector like any other query. Link is not yet supported for embedded apps that authenticate via JWT.
Dashboard filters propagate to linked charts inside a data app tile the same way they propagate to any other chart on the dashboard: filters that reference a field on the linked chart’s explore narrow the chart, and filters that reference fields outside that explore are silently ignored for that tile. This propagation is handled by the dashboard itself, so existing data apps pick it up without regeneration.
Interactive filter controls, downloads, and drill-downs on linked charts work end-to-end. When a user changes a filter control the app is wiring into a linked chart, the chart re-runs against Lightdash with those filters ANDed onto the chart’s own filters - the query can only narrow, never widen or replace what the saved chart defines. Filters on a linked chart apply to dimension fields only (metric-threshold filters need to live in the saved chart itself). Downloading a linked chart’s results and drilling into an underlying row both work the same way they do on any other Lightdash chart, and drill-downs from a filtered linked chart inherit the active filters so you drill into the rows you’re actually seeing.
Interactive controls, downloads, and drill-downs for linked charts ship to newly generated data apps. Existing apps aren’t retroactively upgraded — regenerate or ask the agent to rebuild the affected section to pick up the new behavior.
Iterating on your app
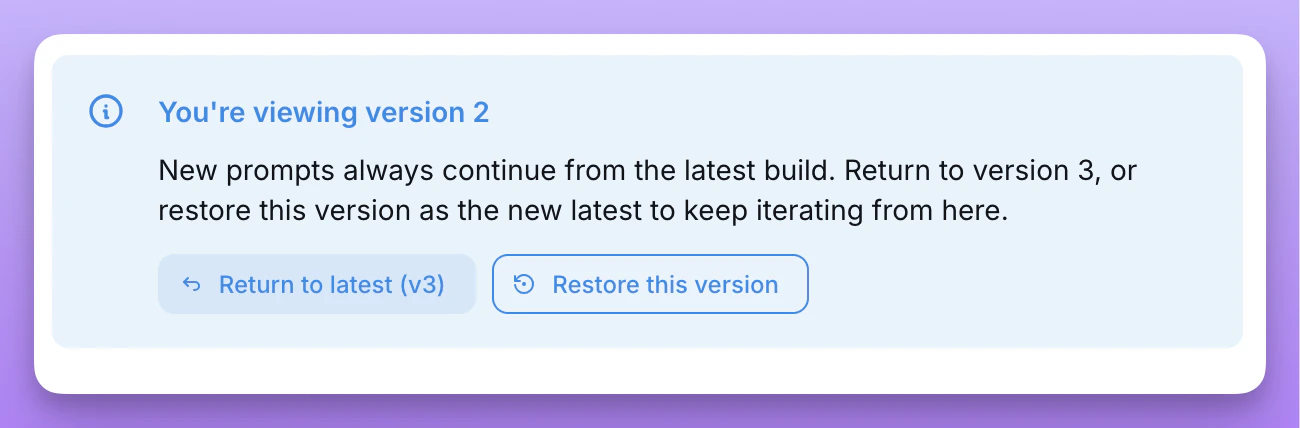
Every prompt you send creates a new version of the app. The agent keeps its working state between versions, so follow-up prompts like “make the header smaller” or “swap the bar chart for a line chart” land as targeted changes instead of full rewrites. If a build is taking too long or going in the wrong direction, you can cancel it and try a different prompt.Restoring an earlier version
If a recent prompt took the app in the wrong direction, you can roll back to any earlier ready version and keep iterating from there.- Click an earlier version in the version timeline to preview it.
- In the callout in the bottom left, click Restore this version.
- Confirm in the dialog.
Duplicating an app
If you want to fork an app - to experiment with a different direction, use it as a starting point for a new app, or grab a personal copy of something a teammate built - you can duplicate it. You can duplicate any app you can view. The duplicate lands in your Settings > My apps as a personal app you own, regardless of where the original lives. The original is untouched. To duplicate an app:- From the apps list, open the ⋯ menu on any app card and select Duplicate.
- Or, from inside an app, open the ⋯ menu in the chat header and select Duplicate.
- The generated app code (the version you see in the preview).
- The template the source app was built from.
- Any chart and dashboard resource references attached to the source app.
- Prior version history - the duplicate starts fresh at v1.
- Images attached to earlier prompts.
- Pending clarifications from in-progress builds.
- The running sandbox - a fresh sandbox spins up on your first prompt.
Network inspector
The inspector is a tabbed network panel that captures everything the running app talks to. Open it from View network in the preview header.- Queries - every metric query the app runs against your semantic layer, including the underlying query definition, the fields it’s pulling, and the rows it gets back. Live-linked charts show up here too. Use it to verify the app is asking for the right data, debug unexpected numbers, or sanity-check performance.
- Requests - every external fetch the app makes at runtime through a linked external connection, with the method, path, status, response, and round-trip duration. Use it to confirm the app is calling the right endpoint and that the response shape matches what the UI expects. The inspector only ever sees the connection alias and path - credentials are injected server-side, so they’re never displayed here.
- Open in Explore - opens the query in a full explore view so you can pivot on it, tweak filters, or dig into a single number.
- Save to Lightdash - creates a governed table chart from the exact query the app ran. You pick a chart name and a target space; the chart is created via the same flow as saving from an explore, so your normal chart-create permission on the space applies. Save to Lightdash is available on inline app queries; linked charts already live in Lightdash, so the action is hidden there.
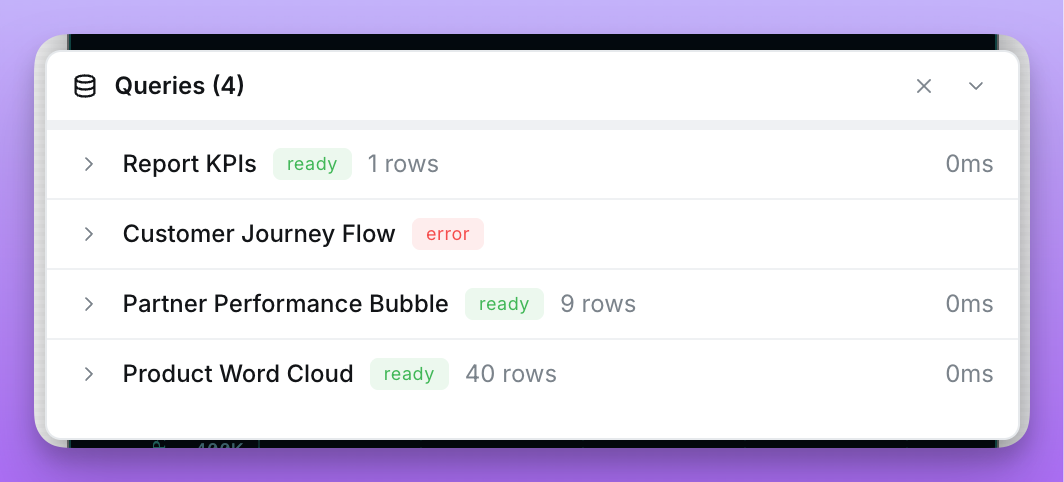
Inspect data
The Queries tab has an Inspect data toggle (the database-search icon in the panel’s title bar) that turns on a two-way link between the inspector and what’s rendered in the app:- Hover a query row to highlight every data point in the preview that was rendered from that query - individual bars, table rows, KPI values, chart segments, and cells all light up together, so you can see exactly where a query’s results end up in the UI.
- Click a data point or a query row to pin the selection so you can scroll or interact with both sides without losing the highlight; click again (or press
Esc) to cancel.
Refreshing the preview
The preview header has a Refresh button that reloads the app’s iframe and re-runs every metric query against the warehouse, without starting a new build. Use it when you’ve changed something in your semantic layer (for example, pushed a dbt update) and want to see the new results in the running preview. Refreshing also invalidates the warehouse cache for that app. The first time you refresh, the app stops serving cached query results and re-queries the warehouse fresh from then on - the same behaviour as the refresh button on a dashboard. The initial load still uses cache so the app opens quickly; once you’ve asked for fresh data, every subsequent query stays fresh for the rest of the session. You’ll find the same Refresh action in the ⋯ menu on the standalone preview page (the full-screen view you get from Continue building).Exporting data
You can ask the agent to add export controls to any table, chart, or KPI in your app — for example, “add a CSV export button to the orders table” or “let me download the revenue chart as XLSX”. Exports run through the same Lightdash backend pipeline used by core charts and dashboards, so file generation, row limits, and raw vs. formatted values all behave consistently with the rest of the product. When the agent wires up an export control, it can offer the user:- File type - CSV or XLSX.
- Row scope - the rows currently loaded in the app, or all matching results for the underlying query.
- Value mode - formatted values (currency, percentages, prefixes/suffixes from your dbt YAML) or raw warehouse values.
External connections
A data app can also fetch from third-party HTTP APIs — for example, your own product API, a payments provider, or a Google API like BigQuery’s REST endpoint. A project admin registers each API as an external connection (base URL, allowed methods, auth), and app builders link the connections they need. At runtime, requests go through a Lightdash-mediated proxy that injects credentials server-side, so secrets are never exposed to the app code or the browser. See External connections for details.Themes
You can create shared themes to give your data apps consistent styles and instructions across your organization. A theme bundles CSS rules, fonts, images, and askill.md instructions file that the agent uses when building the app. When creating a new app, you can choose which theme to apply, and you can set a default theme for the org.
See Themes for details.
Visualizations
Data apps can also power reusable custom chart types. A data app visualization is a single-tile chart renderer you generate from a prompt - a calendar heatmap, a hexbin map, a custom KPI layout - that declares the typed fields it needs (dimensions, metrics, series). Once saved, anyone in the project can pick it as a chart type in the Explorer, map their query’s fields to it, and save the result like any other chart. See Data app visualizations for details.Sharing an app
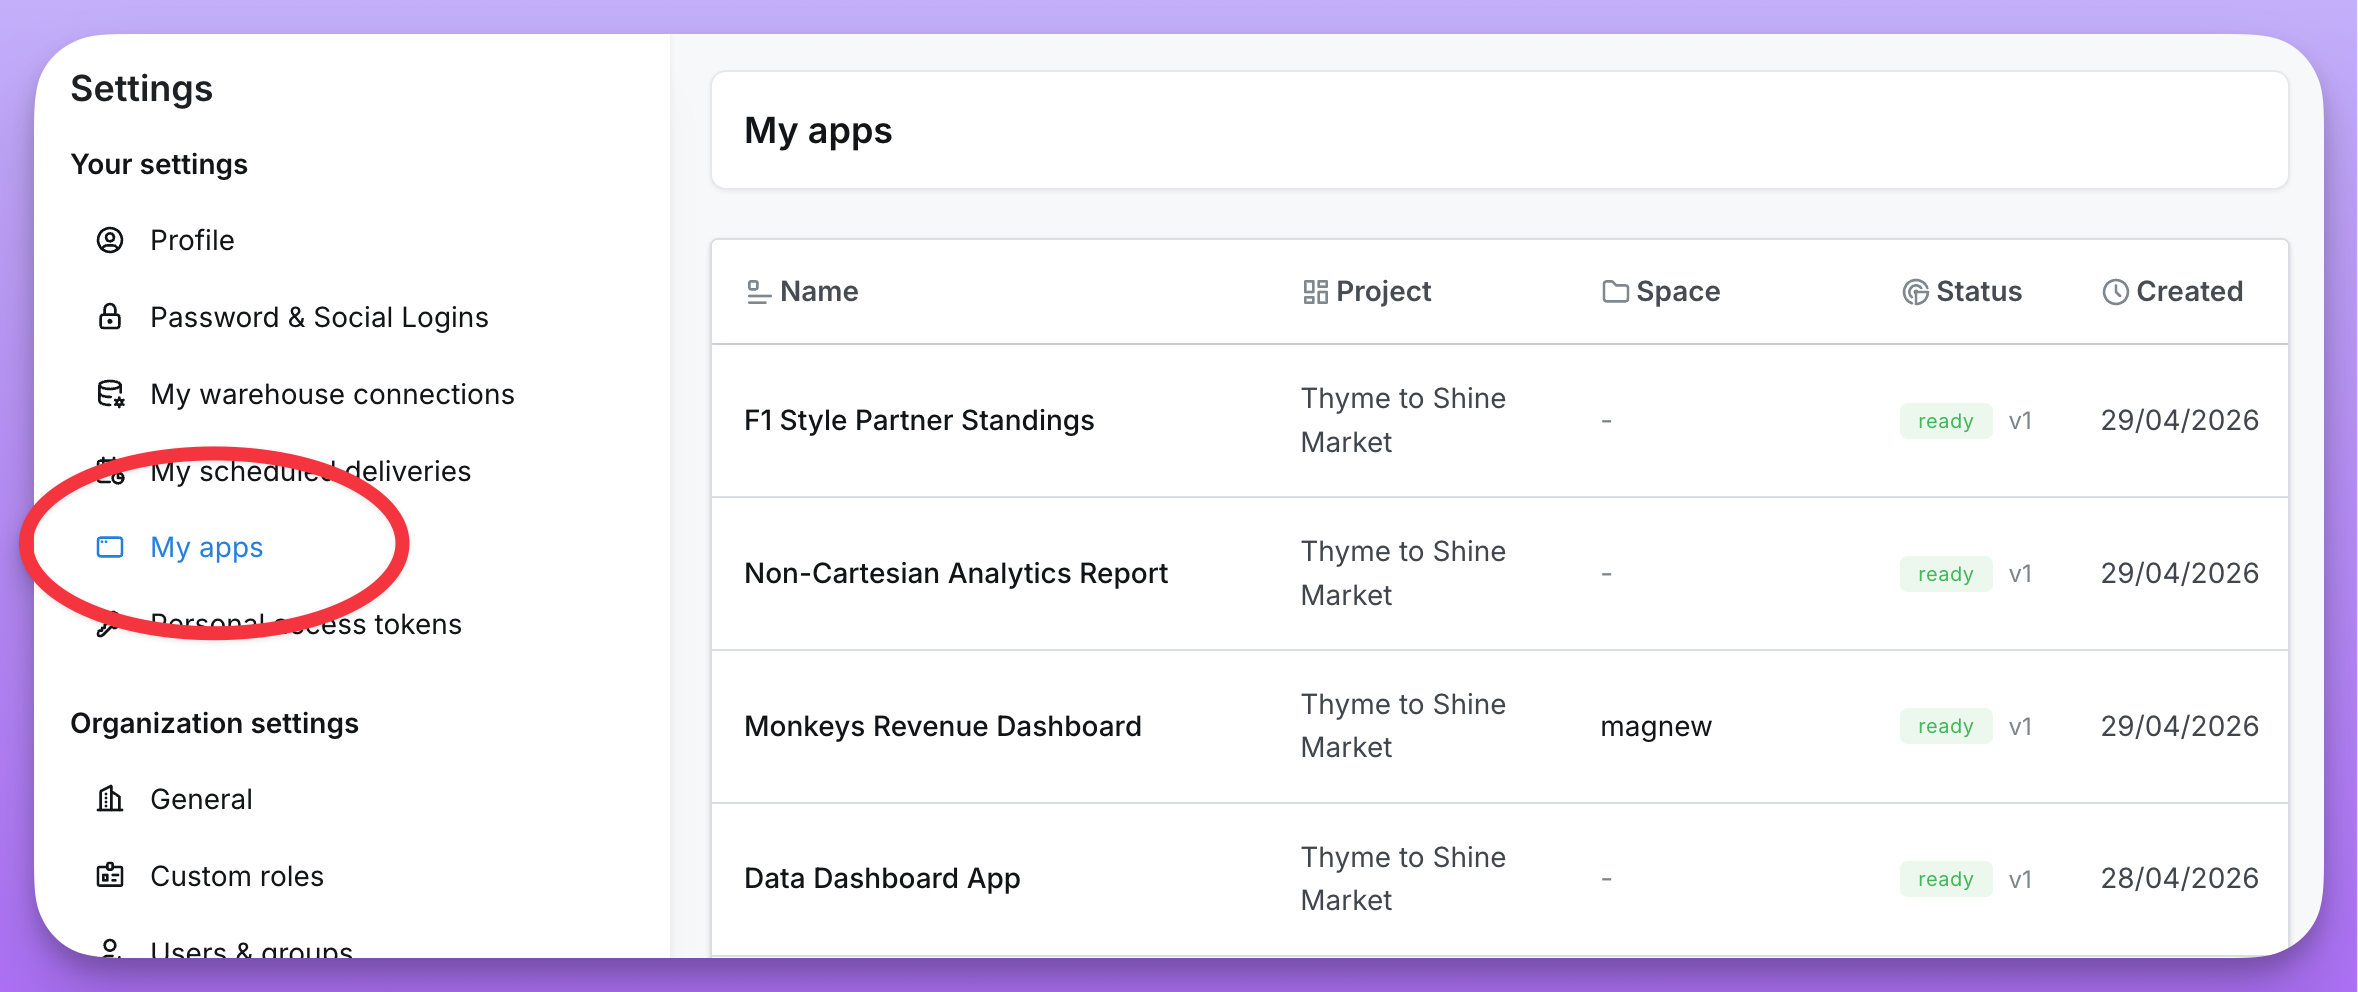
Newly created apps are personal - only you can see them. Apps will initially appear in Settings > My apps. To share an app with your team, add it to a space. Access to a data app is controlled by two things working together: the user’s project role and their space access level.Project role
Your project role determines what you’re allowed to do with data apps anywhere in the project:Project roles can be inherited from organization roles. If you’re an Editor at the organization level, you’re at least an Editor on every project. You can be given a higher role on a specific project, but never a lower one. See Roles in your Lightdash instance for details.
Space access
Once an app is added to a space, the user’s space access level decides whether they can see and edit it within that space:- Users with
Can viewaccess to the space can open the app and interact with it (if their project role allows it). - Users with
Can editorFull accessto the space can iterate on it, rename it, move it, and delete it (if their project role allows editing). - The app respects the same project-level access controls (user attributes, row-level filters) as the rest of your content.
Promoting an app
If you’re building in a preview project, you can promote a data app into the preview’s upstream (production) project once it’s ready. This mirrors how chart and dashboard promotion works: you iterate safely in preview, then push a snapshot to production. To promote an app:- Open the app’s ⋯ menu - either on the app card in a list, or in the chat header inside the app - and select Promote.
- In the confirmation dialog, review whether the action will create a new production app or update the existing linked one, and which space it will land in.
- Click Promote. When it finishes, you’re taken to the promoted app in the production project.
- Manage access on the source data app in the preview project.
- Create permission for data apps in the upstream project.
- The preview project must have an upstream project configured under Settings → Data ops.
Promoting a dashboard with data app tiles
If you embed a data app in a dashboard and promote the dashboard, every referenced app is promoted alongside it. Each app is created or updated in the upstream project using the same rules as standalone app promotion, and the tile is remapped to point at the upstream app so the production dashboard renders the production copy.Data apps as code
Data apps join charts and dashboards in the as-code workflow. You can download a data app’s source, check it into git, edit it locally, and re-upload it — the destination Lightdash instance rebuilds the app in its sandbox and publishes a new version. This lets you version app source, review changes in pull requests, and move apps between projects or instances. Data apps as code is opt-in: it only runs when you pass the--apps or --include-apps flag to lightdash download, or --apps to lightdash upload, and requires data apps to be enabled on the destination instance.
Downloading an app
Uselightdash download --apps <appUuids...> to fetch specific apps by UUID, or --include-apps to grab the project’s apps (capped at the first 10; only apps that have been added to a space are listed):
--apps.
For an app-only checkout — no charts, dashboards, or space files — add --apps-only (it implies --skip-charts --skip-dashboards --skip-spaces, which also work individually). This is the recommended way to work on apps: it keeps the folder clean and avoids accidentally re-uploading unrelated project content later.
lightdash/apps/<slug>/, where <slug> is derived from the app’s name. Every folder is a locally buildable project:
lightdash-app.yml— the manifest, including theappUuidthat identifies the app when you re-upload it, plus editablenameanddescriptionfields. For data app visualizations, the manifest also carries avizSchemafield describing the declared fields (dimensions, metrics, series) the viz needs — the schema is stored in the database, not the source tree, so the CLI persists it here to round-trip a viz through download and upload.src/— the app’s source tree (React components, styles, etc.). This is the only directory you should edit.package.json,README.md,.gitignore,AGENTS.md, and.claude/skills/— a template that lets you install dependencies and runpnpm buildlocally to sanity-check that the source compiles. Editing these files has no effect on the deployed app — the server rebuilds against its own trusted template..lightdash/context/— a read-only, point-in-time snapshot of the source project so you (or an AI agent) have the context needed to edit the app:semantic-layer.yml(tables, dimensions, metrics you can query),parameters.yml,prompt-history.md, andtheme/styling assets. Re-download to refresh.
Local edit → build → upload loop
Once an app is on disk you can iterate on it locally:- Edit files under
src/. - Optionally run
pnpm install && pnpm buildinside the app folder to check that the source compiles. This is a local pre-check only — ifpnpm installfails in your environment (registry policies, no network), skip this step rather than fighting it; the server does its own build on upload and any build errors appear on the app’s page. - Run
lightdash upload --appsto send the source back. The server rebuilds and publishes a new version.
.claude/skills/ and AGENTS.md files describe the SDK surface and this workflow so coding agents (Claude Code and similar) can help you edit apps locally without extra prompting.
Data app visualizations follow the same loop: the download writes the viz’s declared field schema into lightdash-app.yml, and the upload sends it back so the viz shows up in the viz picker on the destination. If you edit the manifest’s vizSchema directly, the upload validates it and rejects malformed schemas. Bundles downloaded before viz schemas round-tripped have no vizSchema field — re-download from the source project to pick it up before uploading elsewhere.
Uploading an app
Uselightdash upload --apps to send your local changes back:
building status in the UI. If the build fails, the error appears in the app’s version history in the UI — the CLI does not wait for the build to finish. Only the src/ tree and manifest are sent; the scaffolding files and context snapshot stay on disk.
The manifest’s appUuid is the source of truth for identity — the <slug> folder name is only a hint derived from the app’s name. Renaming the folder locally does not create a new app. Editing the manifest’s name or description and re-uploading to the same project renames the app in the UI.
Moving an app between projects or instances
Because identity lives in the manifest, the same download-then-upload flow lets you copy apps between projects or between Lightdash instances. Between projects on the same instance — pass--project to target a different project. Because the manifest’s projectUuid doesn’t match the target, the CLI asks you to confirm creating a new app there:
--create-new to opt in explicitly:
lightdash-app.yml at it (updating appUuid, projectUuid, and version together) so future uploads update the new app. Accept if you’re moving the app; decline if you’re copying it and want to keep working against the original — the CLI tells you which manifest fields to edit later if you change your mind. Pass --create-new any time you want to fork an app into a new record, even inside the same project.
Between Lightdash instances — point the CLI at the destination first, then upload:
LIGHTDASH_URL and LIGHTDASH_API_KEY instead of running lightdash login. The destination instance rebuilds the source in its own sandbox — no built artifacts are ever transferred between instances.
Constraints
Before you rely on data apps as code in a workflow, keep the following in mind:- Enterprise only. Both the source and destination instances must have data apps enabled, including the build sandbox. See Self-hosting Data apps for the configuration required on self-hosted instances.
- Fixed dependency set. The sandbox rebuilds against a pre-installed library set. You can edit any source file, but you can’t add libraries that the sandbox doesn’t already provide, and edits to root config files (
package.json,vite.config.js,tsconfig.json, etc.) have no effect on the deployed app. - Semantic layer coupling. A moved app’s queries run against the target project’s fields by name. If a field the app references is missing in the target project, the upload still succeeds and the build still finishes — but the app surfaces query errors at runtime when a user opens it. Check the app in the destination after uploading.
- Concurrent build rate limit. Each project has a cap on how many app builds can run at once. If you upload a large batch and exceed the cap, the server returns HTTP 429 and the CLI reports the error for that app. Re-run the upload for the failed apps once earlier builds complete.
- Bulk download cap.
--include-appsreturns at most the first 10 apps in a space. Use--apps <uuids>to fetch more or to reach apps that aren’t in a space.
Data context and the app model
Data apps don’t ship with their own copy of your data. They run inside a sandboxed iframe with no direct access to the Lightdash API, so every query the app wants to run is proxied through the Lightdash UI hosting the iframe. This means:- Permissions are enforced by Lightdash, not the app. Whoever opens the app sees data based on their own role, group memberships, and user attributes - exactly as if they had run the query themselves in an explore.
- The agent generates code, not data. When the app is being built, Claude sees your dbt model catalog (tables, dimensions, metrics) and any context you attach to the prompt. It writes queries against your semantic layer; it does not get a dump of your warehouse.
- The agent can see anything you attach. Charts, dashboards, images, and sample data you include in the prompt are passed to the agent as context. Don’t include data you wouldn’t be comfortable sending to the model.
Best practices
- Iterate. Most apps get substantially better after a few rounds of iteration. Start with the rough shape, then refine.
- Use images to lock in style. A screenshot of a dashboard, a brand guideline, or even a hand-drawn mockup goes a long way toward getting the layout, typography, and colors right on the first try.
- Attach sample data when content matters. If the app is making decisions based on what’s actually in your data - picking a chart type, writing copy, or formatting values - turn on sample data for the relevant charts. Just remember the agent will see the rows you share.
- Reference existing charts and dashboards. Pointing the agent at a working metric query is faster and more reliable than describing the query in prose.
- Use the network inspector early. If something looks off, check the queries and external requests the app is running before tweaking the prompt.
Troubleshooting
”Breaking Browser Locker Behavior detected” error
If the app preview fails to render and you see a “Breaking Browser Locker Behavior detected” error, this is a false positive from a browser extension - most commonly Malwarebytes Browser Guard. The extension tries to detect “browser locker” scam pages, and its heuristic misfires on the data app preview (likely because data apps can produce pop-ups, such as the print/export dialog used by PDF reports). Other legitimate web apps like Vercel’s v0 have hit the same false positive - it’s a known issue on the Malwarebytes side. To fix it, allowlist Lightdash in Malwarebytes Browser Guard:- Click the Malwarebytes Browser Guard icon in your browser toolbar.
- Open Settings → Allow List.
- Add the Lightdash domain you’re using (for example, your Lightdash Cloud subdomain or your self-hosted Lightdash URL).
- Reload the page.