Live data sources must be enabled for your organization. These steps are the same for every integration; each integration’s page has its own sign-in details, dimensions, metrics and limits.

Connect a live data source

Project admins can add live data sources. You also need access to the tool itself; each integration page lists what it needs.
  1. On the nav bar, click Browse → Semantic Layer.
  2. In the sidebar, select Live data sources, then click Add.
  3. In the Add a live data source dialog, select an integration, then follow the steps on its integration page.
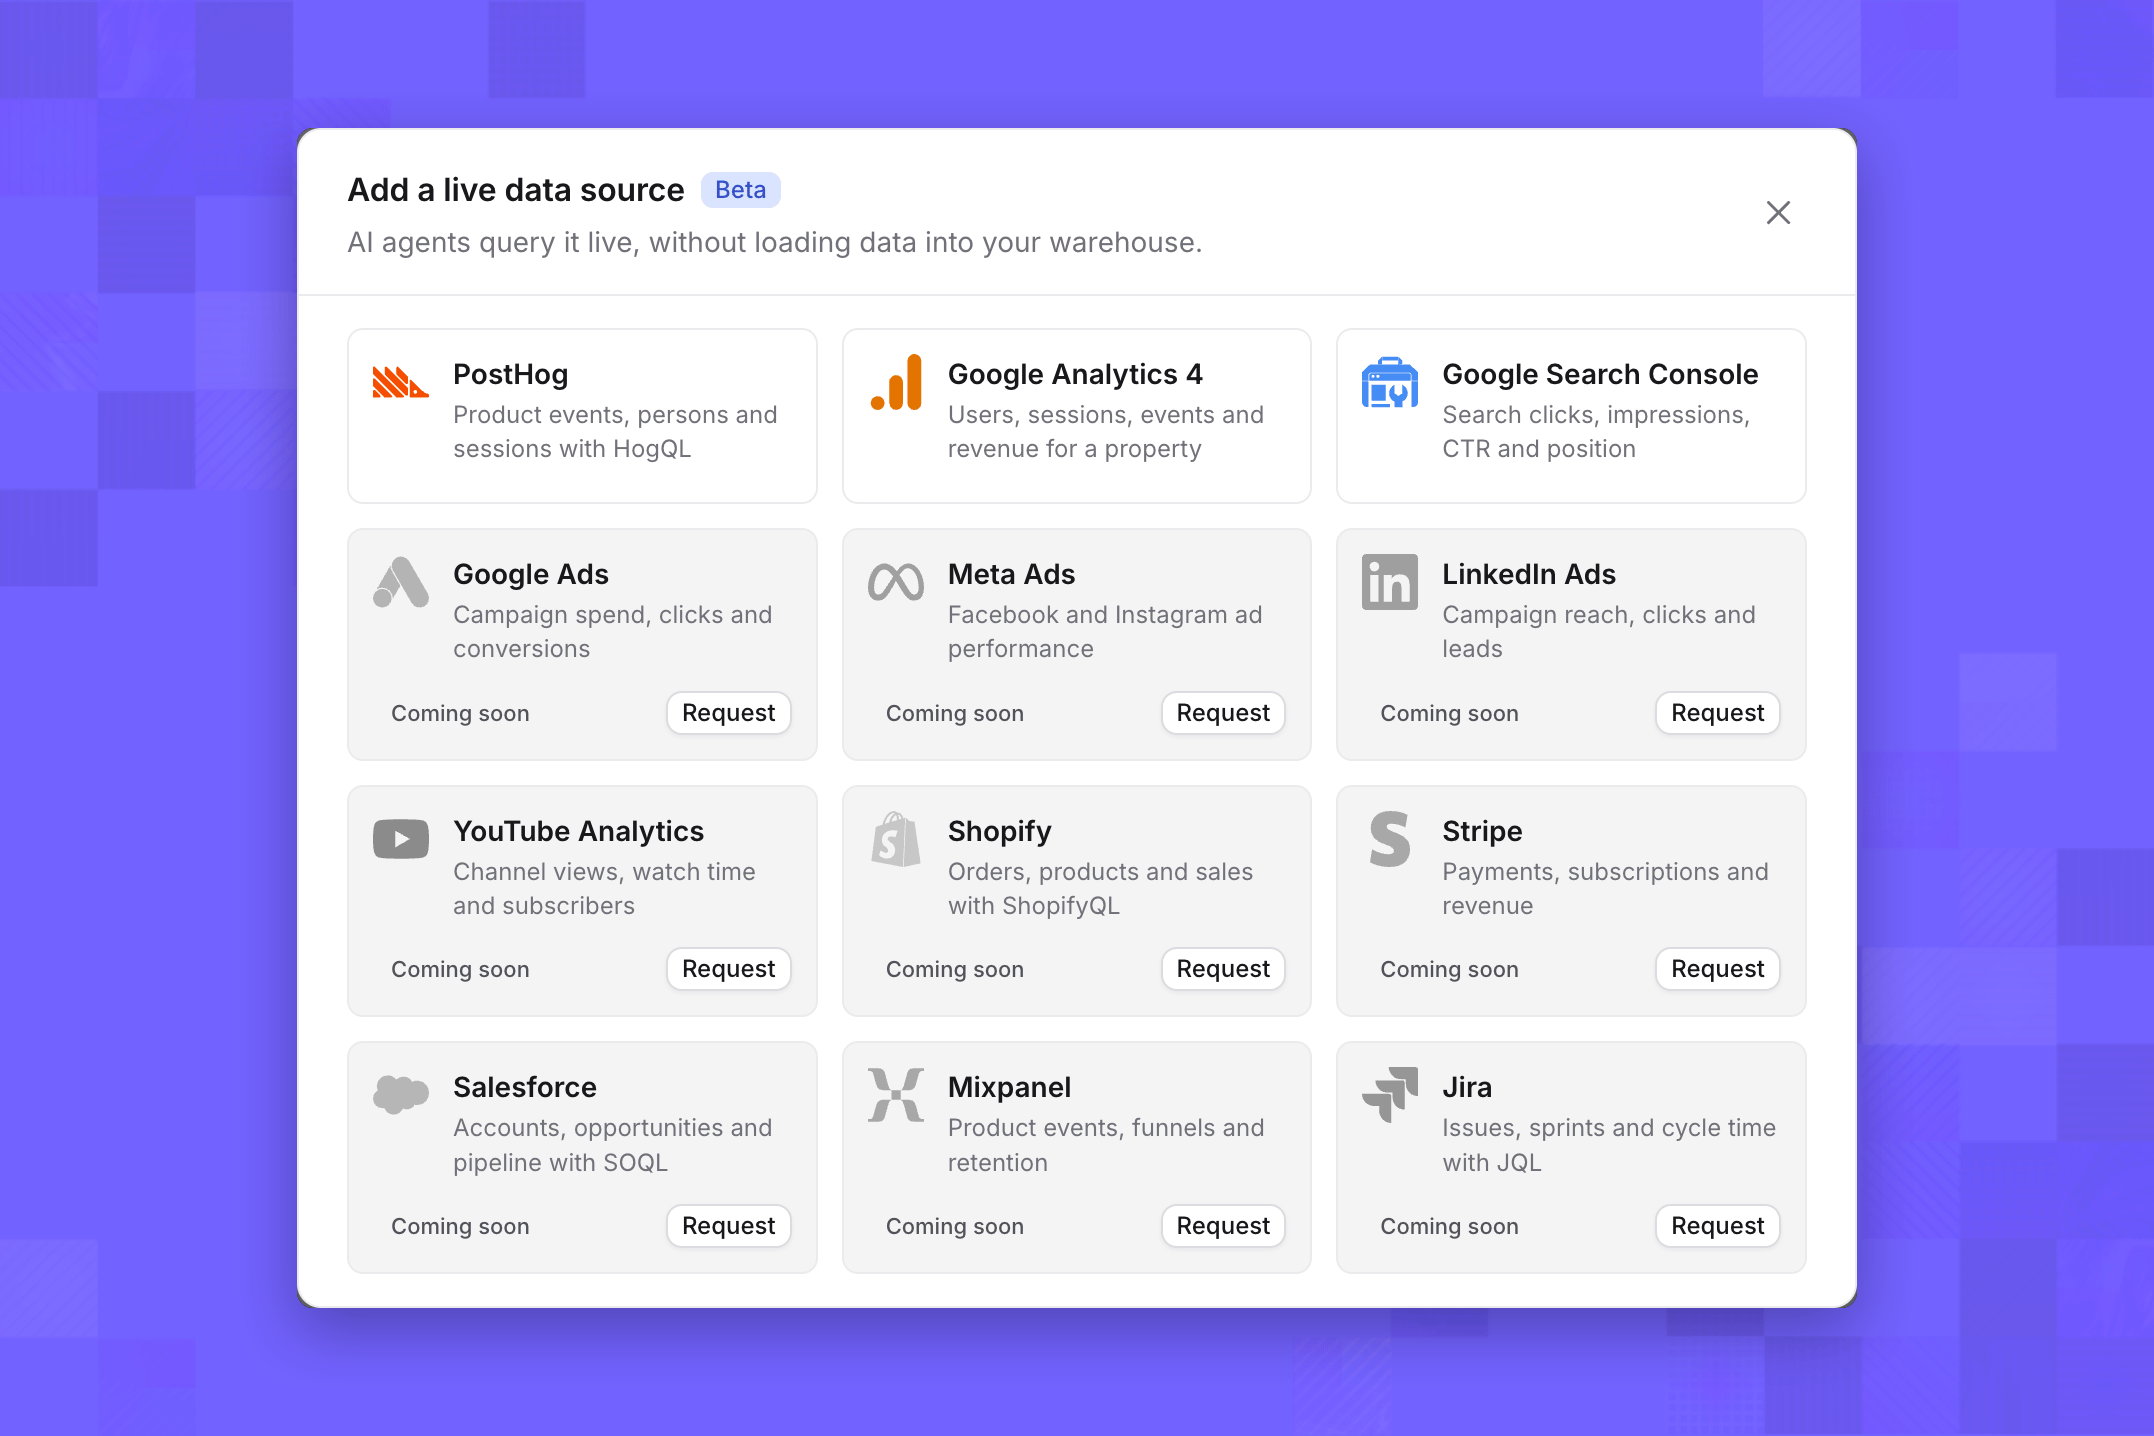
The Add a live data source dialog listing the integrations you can connect, and others with a Request button
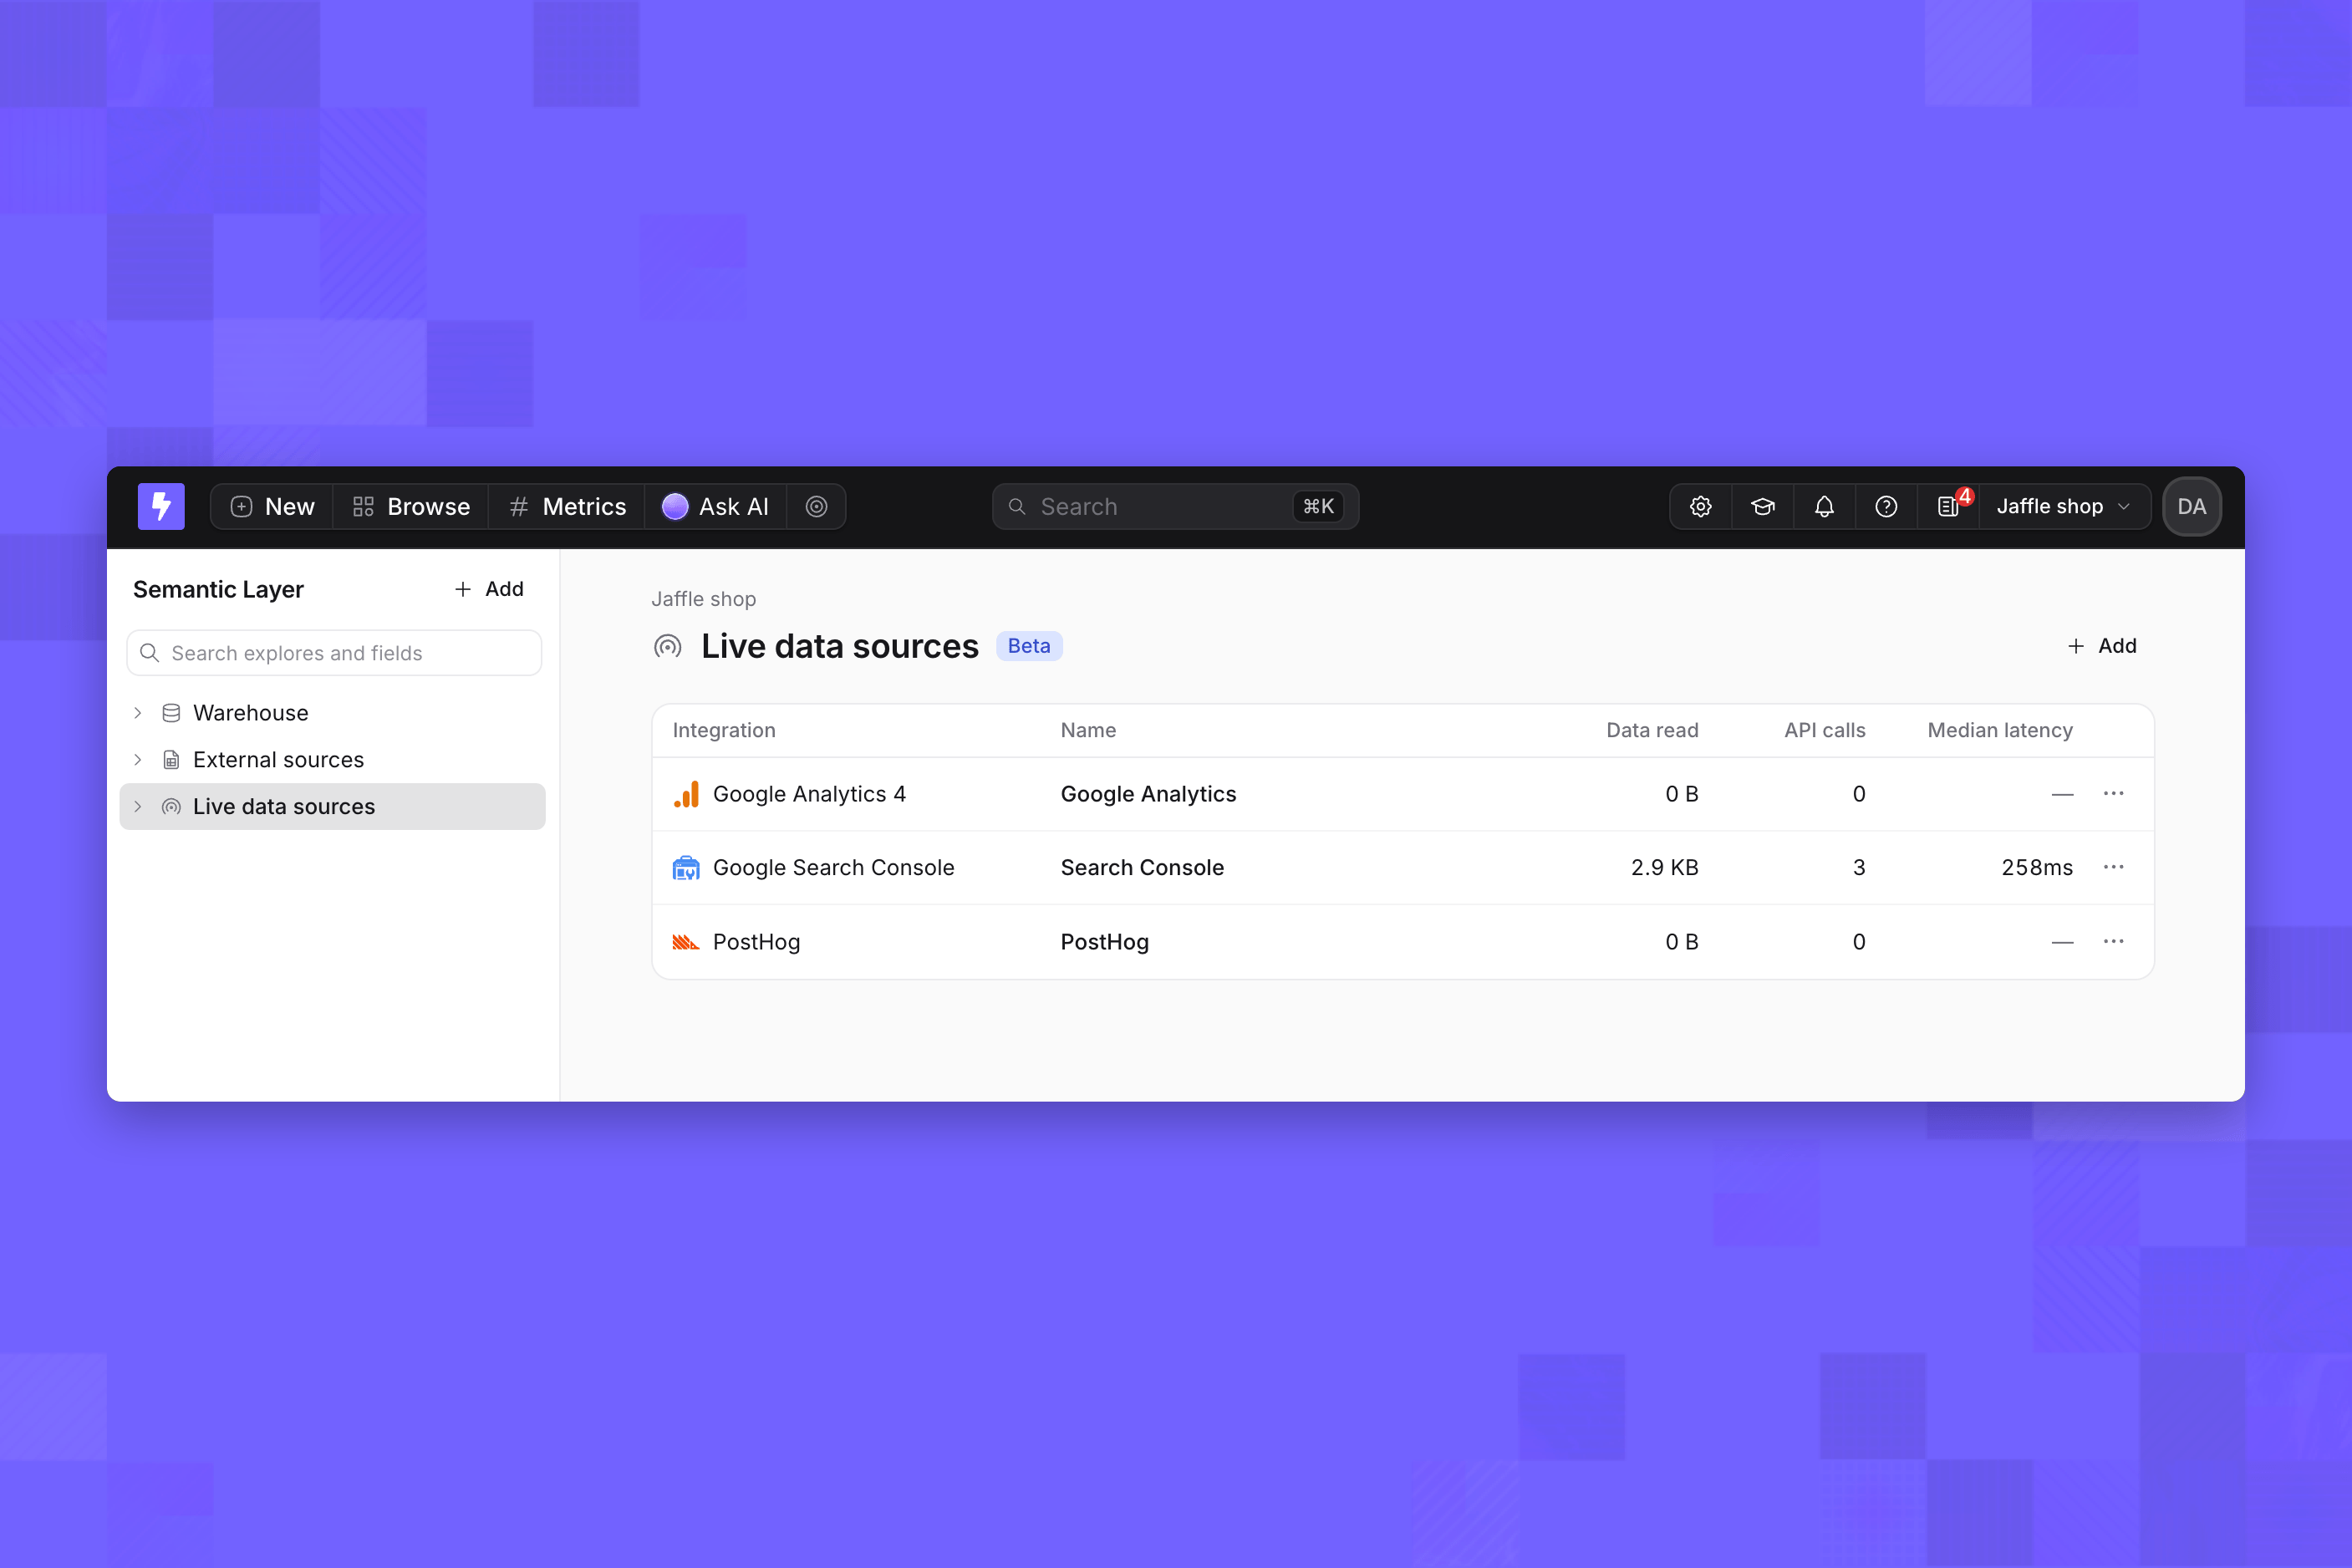
When the source is added, Lightdash reads its dimensions and metrics, and the source appears under Live data sources and as a table in Explore with a Live badge.
The Semantic Layer page with Live data sources selected, listing connected sources with their data read, API calls and median latency
You can connect several sources from the same integration, such as one for each account. Give each a clear name, because people and agents use the name to choose a source.

Dimensions and metrics

Each source starts with the dimensions and metrics its integration offers, plus the ones Lightdash reads from your account, such as custom properties or events. Each integration page lists them. Select a source under Live data sources to see them. Only dimensions and metrics marked In use appear in Explore and to AI agents.
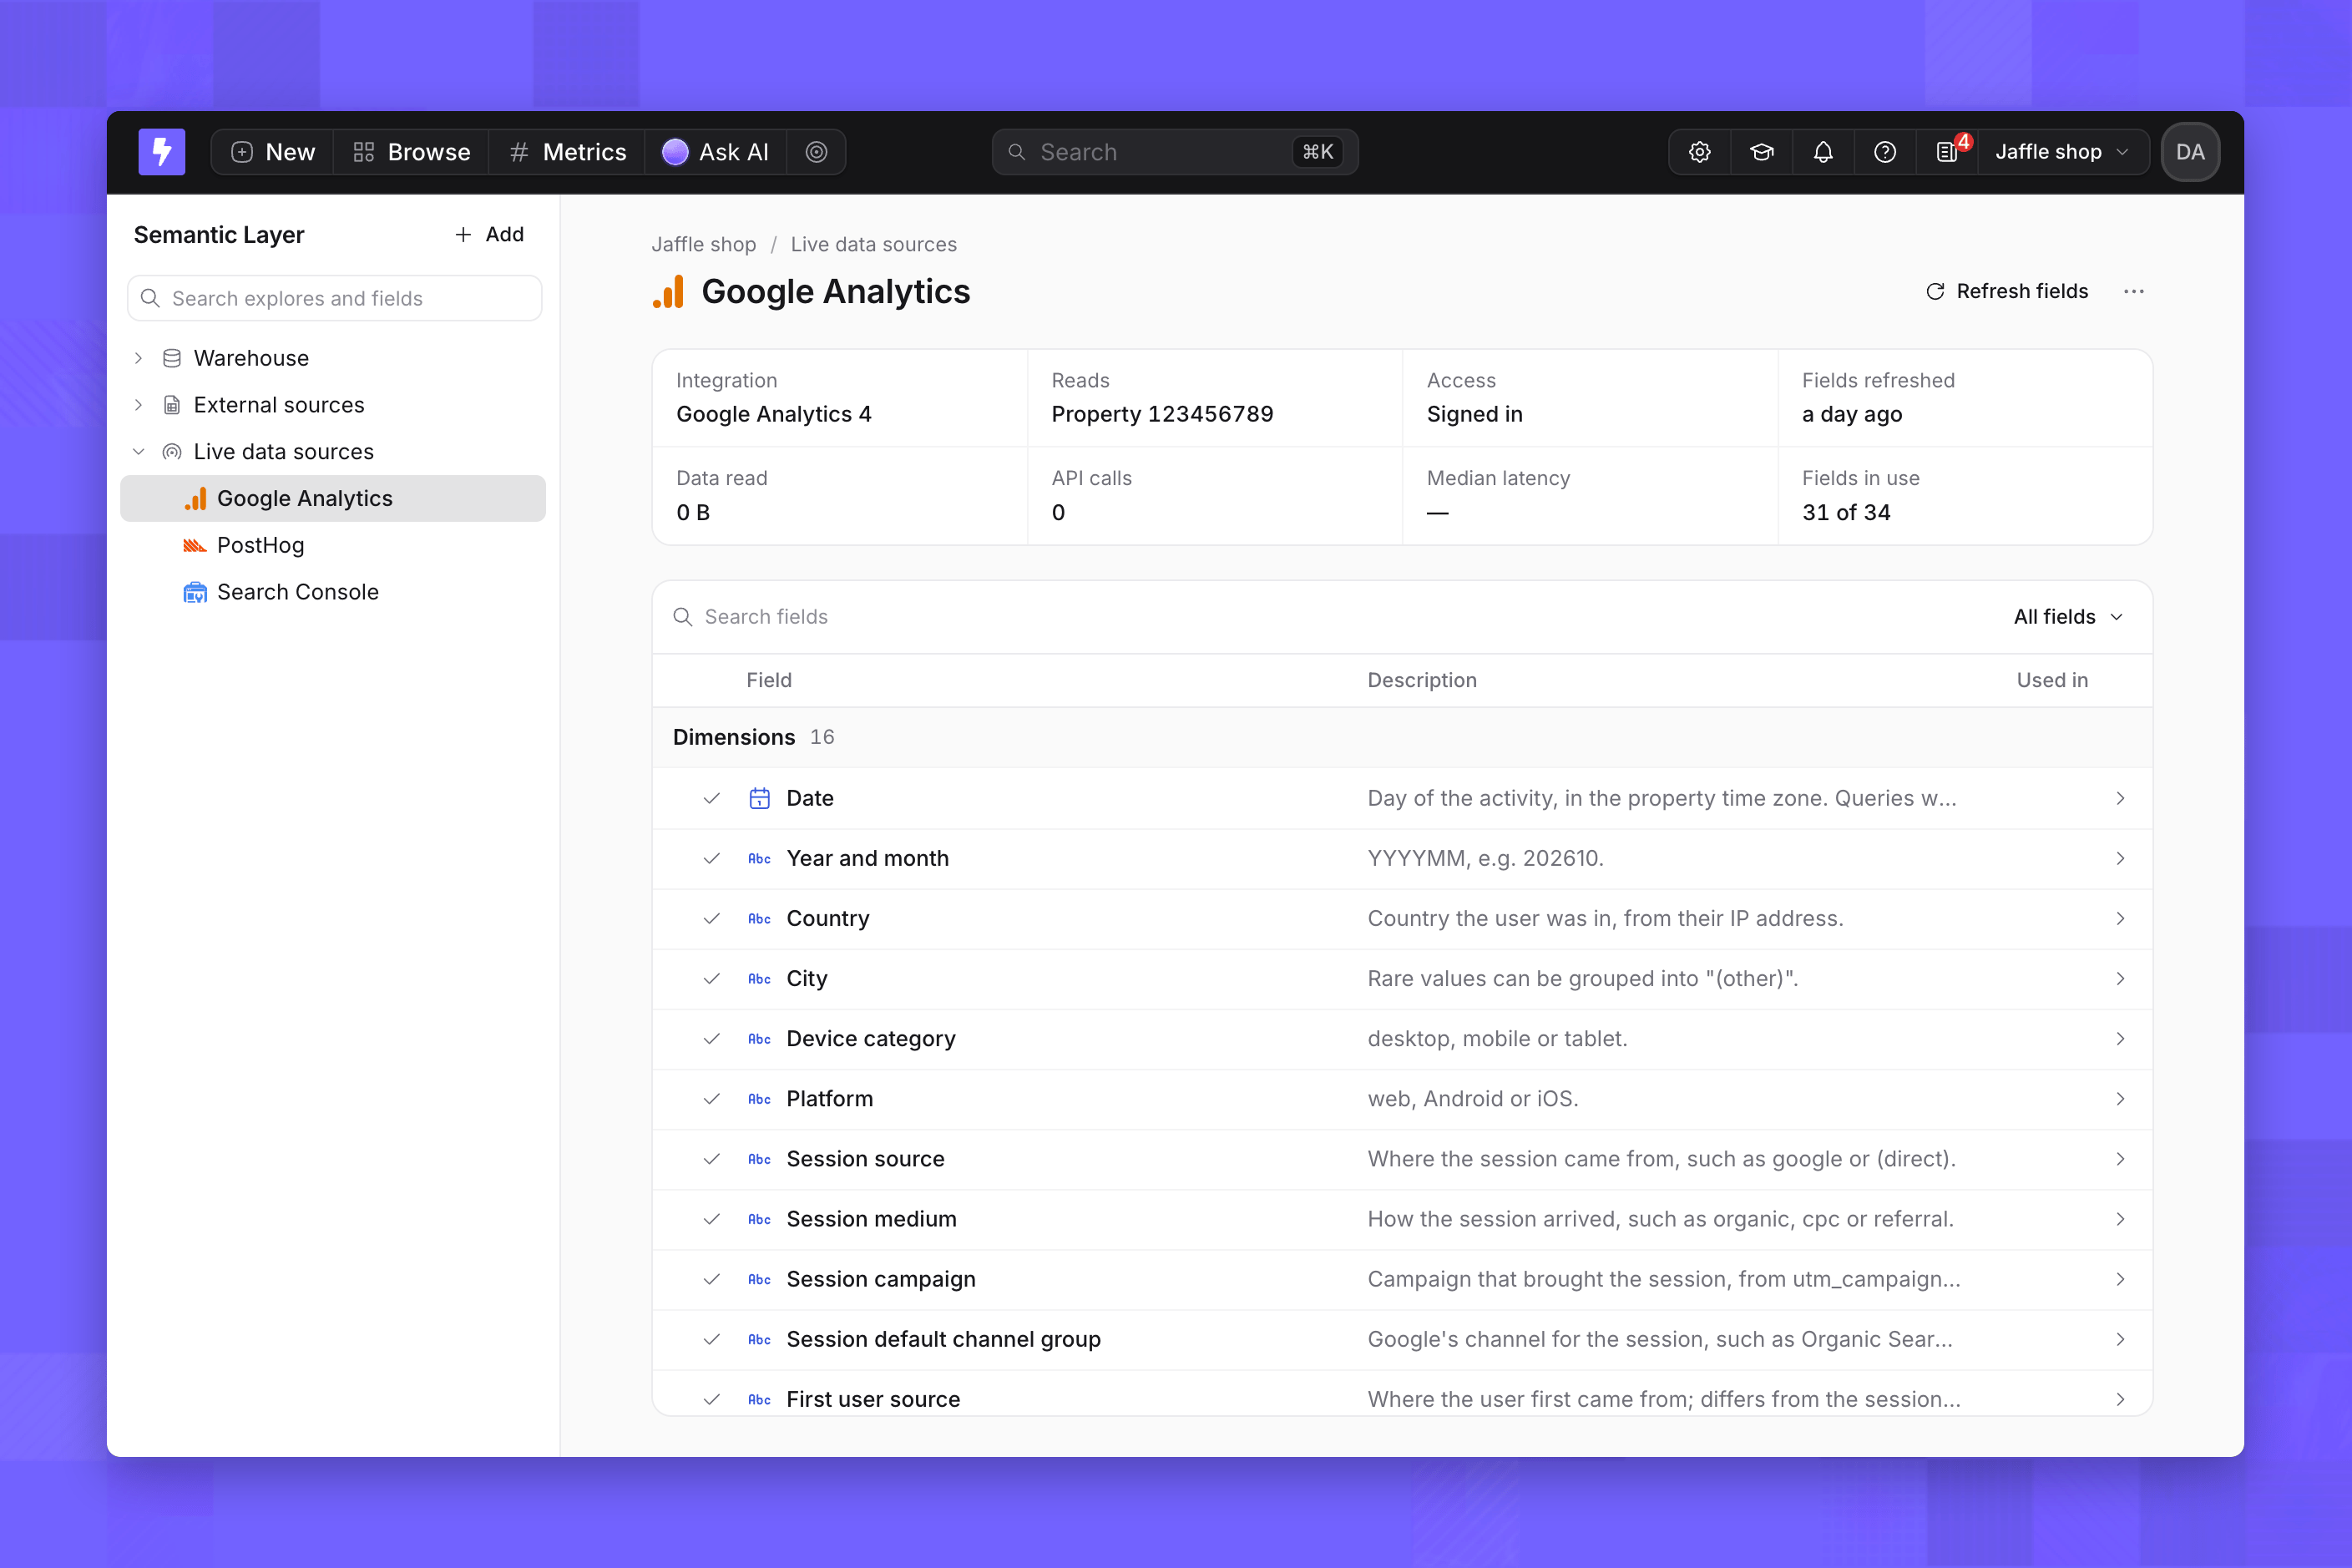
A live data source's page with its integration, access, usage and a searchable list of dimensions with their descriptions
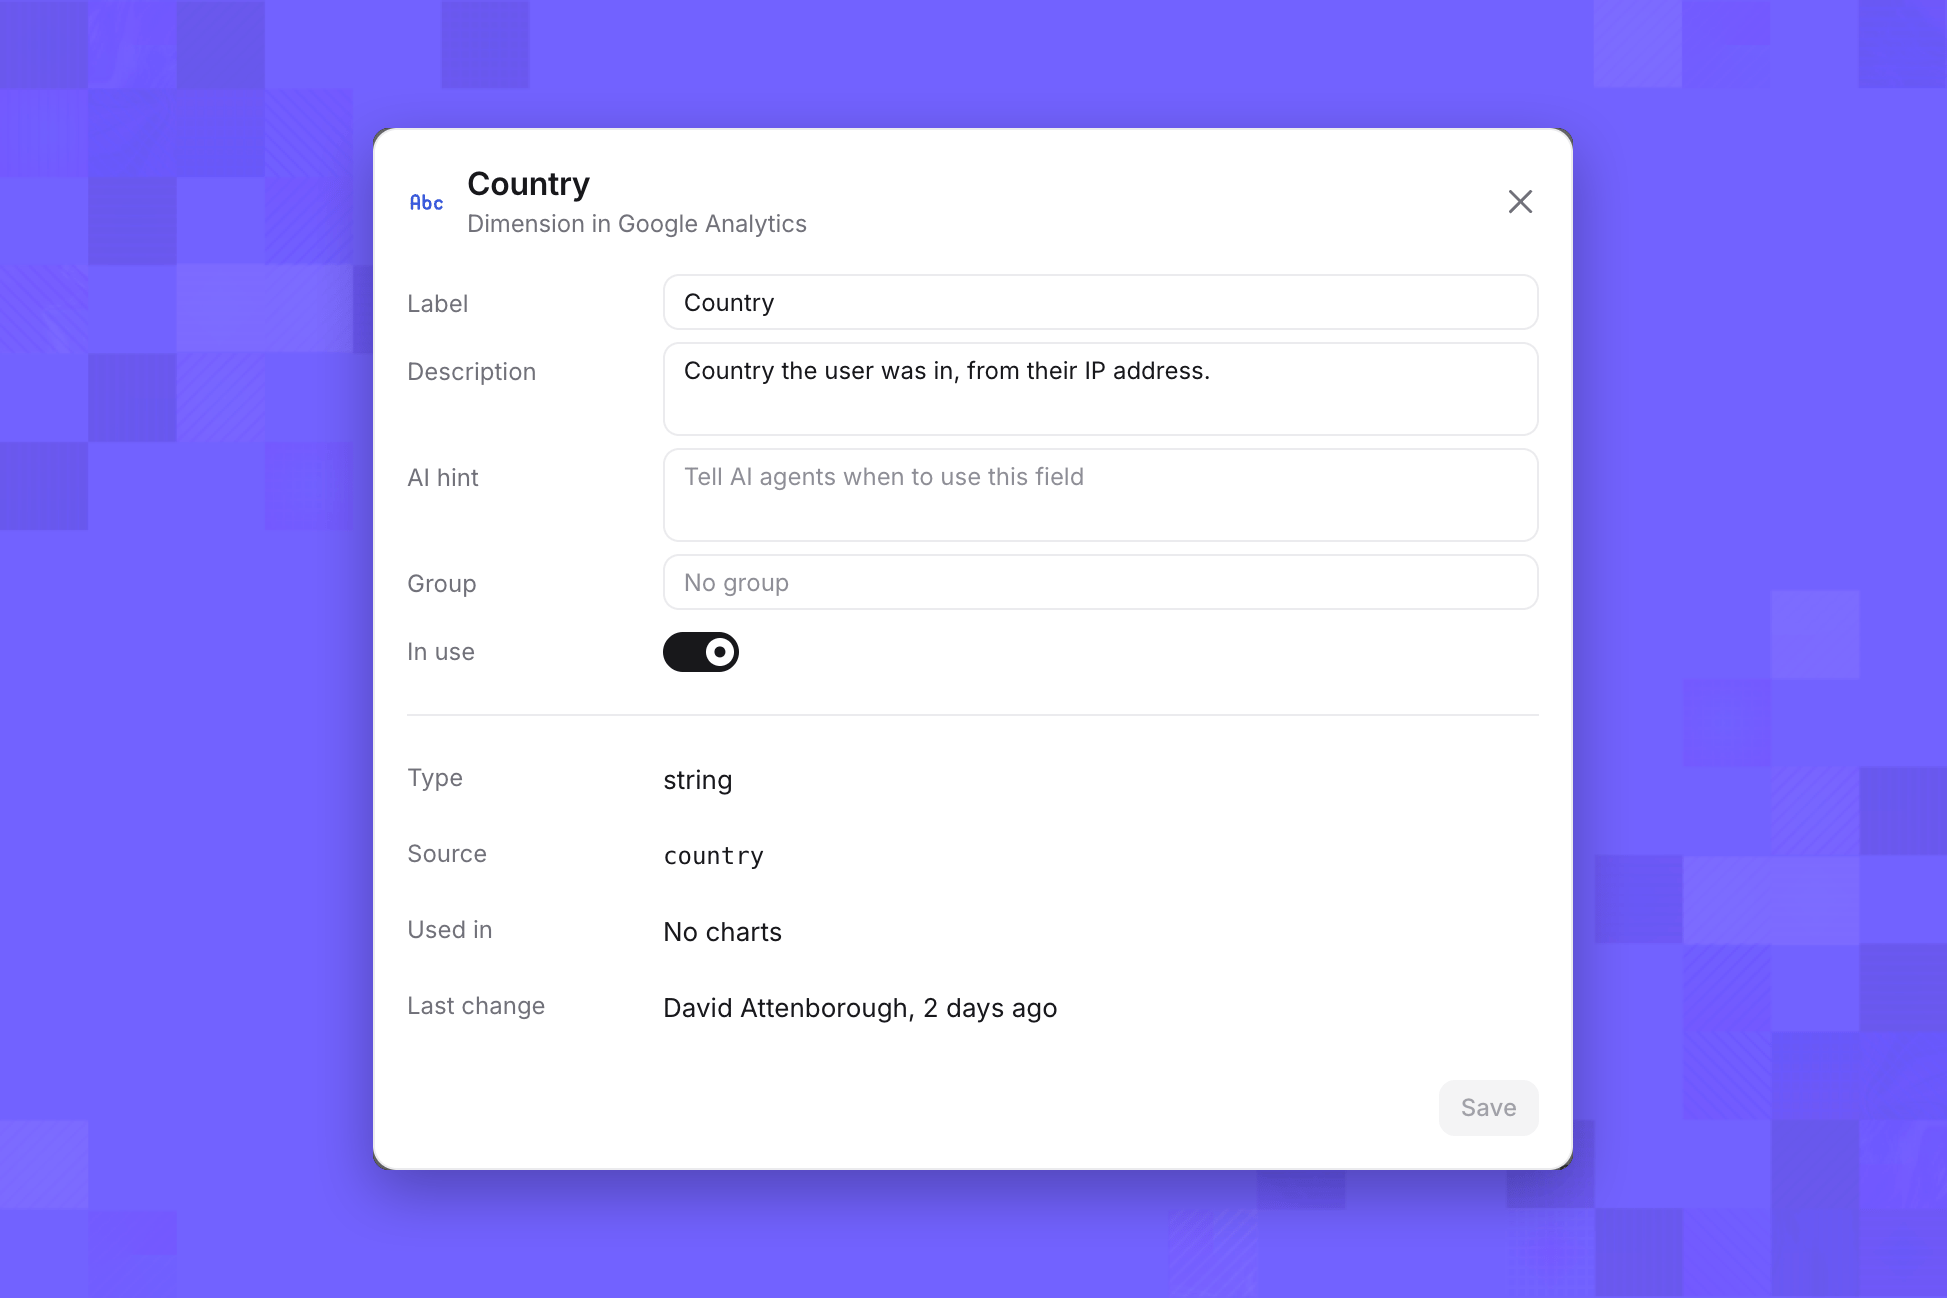
Click a dimension or metric to change its Label, Description, AI hint and Group, or turn In use off. Click Save to apply. Click Refresh fields to read them from the integration again after you add properties or events in the tool. You can’t add dimensions or metrics of your own, or manage them as code.
The Country dimension dialog with Label, Description, AI hint, Group and an In use toggle, and its type, source name, charts that use it and last change below

Explore a live data source

In Explore, open the source’s table, which has a Live badge. Pick metrics and dimensions, and run the query. Each run is one call to the integration.
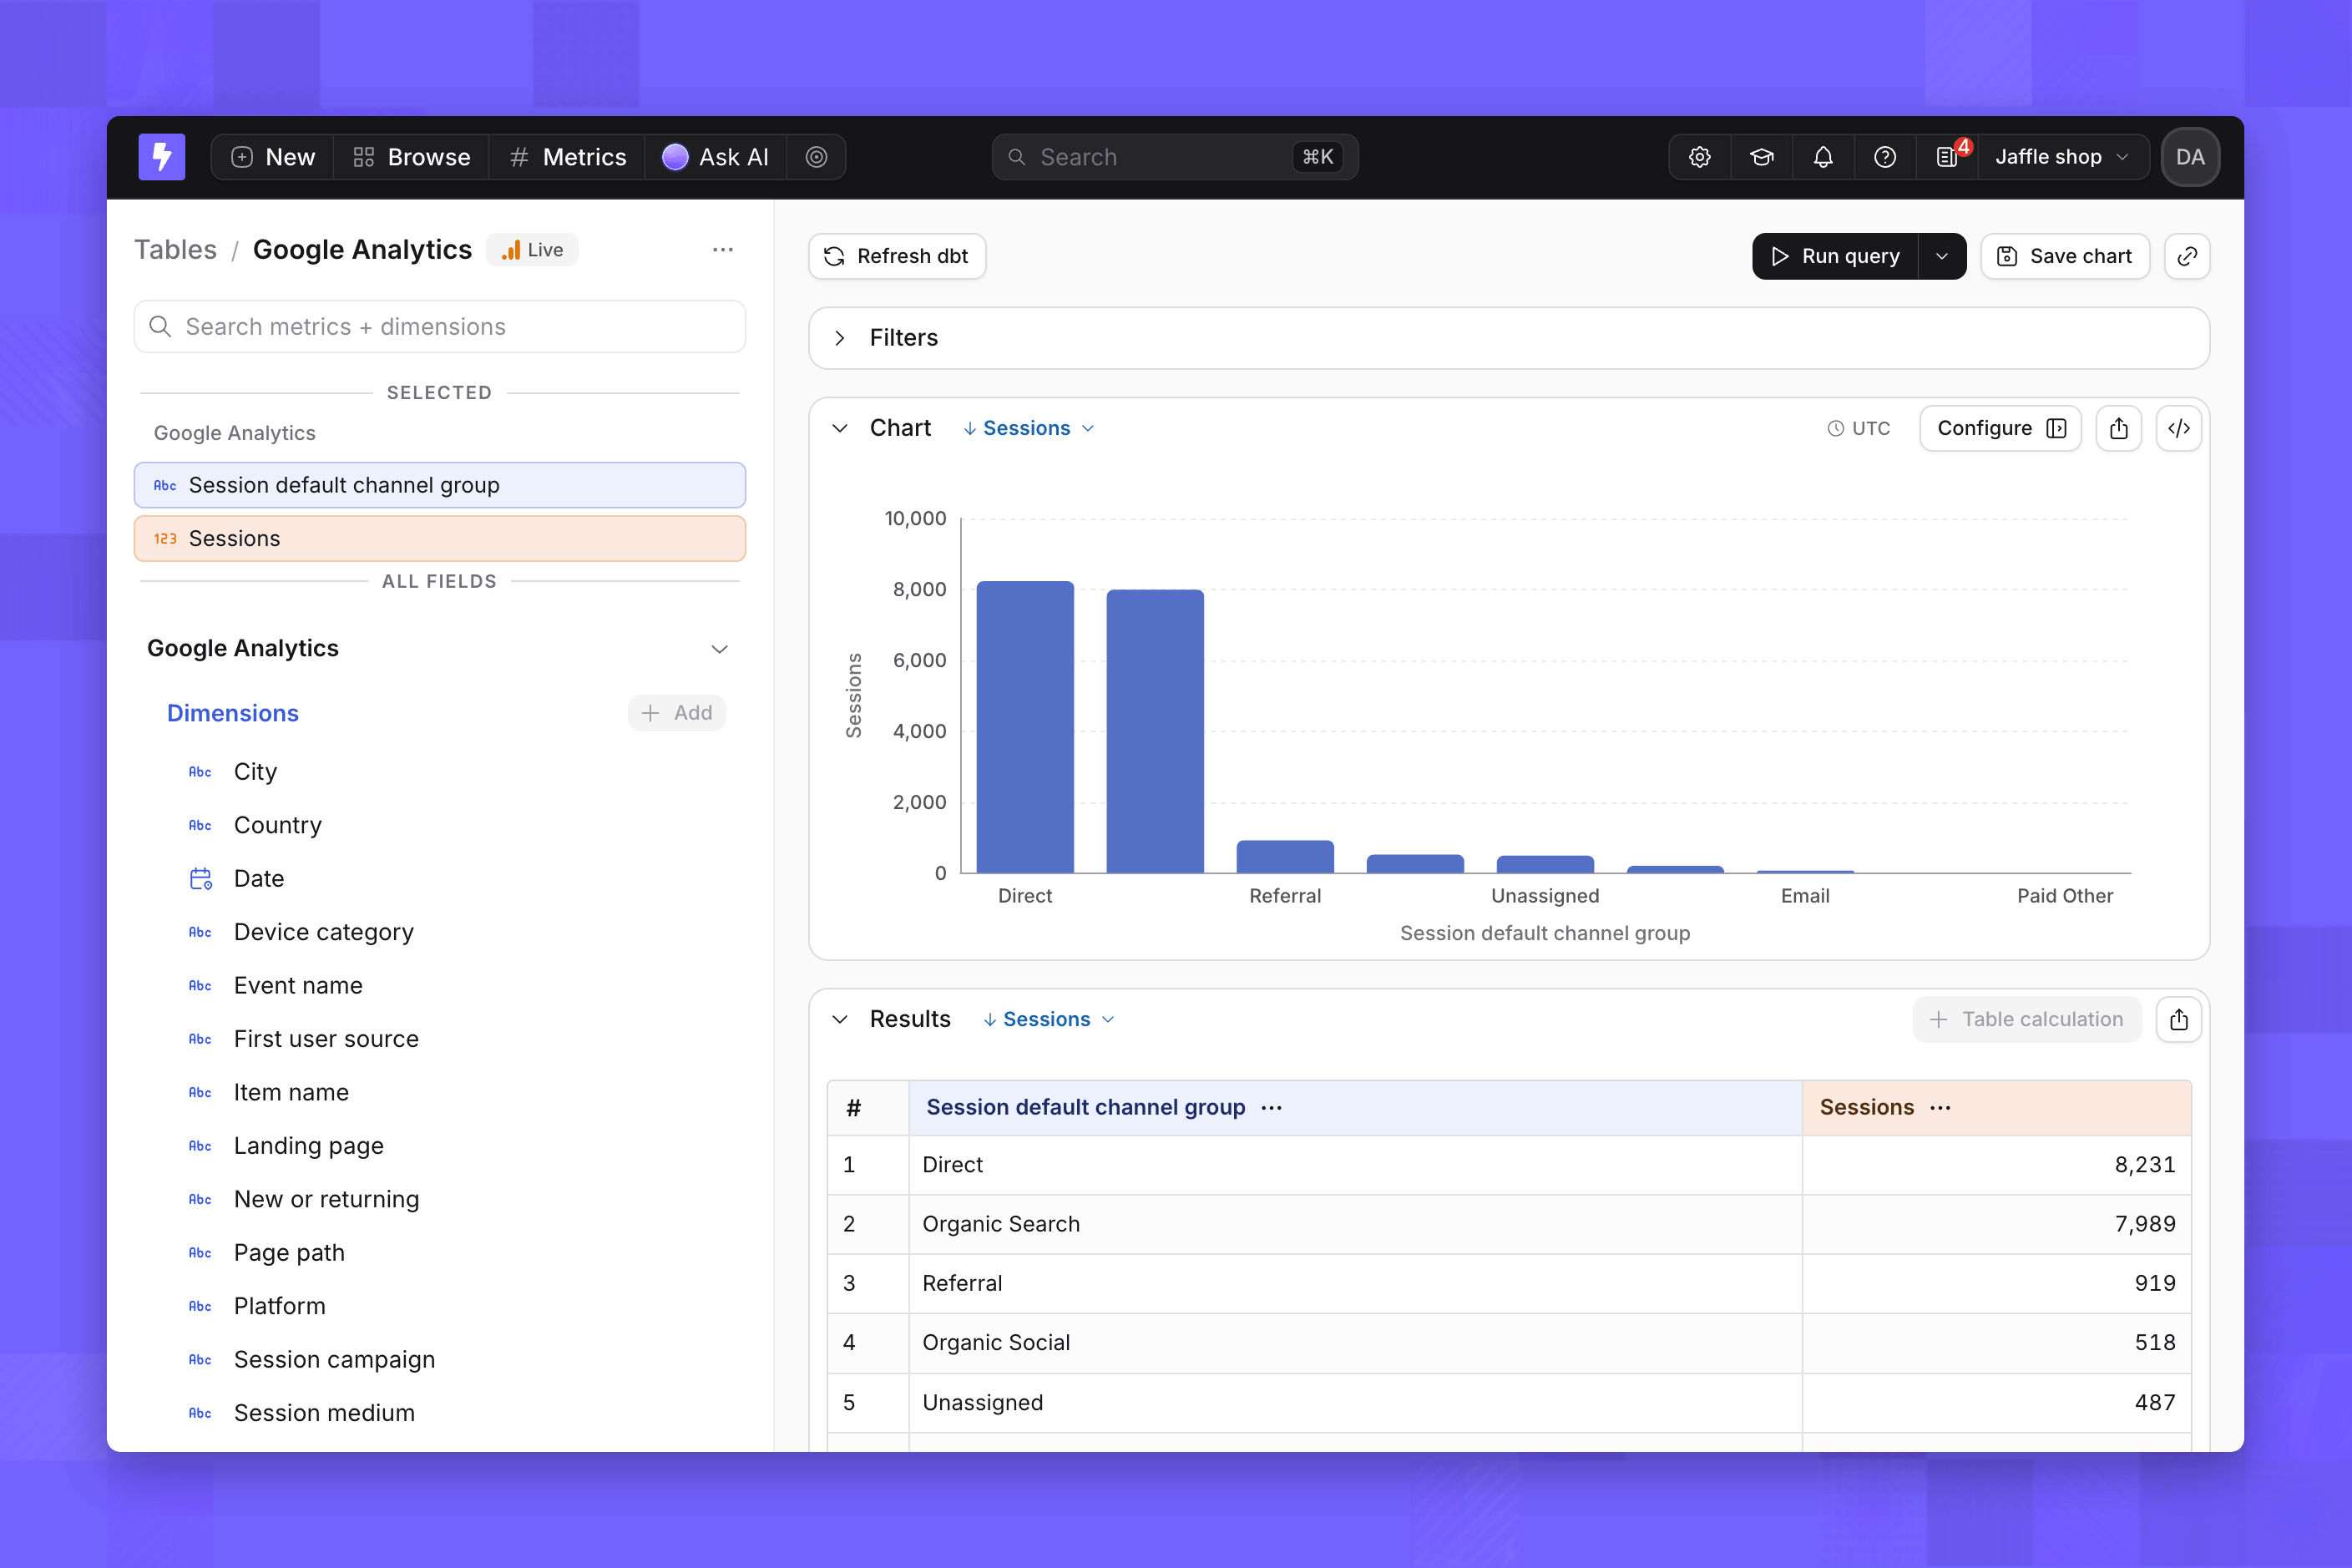
Explore on a live data source with a Live badge, showing a bar chart and results of a metric split by a dimension
Save the result as a chart to add it to a dashboard or a scheduled delivery.

Ask an AI agent about a live data source

Every agent in the project can query live data sources, whatever tags it’s limited to. Ask in plain language; the agent picks the dimensions and metrics, adds a date filter for the period you mention and builds a chart. Name the tool in your question when the project has more than one source that could answer it.
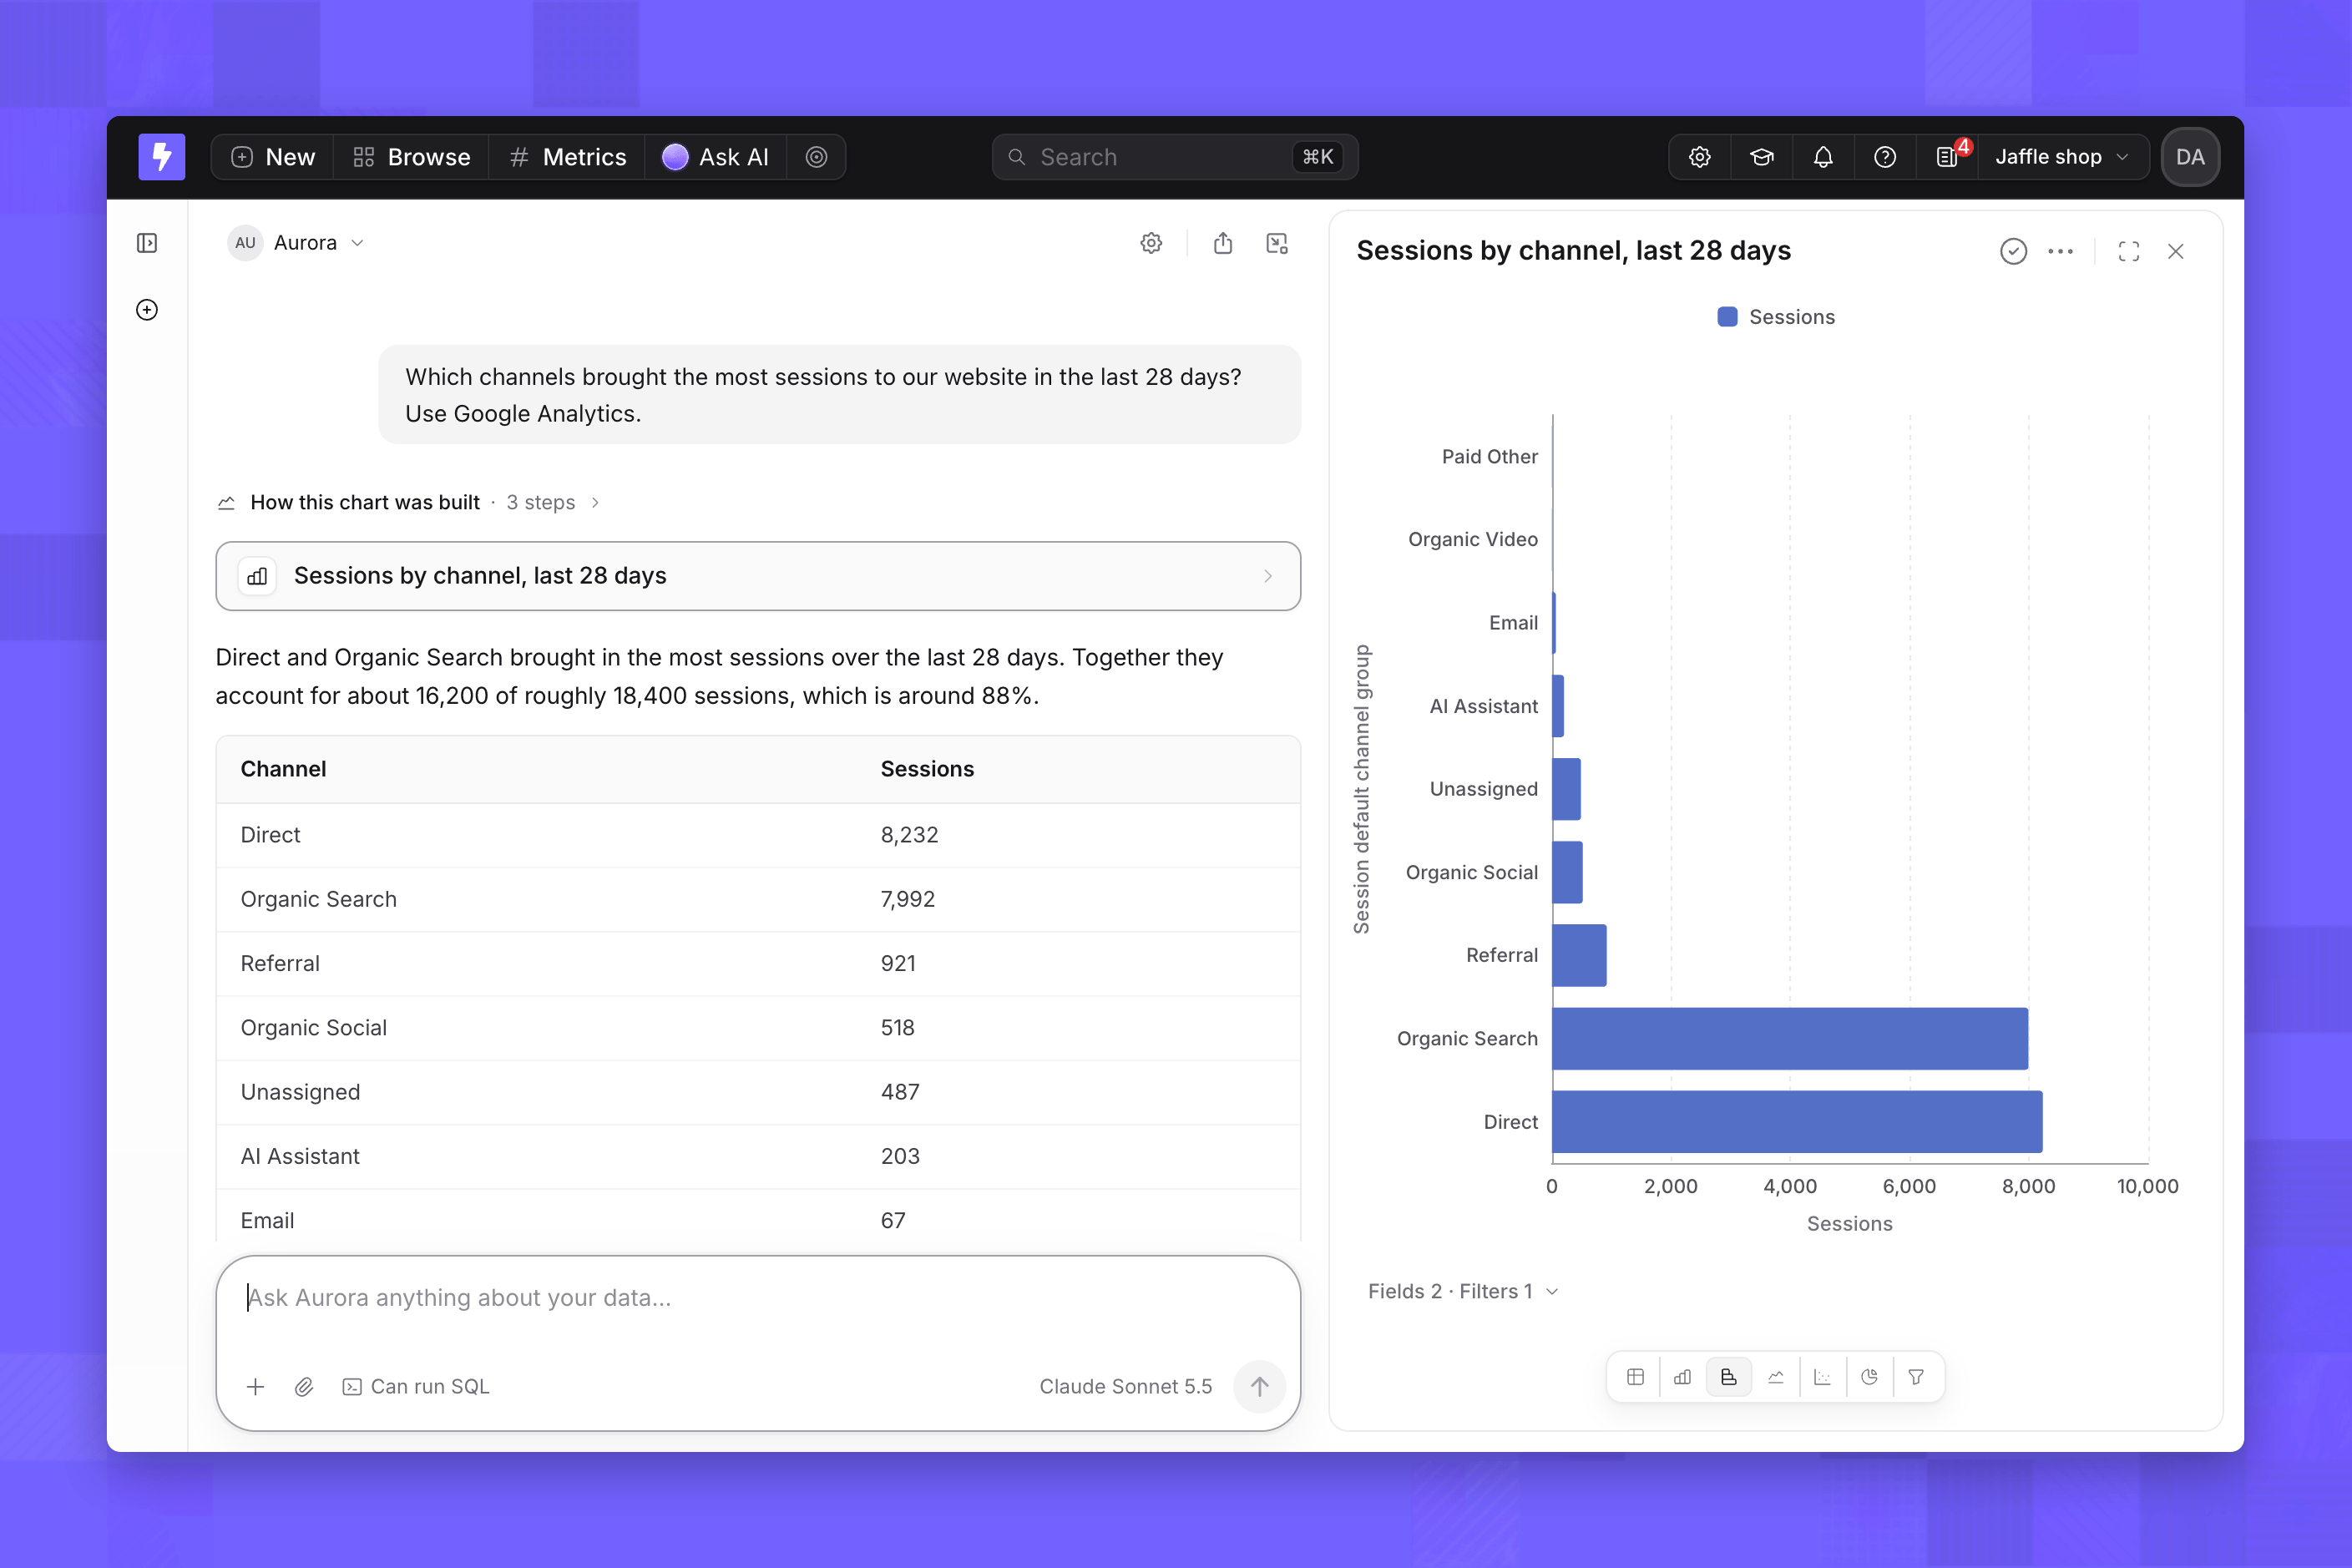
An AI agent thread answering a question from a live data source with a summary, a results table and a bar chart
If a question needs something a source can’t do, such as a funnel, the agent says so instead of approximating it.

Manage a live data source

Open a source’s menu from the Live data sources list or its page. Edit renames it, Refresh fields reads its dimensions and metrics again, Sign in again reconnects it with your account, and Delete removes it and its table.
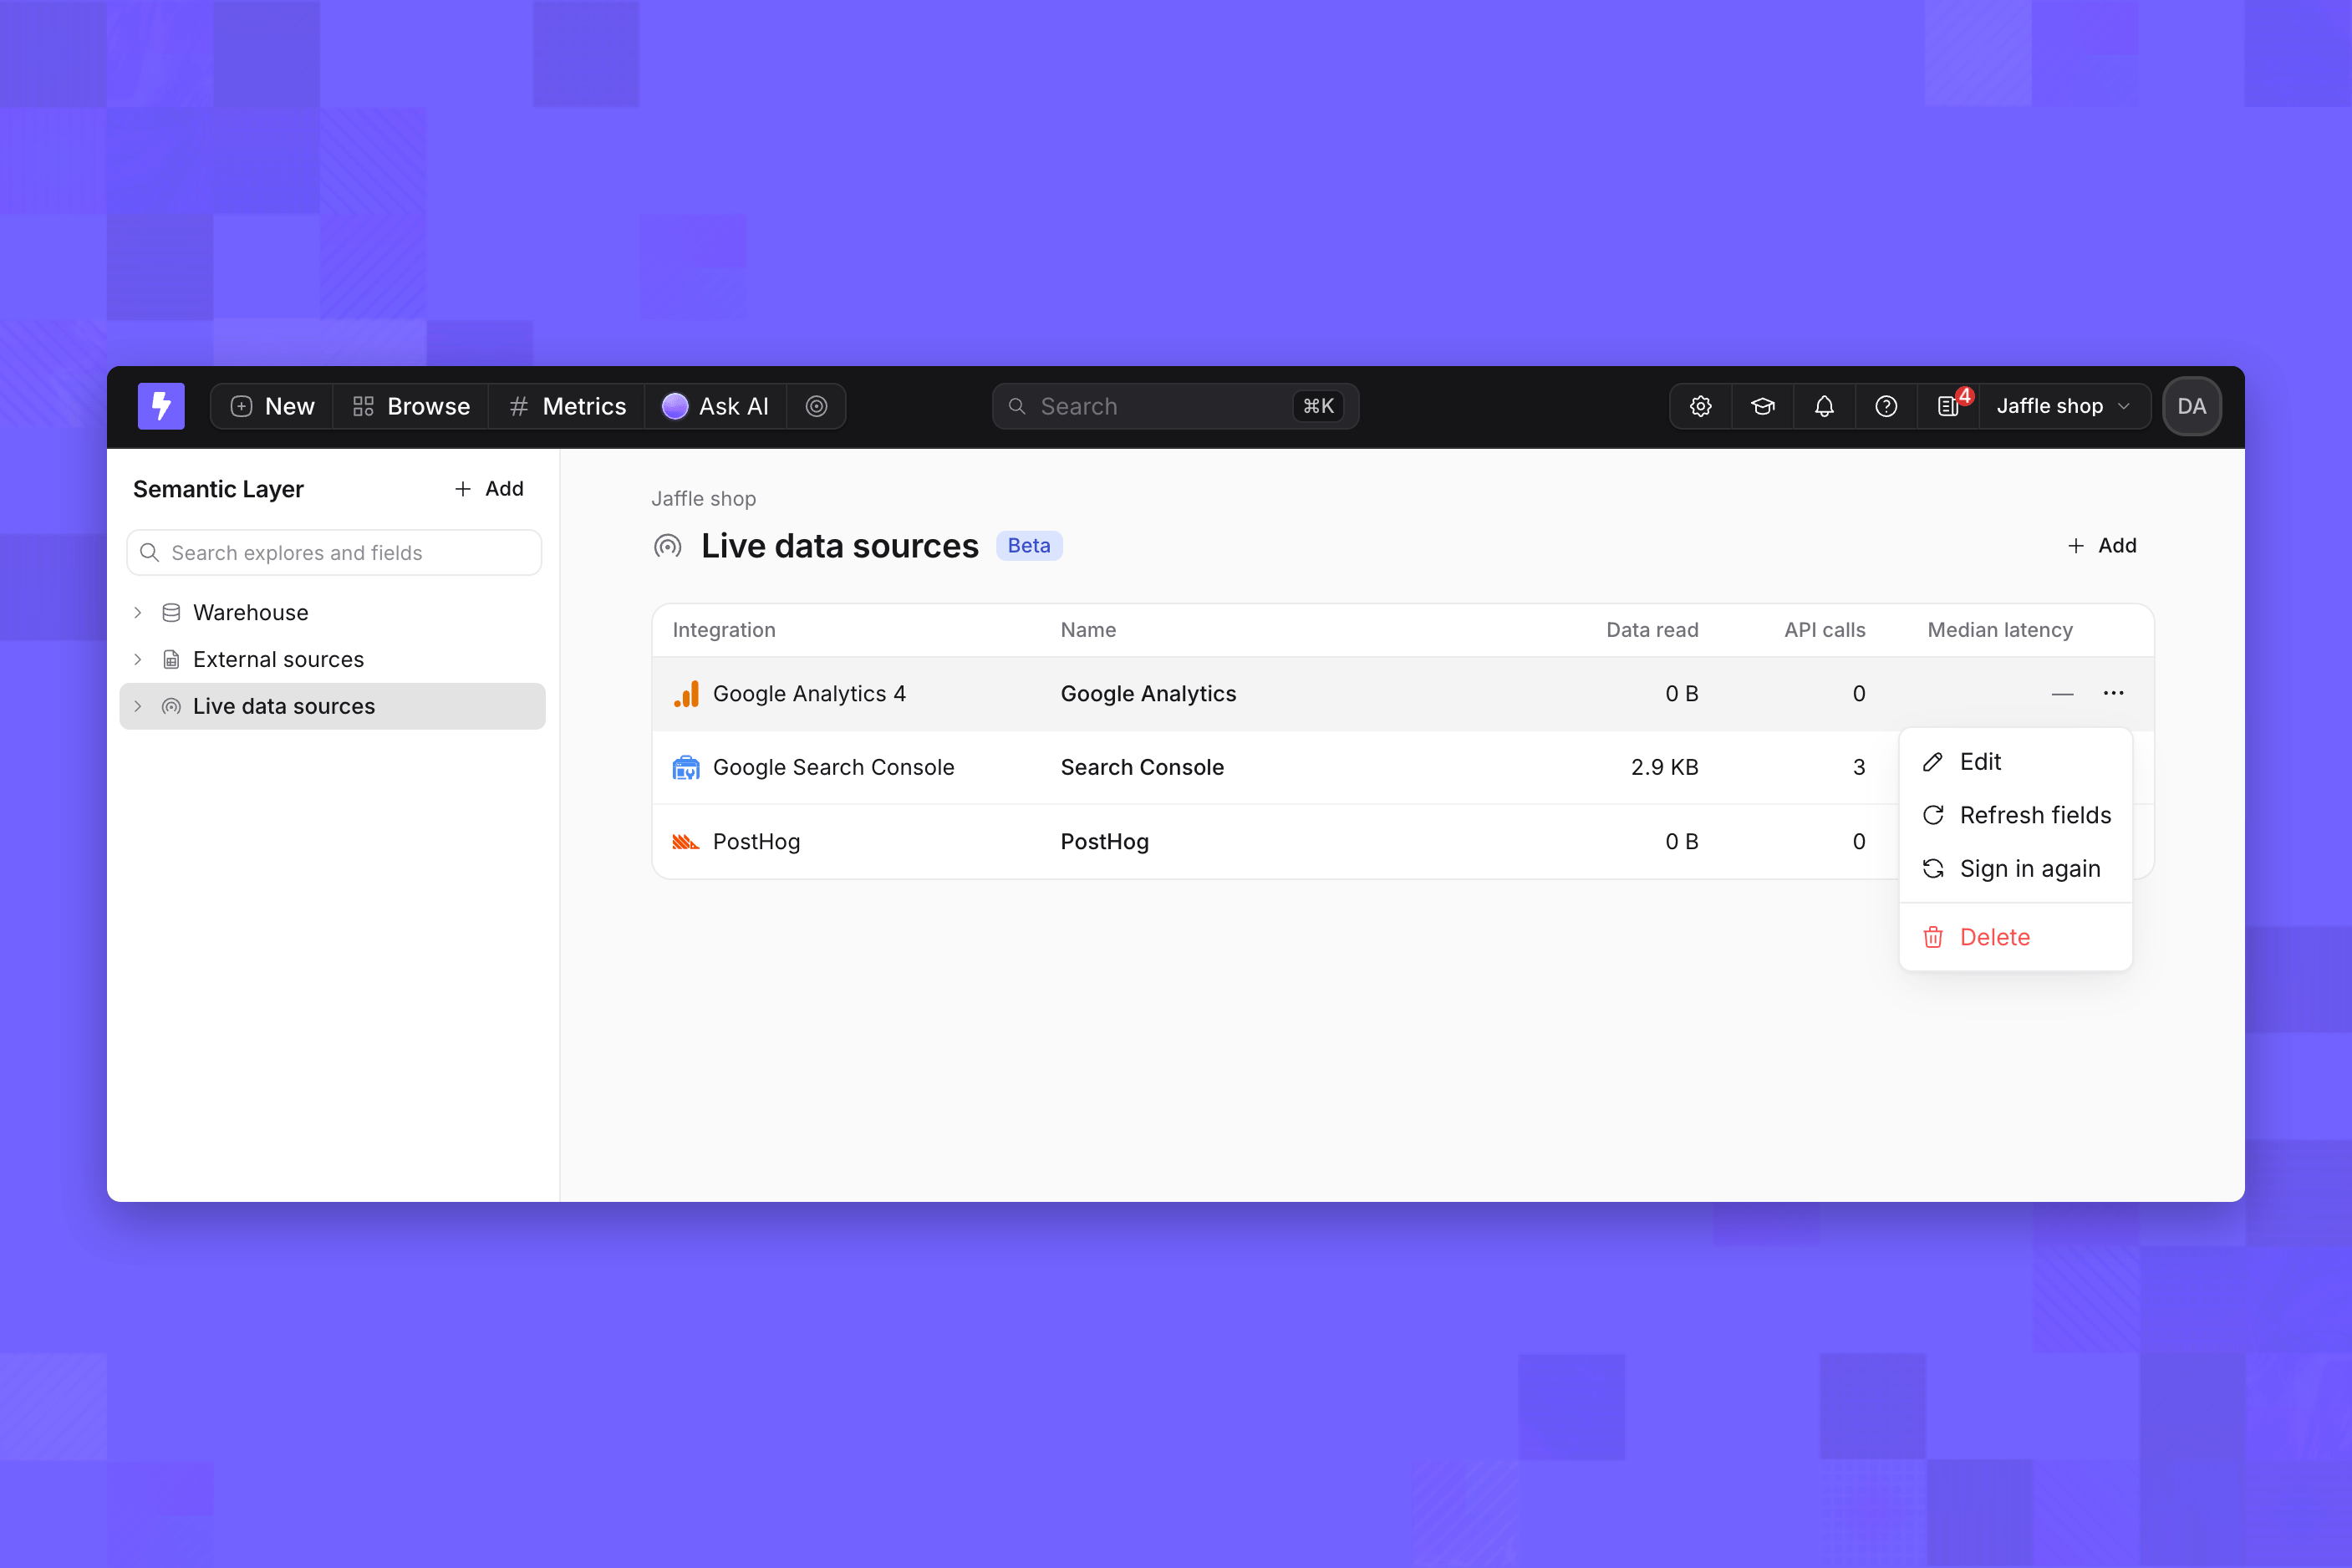
The Live data sources list with the actions menu open on a source, showing Edit, Refresh fields, Sign in again and Delete