

Embedding requires the embedding add-on for Cloud Pro or Enterprise. Get in touch to add embedding to your plan. For self-hosted deployments, follow embedding setup.
Overview
Dashboard embedding displays a full Lightdash dashboard in your application — multiple visualizations, filters, tabs, and interactive features — so you can give users comprehensive analytics views without a Lightdash login. Embed it with a plain iframe or the React SDK.When to use dashboard embedding
- Executive dashboards: multiple KPIs and metrics in admin panels
- Customer-facing analytics: analytics portals for SaaS customers
- Embedded reporting: comprehensive data views inside your workflows
- Multi-chart views: related visualizations with shared filters
What you can put on an embedded dashboard
An embedded dashboard renders the same tiles it does in Lightdash: saved charts, SQL Runner charts, data app tiles, and markdown, Loom, and heading tiles, organized across multiple tabs. A saved chart using a custom chart type renders the same way on the tile, fonts and styling included — see Known limitations.SQL Runner chart tiles are authorized through dashboard-tile membership, so they render with existing embed JWTs — you don’t need to regenerate tokens or change embed URLs. A SQL chart is only embeddable as part of a dashboard; a chart-scoped JWT (
type: 'chart') can’t embed one on its own.Set up a dashboard embed
Embedding always starts with the shared setup: create an embed secret, add your dashboard to the allowlist, preview it, and generate tokens from your backend. Follow the embedding quickstart for those steps. The only dashboard-specific part of setup is the allowlist: only dashboards added to the allowed dashboards list can be embedded. Add yours under Settings → Embed, or toggle Allow all dashboards to embed any dashboard in the project.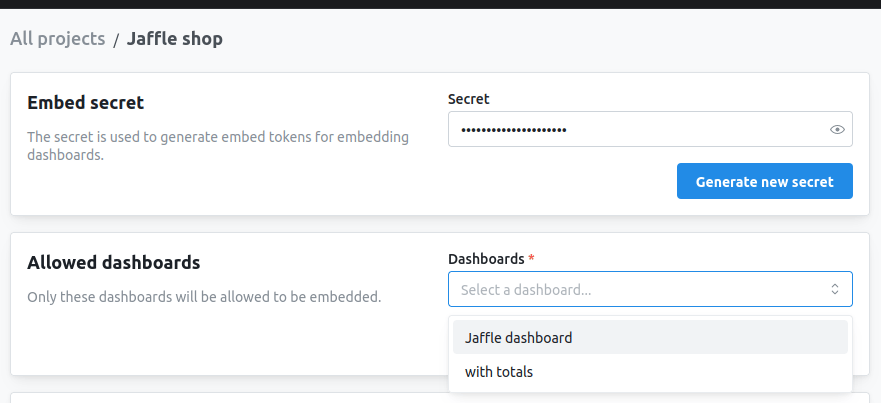
Configure what viewers can do
By default, dashboard interactivity is controlled by fields nested inside the JWTcontent object: filters, parameters, exports, date zoom, Explore, underlying data, and data app tiles. To manage capabilities through the actor’s role, follow Permission modes. Adding a writeActions claim also lets viewers save charts from Explore or edit and build dashboards through the SDK.
For the full list of options, their accepted values, and per-option UI screenshots, see the dashboard token and interactivity options in the embedding reference. A token that exercises the common ones looks like this:
ld-dashboard-guided-setup class.
Embedded dashboards have no Refresh button. How fresh their data is depends on the project’s results cache duration.
Embedded viewers can’t create or manage scheduled deliveries. To let your users schedule a dashboard from your own app, create the delivery through the Lightdash API with POST /api/v1/dashboards/{dashboardUuid}/schedulers, authenticated as a Lightdash user or service account. The request accepts dashboard filter overrides, parameter values, and selected tabs, and Lightdash runs and sends the delivery like any other.
Let viewers save and edit content
Add awriteActions claim to let embedded users save a new chart from Explore, or — through the React SDK — edit an existing dashboard or build a new one. Lightdash performs the write as a configured actor (a service account or user) into the spaces the token names. See Write actions for the claim and Lightdash.Dashboard edit mode for the SDK flow.
In dashboard edit mode, if the token also sets canExplore: true, the add-tile menu has New chart and tiles whose chart is in a write space have Edit chart. Both open Explore in place: a new chart is added to the dashboard as a tile, and saving an edited chart updates its tile.
Charts created with New chart or Save as new chart are saved to the dashboard itself, the same as creating a chart from a dashboard in Lightdash. They don’t appear in any space’s chart list, and removing their tile and saving the dashboard deletes them. If the dashboard isn’t in one of the token’s write spaces, Lightdash saves the chart to the first write space instead. With the React SDK, you can save these charts to a write space, or let users choose, with the chartSaveDestinations prop. Iframe embeds always save them to the dashboard.
Newly saved charts aren’t added to the embed allowlist, so they won’t be re-embeddable unless you add them explicitly.
View data apps
Data app tiles run their own metric queries, so they only render when the JWT setscanViewDataApps: true. When it’s off (the default), the tile shows a placeholder and no queries run. When on, the data app inherits the embed’s user attributes and filters, so row-level access still applies — only enable it for audiences you trust with the data the app can query. For standalone data app embedding (no dashboard), see How to embed data apps.
Lightdash’s floating Ask AI launcher never appears in an embed. If you see a chat window or modal you didn’t add, it comes from a data app tile’s own code, a separately integrated AI agent embed, or your host page. Open the same dashboard directly in Lightdash: if it appears there too, it belongs to the dashboard’s content; if not, check what your page renders around the embed.
Embed with an iframe
iframe embedding needs no libraries or CORS. Pass the project UUID in the path and the JWT in the hash fragment; the dashboard is identified bycontent.dashboardUuid inside the token, not the URL:
theme, backgroundColor, and timezone), responsive and dynamic sizing, token refresh, and troubleshooting.