

Start a conversation
Open Ask AI in your project and select an agent from the dropdown to start a new thread. If routing is enabled, select Auto to let the AI Router choose an agent for your request. The agent’s page shows its name and description above the message input. If the agent has instructions, the info icon beside its name shows them. Type your question in the message input and click the send button.Conversations and saved results
The agent uses the current thread’s history to answer follow-up questions. A separate conversation starts without that history. Lightdash stores conversations and the query definitions behind their charts and tables until you delete the thread or its retention window expires. When you revisit a result, Lightdash queries the warehouse again, subject to caching. The written reply stays as it was, so a chart can show different numbers from the surrounding text if the data or models have changed.Composer options
The + button in the message input opens the composer options. A check mark shows which options are on. The options you see depend on your permissions and your organization’s settings:- SQL Runner turns on SQL mode for the conversation. It appears if you can use the SQL Runner.
- Deep research turns your question into a deep research run, a long-running investigation that ends in a report. It appears when deep research is enabled and your role can start runs.
Attach a file
Select + in the message input and choose Attach a document, or drag a file straight into the chat box — the composer shows a Drop files to analyze them overlay while you drag. On self-hosted deployments, dragging and dropping a file needs Lightdash v2.425.0 or later; attaching through the + menu works on any version. The document picker accepts.md, .markdown, .txt, .json, .yml, .yaml, .sql, .log, .xml, .html, .toml, .csv and .tsv, and the server accepts any UTF-8 text file regardless of extension. Excel files (.xlsx) can’t be attached — export the sheet to CSV first.
Each file is limited to 1 MB. A prompt inlines only the first 32 KB of its attached files, combined, into the model’s context; the agent reads anything beyond that straight from the attached files.
If external sources are enabled for the project and you can manage them (Editor role or above), the menu also offers Attach a CSV. A CSV or TSV file you drop or pick imports as a queryable external source, so the agent can query it alongside warehouse data. Otherwise it attaches as a plain text document. See External sources for setup and import limits.
Attachments aren’t available in Deep research mode.
This attachment picker is part of the Lightdash composer. When you mention an agent in Slack instead, it only reads the message text and, when enabled, the thread history — see AI analyst agents for what Slack mentions can and can’t read.
Model and reasoning
When more than one model is available, the model picker beside the send button shows which model answers. Click it to choose another model. For models that support reasoning, the same menu has a Reasoning setting with two levels, Default and High, and the picker shows High beside the model name when it is on. A new conversation starts on the agent’s default model. Admins decide which models appear in the picker; see Control which models users can pick. One answer can take several model calls. The agent looks up fields, runs queries and builds charts in separate steps, and each step sends the context gathered so far back to the model. So a question that needs more steps, a long thread, High reasoning or a larger model all use more tokens per answer. To see token counts by model and feature, use the AI usage explore in the usage analytics project. When fast mode is available on your instance, the agent hands small routine choices, such as ranking the relevant fields, titling a chart or diagnosing an empty result, to a quick decision model, so simple questions come back faster. There’s nothing to train or set up: each decision works from what’s in your project when you ask, such as your question, the recent messages in the thread, and the names, labels, descriptions and AI hints of the fields that look relevant. Fast mode doesn’t run when your organization or project uses its own AI provider keys or Bedrock credentials, or for an agent set to its own AI provider credential.Set your default agent
You can assign your default agent in Ask AI by clicking the star by your agent’s name.
- Restrict the specialized agent’s audience. Under its User and group access settings, limit it to the people who use it. Everyone else, apart from admins, developers and anyone with the
manage:AiAgentscope, can then reach only the general agent, which opens directly for them. Pick this when other teams shouldn’t use the specialized agent at all. - Enable the AI Router and add routing instructions such as “Use @general-agent unless the question is about billing.” Pick this when other teams should still be able to reach the specialized agent.
Asking about a chart or dashboard
You can launch an AI conversation with a chart or dashboard pre-loaded as context. From the resource’s⋯ menu, click Ask AI Agent.
This opens a new tab on the new-thread page for your default agent. The chart or dashboard appears as a pinned context card above the input, and the agent treats it as the subject of the conversation.

Pinned context
- The pinned card stays visible above your message in the thread, so anyone reading later can tell what was being discussed.
- Click the pinned card to open the chart or dashboard in a new tab.
- The pinned context persists across follow-up messages — “now break it down by region” still refers to the originally pinned chart.
Linked dashboard
A thread created through the API or the React SDK can be bound to a dashboard for its whole life, which you can’t change afterwards. Pinned context belongs to one message; a binding belongs to the whole thread. See Bind a thread to a dashboard for how to create one.- A Linked dashboard card at the top of the thread opens the dashboard. The thread never pins a different dashboard from the page you’re on, and
@tile mentions come from the linked dashboard. - If the agent can create content, it can only change the linked dashboard and the charts saved in it. See Threads bound to a dashboard.
- If the thread was created with background context, admins see it in a collapsed Thread context block. Other users don’t see it, but the agent always uses it. Custom roles can grant the
view:AiAgentThreadContextscope to show it. - If the dashboard is deleted, the card shows Dashboard no longer available. You can keep asking questions, but the agent can’t change saved content in that thread.
Mentioning dashboard tiles
When the pinned context is a dashboard, you can@-mention any of its chart tiles directly in your message to focus the agent on a single tile.
Type @ in the input and pick a tile from the Dashboard tiles group in the suggestion list. The selected chart is added alongside the pinned dashboard, so the agent answers about that specific tile while still keeping the dashboard as overall context.
This is useful when a dashboard has many charts and you want to drill into one without leaving the thread:
- “Why did @Weekly active users drop last week?”
- “Break @Revenue by region down by channel.”
What you can ask
When you pin a saved chart, the agent can read its actual data (subject to your data access setting). It honors the chart’s saved filters, sorts, custom metrics, and parameter values, so you can ask:- “Why is this trending up?”
- “Are there outliers in this chart?”
- “Compare this chart’s last 30 days to the previous period.”
Mentioning charts and dashboards with @
You can reference saved charts and dashboards directly from the chat input by typing @. This adds them as context for the agent’s next message, similar to a pinned card, without leaving the conversation.
Type @ followed by part of a name to open the suggestion menu. Suggestions are grouped so the most relevant content appears first:
- Already mentioned — content already referenced earlier in this thread.
- Current page — the chart or dashboard you’re viewing when you open the chat.
- Dashboard tiles — charts on the dashboard you’re currently viewing.
- Search results — any chart or dashboard you have access to, ranked by your search query. Verified content is marked with a green check.
Enter or Tab to insert it. While the menu is open, Enter selects the suggestion instead of sending the message.
Each mention becomes a chip in the input — for example, @Weekly revenue — and travels with the message as prompt context. The agent uses the same access rules as a pinned card: it can read the resource’s structure and (when data access is enabled) its underlying data.
You can only mention content you have permission to view. Mentions are available in agent threads, in the AI Router, and in the launcher used to start new threads.
Share a thread
To let a colleague continue from your conversation, click the Share thread icon in the thread header and copy the link. Anyone with the link who can use the agent and start threads opens the conversation as their own copy, and can continue it independently. The copy includes the conversation up to the moment you created the link; messages you send afterwards aren’t included. The Share thread icon appears on threads started in the Lightdash app or through the API, not on threads started in Slack. Sending the thread’s own URL instead only works for you and for users who can manage the agent, such as project developers and admins, who can read it but not reply (see Read-only threads).Read-only threads
In some cases, the chat input on an existing thread is disabled and you can’t send follow-up messages. The input shows a short message explaining why. You’ll see this when:- The thread was started in Slack. Reply in the original Slack thread to continue the conversation.
- The thread belongs to another user. You can read the conversation, but only the original author can post follow-ups.
- The model used in the thread is no longer available. Threads are pinned to the model that produced the first assistant response, so the conversation history stays consistent. If an admin removes that model from the agent — or the provider no longer offers it — start a new thread to continue with one of the agent’s current models.
Delete a thread
To delete one of your threads, open its menu in the agent’s thread list and click Delete. Deletion is permanent and also removes the thread’s tool calls and the memories the agent learned from it. You need the Editor role or higher in the project. Threads started in Slack can’t be deleted from the thread list, because that wouldn’t remove the messages from Slack. People who manage the project’s agents, such as project admins and developers, can delete any thread there, Slack ones included, from Settings → Ask AI → Threads. To delete threads automatically after a period of inactivity, see Thread retention.Schedule a recurring delivery from a conversation
When an agent lands on an answer worth watching, you can turn that conversation into a recurring scheduled delivery. Lightdash re-runs the agent on your chosen frequency and sends the refreshed chart, along with an AI-written summary, to Slack, email, or Microsoft Teams. Open the⋯ Quick actions menu on a saved chart the agent produced and choose Schedule delivery.


Example use cases
Period-over-period comparisons
Agents can answer time-comparison questions directly — month-over-month, year-over-year, or any custom offset — without you having to set up the comparison in the Explorer first. When you ask a comparison question, the agent picks a base metric, a time dimension, a granularity (day, week, month, quarter, or year), and an offset (how many periods back). It then runs the query and adds a comparison column next to the base metric, labelled with the offset (for example,Revenue (Previous month)).
Prompts that work well
- “Compare revenue to last month”
- “Month-over-month new users”
- “Year-over-year orders by week”
- “Show revenue this quarter vs the previous quarter, and vs the same quarter last year”
- The granularity must match the time dimension’s interval — ask for “monthly revenue vs last month” (not “daily revenue vs last month”).
- The agent can’t yet sort or filter on the generated comparison column directly; sort or filter on the base metric or the time dimension instead.
Advanced visualizations with window functions
Ask an agent to build a three-month rolling average to smooth short-term variation. This demonstration shows the request and the resulting visualization.SQL mode
SQL mode lets the agent reach for raw SQL when a question can’t be answered from the semantic layer alone — for example, when the data exists in your warehouse but hasn’t been modeled as an explore yet. With SQL mode on, the agent can list warehouse tables, describe their columns, and run SQL queries against your warehouse. SQL mode can only read data. Lightdash validates every query before it runs and rejects anything that isn’t aSELECT or WITH statement, so mutating or administrative SQL (INSERT, UPDATE, DELETE, DDL) never reaches your warehouse.
SQL mode is off by default on every new thread. To turn it on for a conversation, open the composer options with the + button in the message input and select SQL Runner.
When to use it
- The data you need lives in a warehouse table that isn’t part of an explore.
- You want a one-off lookup, audit, or shape-of-the-data check before modeling it.
- The agent has already told you it can’t answer from the semantic layer.
Who can use it
The SQL Runner option is visible only to users who hold themanage:SqlRunner ability — the same permission required to use the SQL Runner page. If you don’t see it, ask a workspace admin to grant SQL Runner access to your role.
The default agent Lightdash creates with your first project (Aurora) ends its instructions with “If no explores are available yet, use your warehouse tools to discover the schema and answer with SQL.” That fallback applies only in SQL mode for someone who can already use the SQL Runner. Everyone else is told there’s no data to query until you set up explores.
What SQL mode does not enforce
User attributes are enforced by the semantic layer, so they apply to every query built from an explore: Explore, charts and dashboards, and AI agents answering in their default (semantic) mode. Anything that runs raw SQL against the warehouse runs outside the semantic layer, andsql_filter, required_attributes and any_attributes do not apply to it:
- The SQL Runner
- SQL mode in an AI agent conversation
- The Run SQL tool of the Lightdash MCP server
- Hand-written SQL inside a semantic query: custom SQL dimensions, custom SQL metrics, and SQL table calculations. They’re pasted into the query as written, which is why authoring them needs
manage:CustomFieldsormanage:CustomSqlTableCalculations.
manage:SqlRunner for the first three, manage:CustomFields or manage:CustomSqlTableCalculations for the last. A user without those cannot run raw SQL from any of them, whatever an agent’s instructions say. If someone needs raw SQL and warehouse-enforced permissions at the same time, require personal warehouse credentials on the project so their queries run as their own warehouse user, and put the restrictions in the warehouse.
How approvals work
SQL mode is gated by a human-in-the-loop check on every query:- You turn on SQL mode for the thread.
- You ask a question. The agent drafts a SQL query.
- Lightdash shows the proposed SQL inline and waits for you to Approve or Reject before anything runs against your warehouse.
- Approved queries return results to the agent, which then summarizes or visualizes them.
SQL mode in Slack
Slack-triggered prompts can only use SQL mode when your organization has the “Require Slack users to authenticate with Lightdash” setting (aiRequireOAuth) turned on. Without it, Slack messages run under a shared workspace-default identity, so SQL execution is disabled fail-closed whether or not SQL mode is on. See User attribution and OAuth for how to configure OAuth.
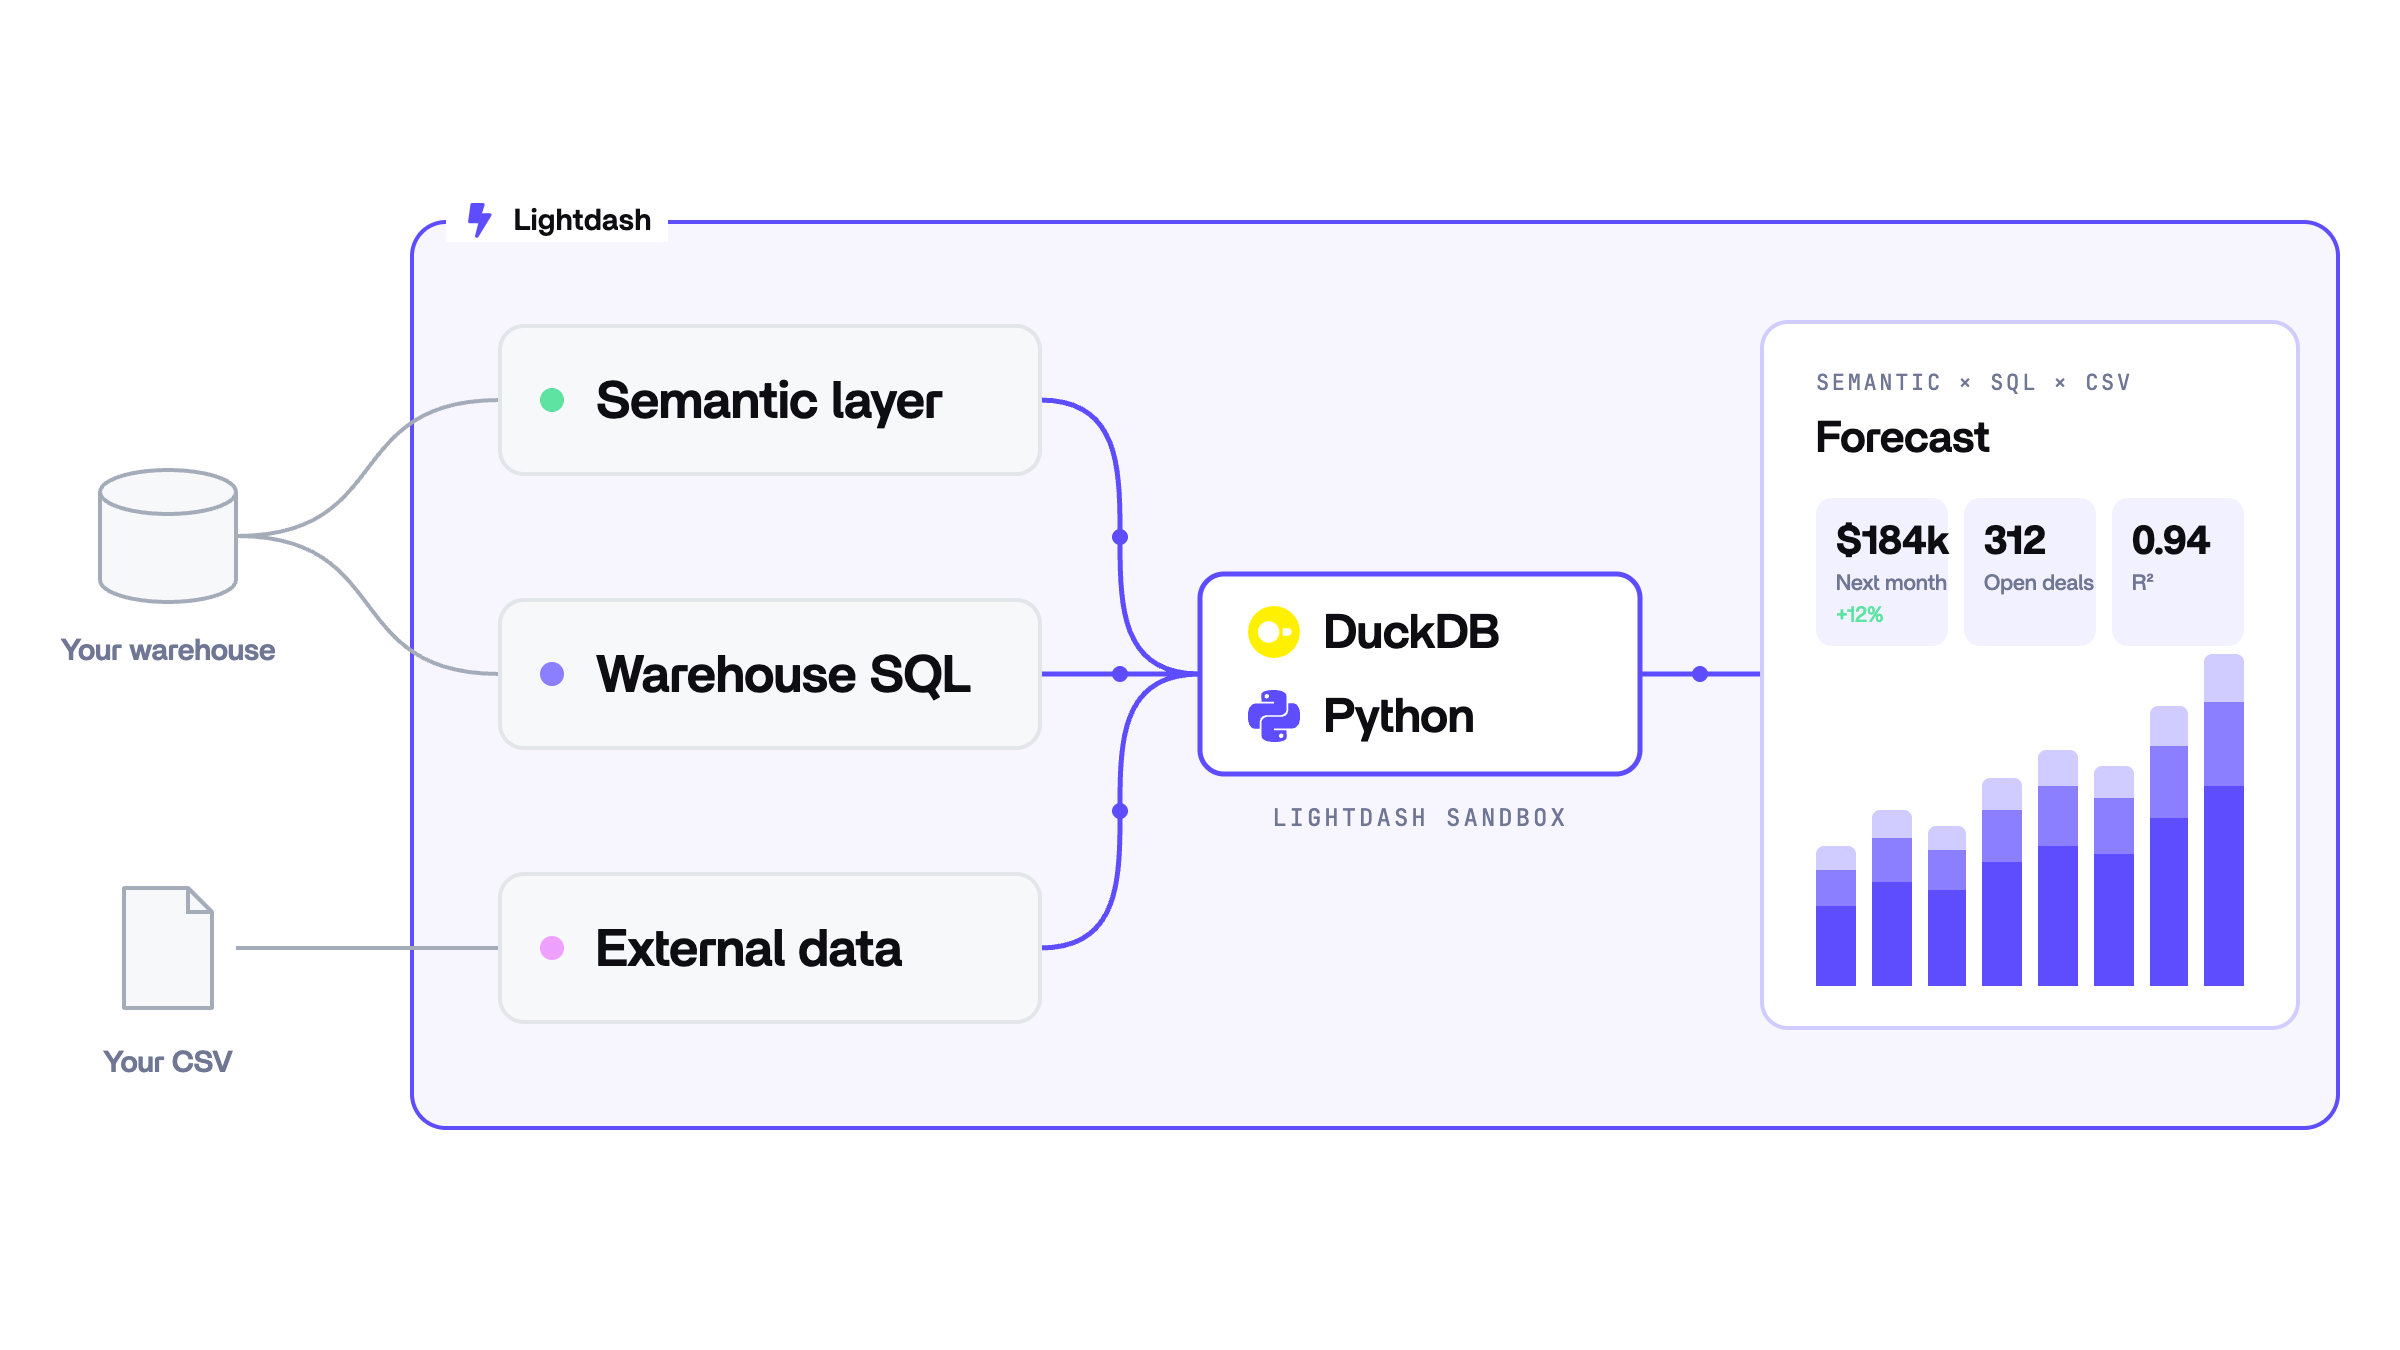
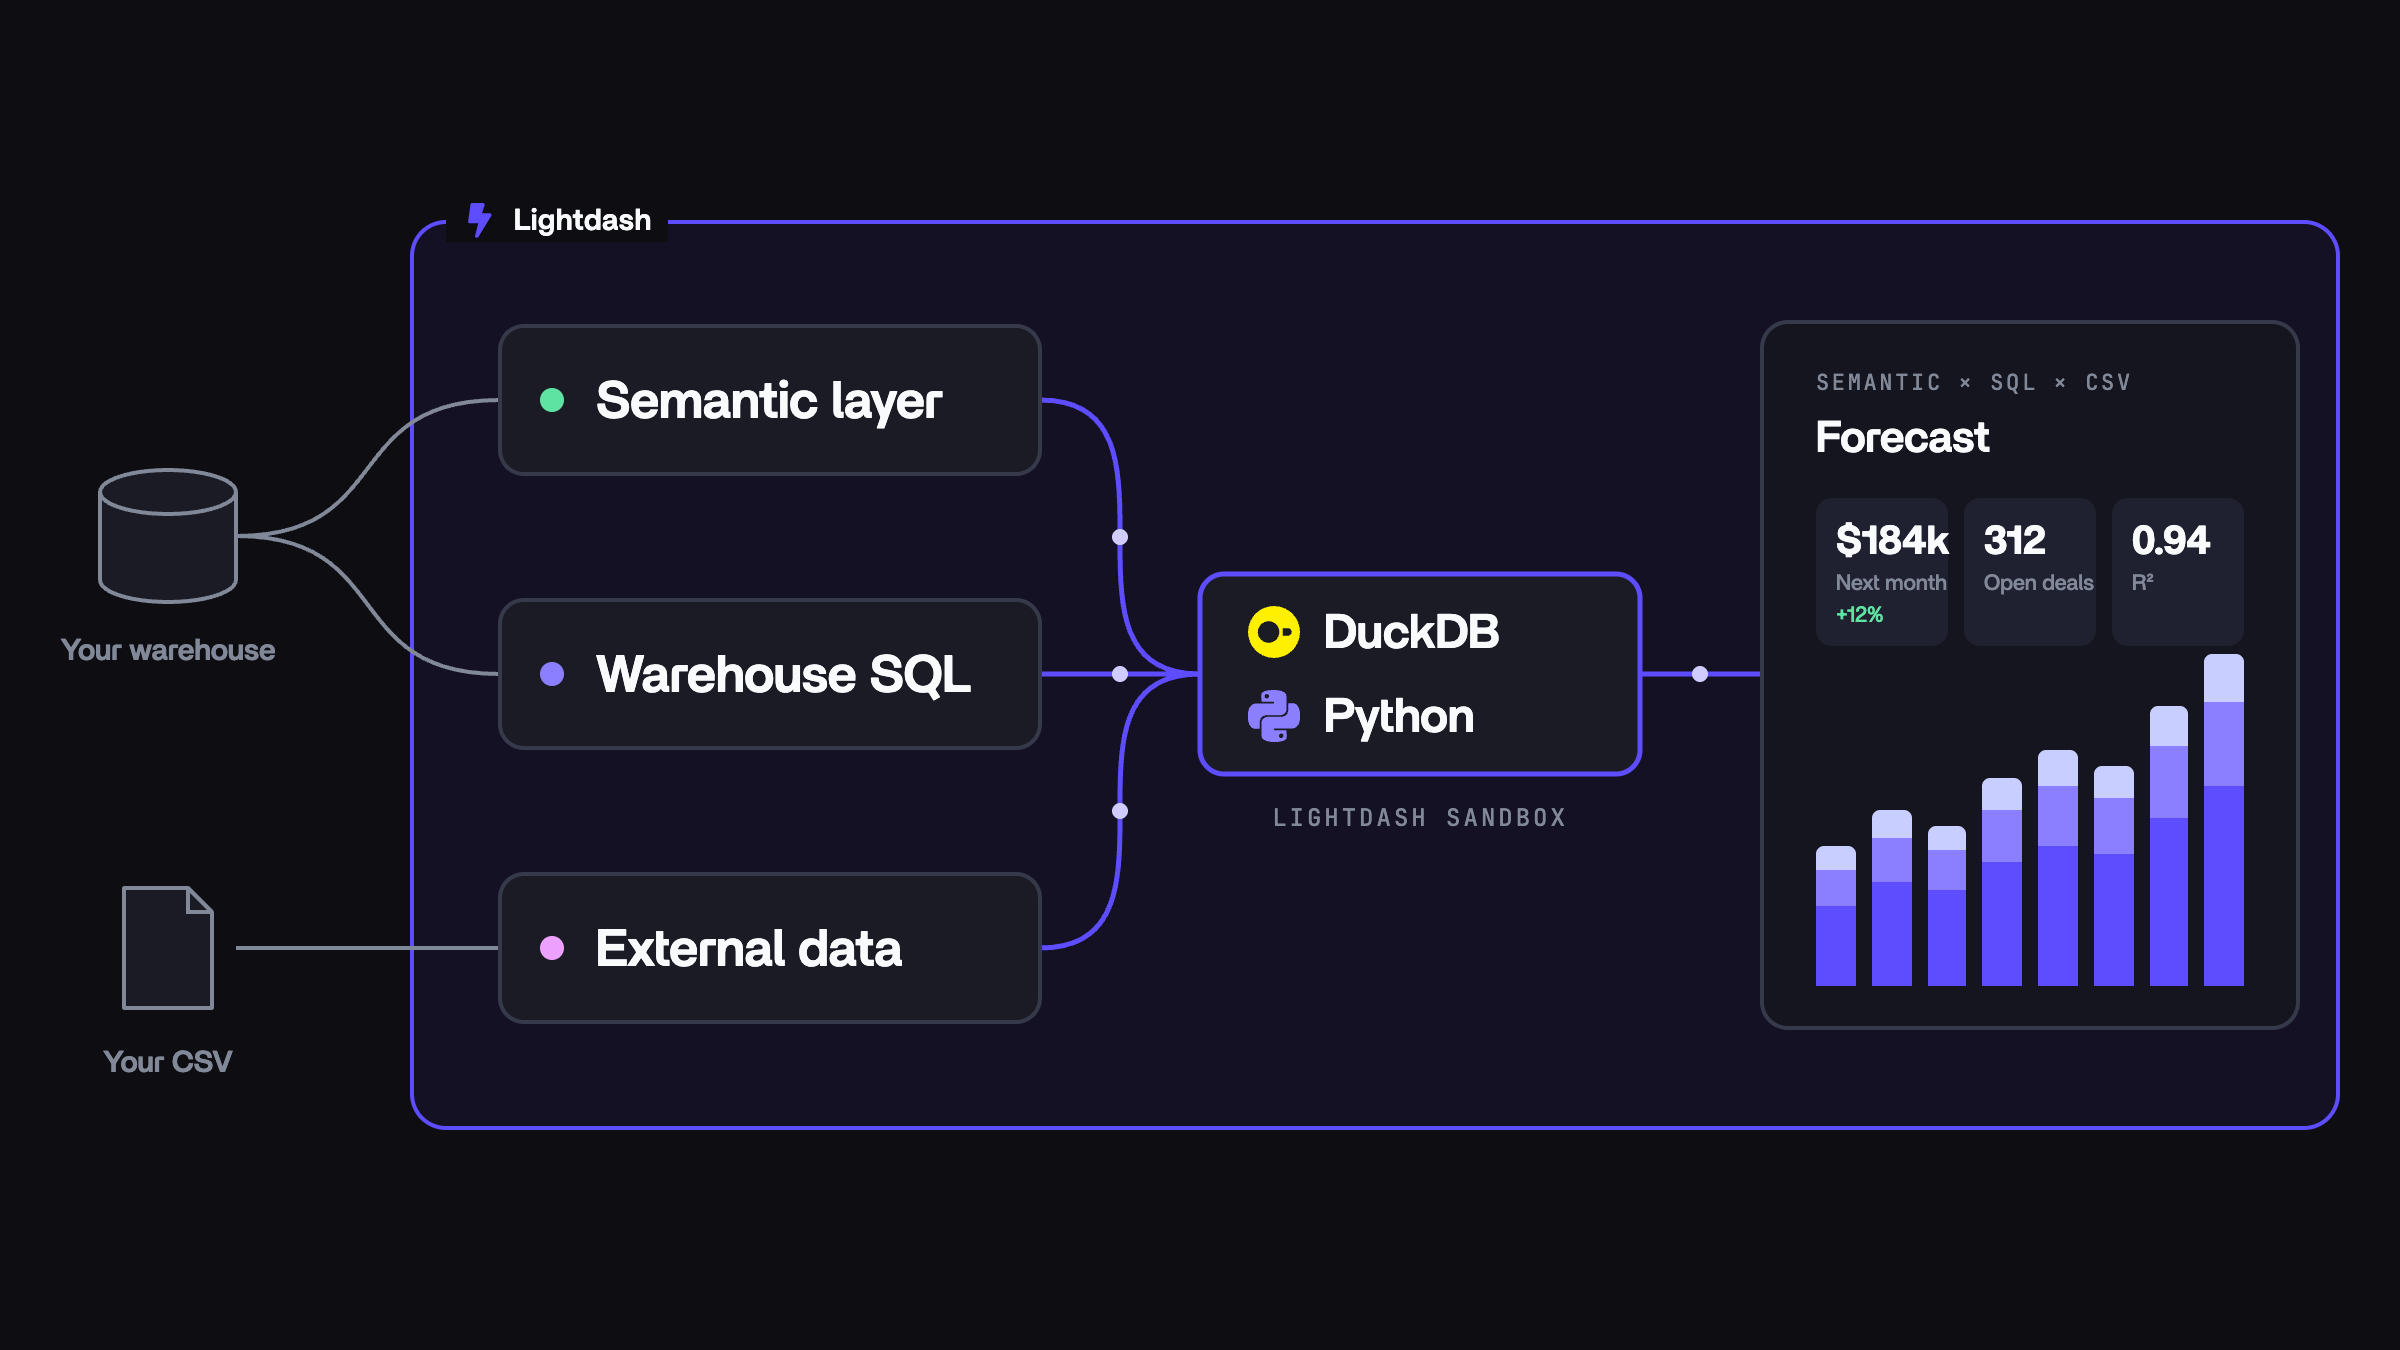
Post-process results with DuckDB and Python
Ask for anomalous weeks, then open Lineage to see the semantic layer step feeding a Python step, and select the Python step to read its code
How it works
A question that one metric query can answer still runs as a single query. The agent only adds DuckDB or Python steps when the question needs them.
DuckDB and Python both run in a sandboxed environment that only receives the result rows the step references, and is destroyed after each run. Python steps can use pandas, numpy, scipy, pyarrow, scikit-learn and polars. They have no network access and can’t install packages.
Reading the result
The agent shows the result as a card, the same way it shows a chart. Below it, the Queries bar shows how many steps ran. Expand it to see each step, grouped into Sources, Transformations and Result, or switch to Graph to see how they connect. View query shows a step’s SQL and View code shows a Python step’s code. Select a step to see its own rows, and Back to result to return. Opening a result runs the steps as the person viewing it, so viewers only ever see data they have access to.Limitations
- A result built with DuckDB or Python lives in its thread. It can’t be saved as a chart or added to a dashboard. A result with a single semantic layer step and no post-processing is a regular chart and can be saved.
- Each step is subject to the AI query row limit. A DuckDB or Python step only sees the rows the steps before it returned, so the agent aggregates early when a step would hit its limit.
Query execution stats
When an agent runs a query against BigQuery, it gets the warehouse’s statistics for the job back with the results. You can ask the agent how much data a query scanned or how long it took. For example: “How many bytes did that query process?”
The stats cover metric queries and SQL mode queries. They are not reported when:
- The results come from the results cache. No warehouse job runs, so there is nothing to report.
- The project uses a warehouse other than BigQuery.
Response time
Each agent reply shows how long it took, as time to first token and total time. Hover over it for a breakdown of where that time went:
When they apply, the tooltip also counts queries served from the results cache and queries that reused an earlier verified result. Times are measured on the server, and stages that run at the same time can overlap, so they don’t always add up to the total.
Known limitations
Data analysis and calculations
AI agents can query your actual data through metric queries, field value search, and SQL mode, and can define custom metrics and formula table calculations on the fly. For forecasts, regressions and other statistical work, agents can post-process results with DuckDB and Python. Reading result rows is subject to your data access setting.Query and visualizations constraints
Results are limited by configurable query limits set at server level to ensure good performance. These limits can only be adjusted through environment variables at the moment. When you ask an agent to join data across two explores that have no join defined in your dbt models, it runs the join as a merge — the same mechanism behind the Explorer’s Merge another query flow. Each side runs as its own query capped at the configured query limit, and Lightdash joins the results afterwards; if a side is cut off by its limit, the merge fails rather than returning a partial join. See How a merge runs and Row limits for the full mechanics. A join defined in your dbt models doesn’t go through this path: the agent’s metric query pushes the whole join down to your warehouse as a single query, so it isn’t subject to this per-side limit. If a pair of explores hits the merge limit often, model the join between them in dbt instead. Agents can create tables, bar charts, vertical bar charts, line charts, scatter plots, pie/donut charts, and funnel charts, but don’t yet support custom visualizations or big number charts.Images and screenshots
Agents only read the text of a message. A screenshot, image, or table pasted as an image gives the agent nothing to work with, whether the message is sent in the Lightdash app or in Slack. This is separate from attaching a file, which only reads plain-text documents.Data access and context
Agent access to your data is controlled through tags in your dbt models and by the asking user’s user attributes. If certain fields aren’t accessible, check that they have the appropriate tags assigned to your agent, and that the user’s attributes allow them. See Who can see what for how the controls stack, including SQL mode. For conversation history and how saved results refresh, see Conversations and saved results. When an agent can use 15 or fewer explores, Lightdash includes the list of them in the agent’s context. With more than 15, the agent searches for the fields it needs instead.Request and context limits
Two different limits can stop an agent mid-conversation:- “The agent reached its work limit before it could write a response. Try asking for fewer things at once, or split your request into smaller parts.” An agent can take a limited number of internal steps per request, and this request needed more before it could reply. Asking an agent to edit every tile on a large dashboard in one message is a common way to hit it. Split the request into smaller parts instead.
- “This request exceeded the AI model’s context limit, usually because the conversation or tool results became too large. Please start a new thread or break the request into smaller steps.” The model’s context window holds the whole thread plus the data its tool calls returned, and this request pushed that over the model’s limit. A long-running thread can reach it, but so can a single step that returns a lot of data, such as a wide query result — there’s no fixed number of messages that triggers it.