

What you’ll build
An executive summary at the top of your app that writes itself when the page loads, markers on the unusual data points of every chart, and an Investigate with AI action that explains why a point stands out.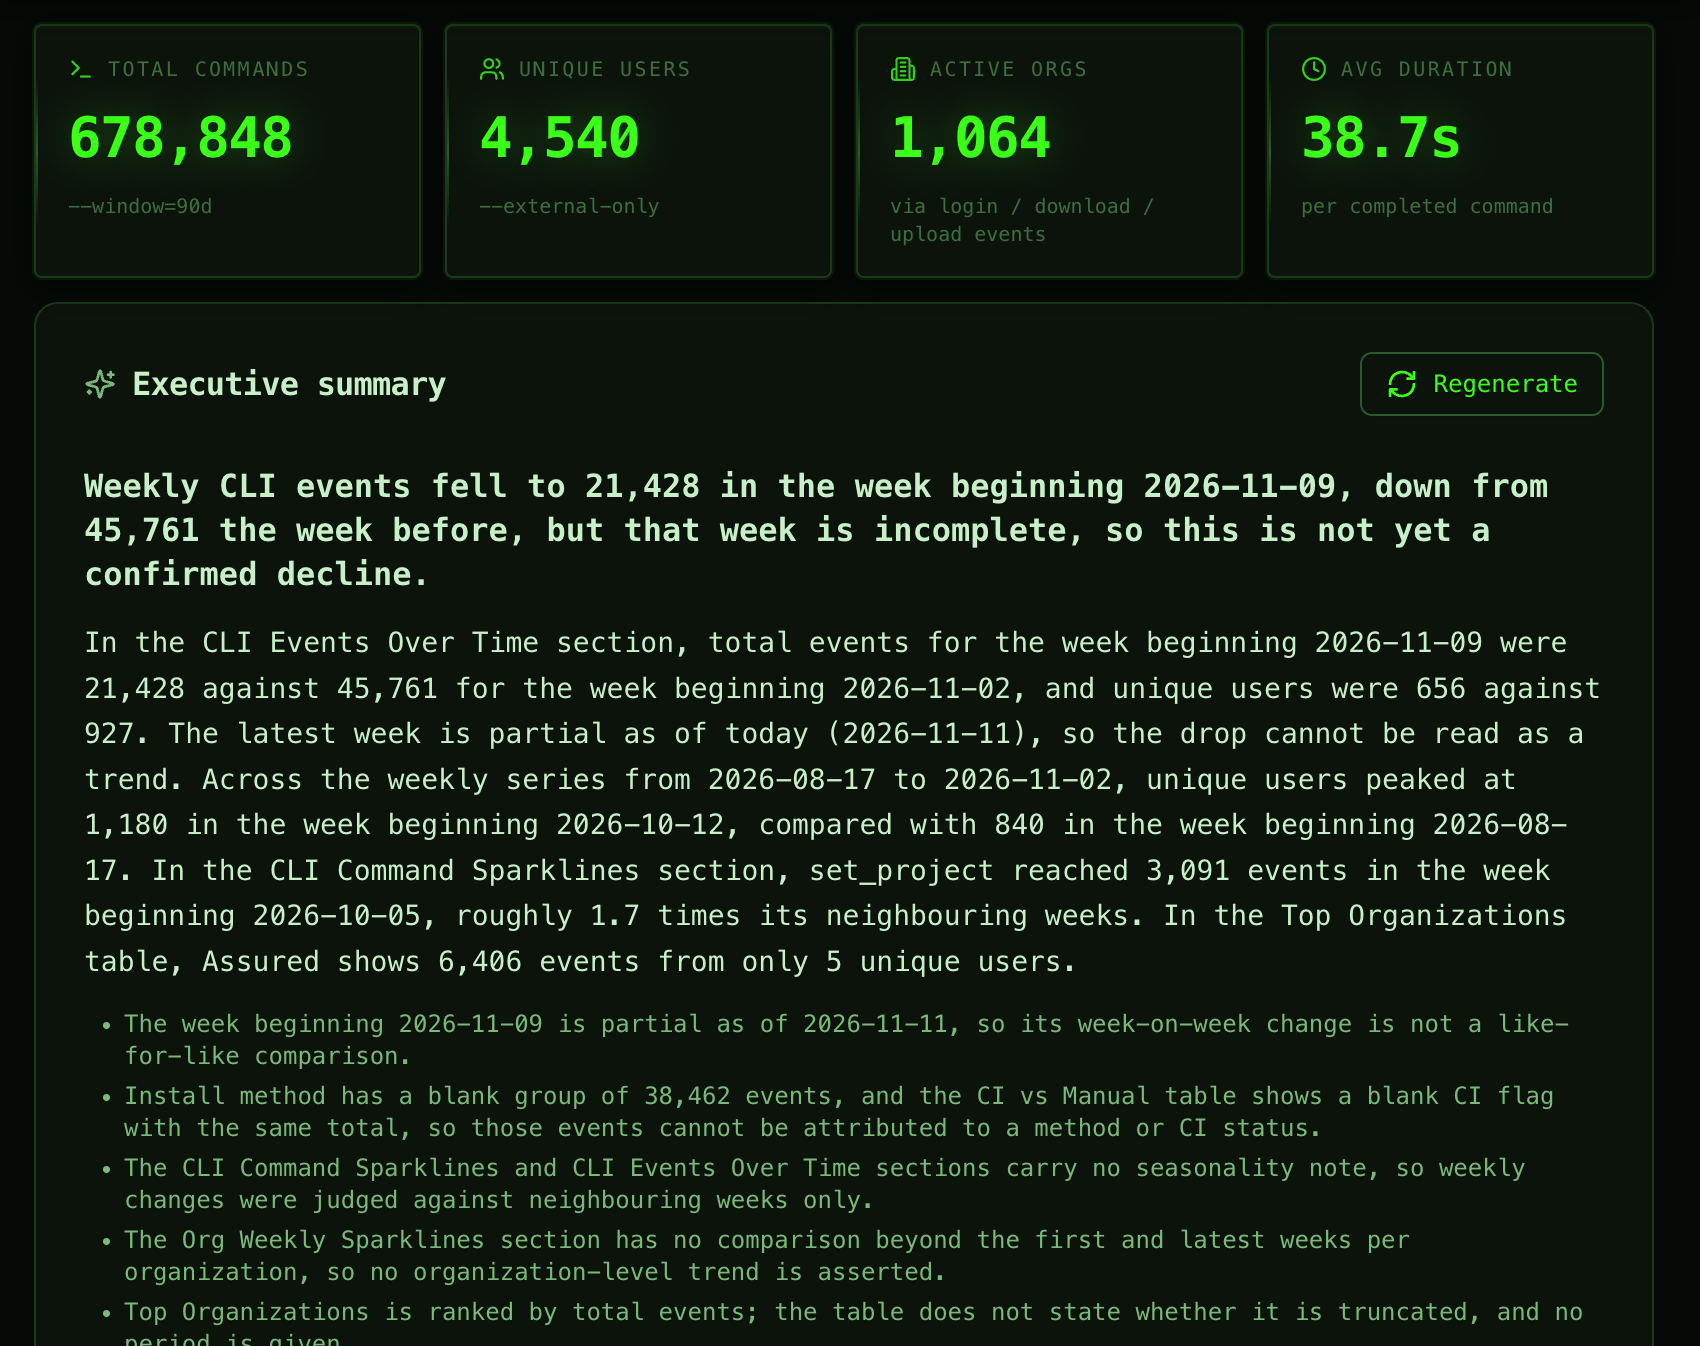
Before you start
- Data apps on your Lightdash instance. See Data apps.
- AI analysis turned on by an organization admin under Settings → Ask AI → AI analysis. See Turn it on.
- An AI agent with access to the app’s data, if you want to investigate findings. The summary and markers work without one.
- A data app with charts that you can edit. To start from scratch, create an app with the Dashboard template and attach an existing dashboard as context. See Creating a new app.
Copy the prompt
Open your app, copy this prompt, and send it as your next prompt to the app agent. The agent builds a new version of the app. The prompt asks for the full set of in-app analysis, turns on analyse on load, and stores the last line as the app’s analysis instructions.Try it
1
Open the new version
When the build finishes, the preview reloads. An Executive summary block appears at the top of the page and starts analyzing once the charts load. After a few seconds it shows a headline, a short summary, and the limitations of the data.
2
Hover a marked data point
Charts with notable points show markers, colored by severity. Hover one to see the finding under the value in the tooltip.If the analysis finds no notable points, no markers appear and the headline says so. Skip the investigation steps.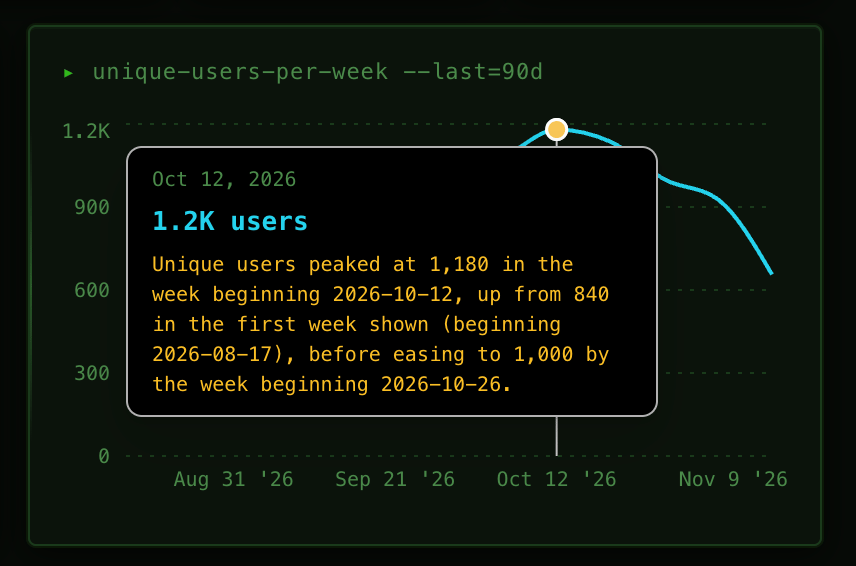
3
Change the view
Change a filter or move to another tab. The summary runs again for the new view. If someone already analyzed the same results, the stored analysis appears immediately.
4
Investigate a finding (optional)
This step needs an AI agent with access to the app’s data. Without one, the summary and markers still work, but the data point menu has no Investigate with AI entry.Click a marked point to open its menu, then click Investigate with AI. An investigation card appears under the chart and fills in with possible drivers, the evidence the agent checked, and a confidence line.
5
Continue in Ask AI (optional)
On a finished investigation, click Continue in Ask AI to keep asking questions in a thread. The button only appears when your organization allows it.
Make it yours
Send any of these as a follow-up prompt. Keep only the summary and drop the chart markers:How it works
- AI analysis covers what is analyzed, the organization limits, and what is sent to the model.
- Investigate a finding explains which tools the agent can use and how long an investigation can run.
- Reuse explains when a stored analysis is shown instead of a new one.
- Where it works lists the places AI analysis doesn’t run, such as scheduled deliveries and embedded apps.