

Experimental AI analysis is off by default. It needs AI agents enabled for your organization and the
enable-data-app-analysis feature flag, which Lightdash support turns on for Cloud organizations on request. What Experimental means.Turn it on
An organization admin enables AI analysis under Settings → Data apps → AI analysis. The page is only shown once the feature flag is on.- AI analysis turns it on for every data app in the organization. It sends query results a viewer already has access to, to your configured AI provider. If you have brought your own provider keys, the calls go through your account; otherwise they run on Lightdash’s key.
- Analyse on load is the default for apps: run the analysis when a viewer opens an app, without a click. Stored analyses of identical results are reused, so a busy app does not re-run the model on every open. Any app can override the default from its ⋯ menu under Analyse on load: use the organization default, on, or off.
- Continue investigations in Ask AI lets viewers carry an investigation on as an Ask AI thread. Turn it off to keep viewers at the written explanation.
enable-data-app-analysis to LIGHTDASH_ENABLE_FEATURE_FLAGS; see feature flags.
Limits
The same page sets caps on how much analysis the organization can run. Each is a number or, for the daily caps, empty for no cap.
On Lightdash’s key the daily caps cannot be raised above the defaults. On your own key they apply as you set them. Once a daily cap is reached, the panel says so and analysis resumes the next day.
Independently of those caps, each viewer is limited per app to 6 analyses, 3 investigations, and 20 prompts a minute. An analysis served from storage is free. When the limit is hit, an analysis a viewer asked for says when to retry; an automatic one on load stays quiet and tries again on the next view change. Investigations are also capped at three minutes each.
Analyse a view
Open a data app and click the sparkles icon in the header, labelled Analyse this view. It opens the AI analysis panel on the right. If the organization has analysis off, the icon’s tooltip and the panel say so, and organization admins get a link straight to the setting.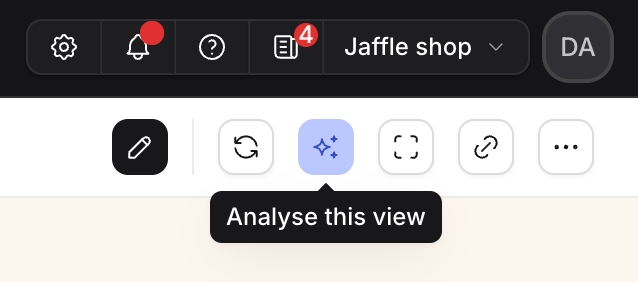
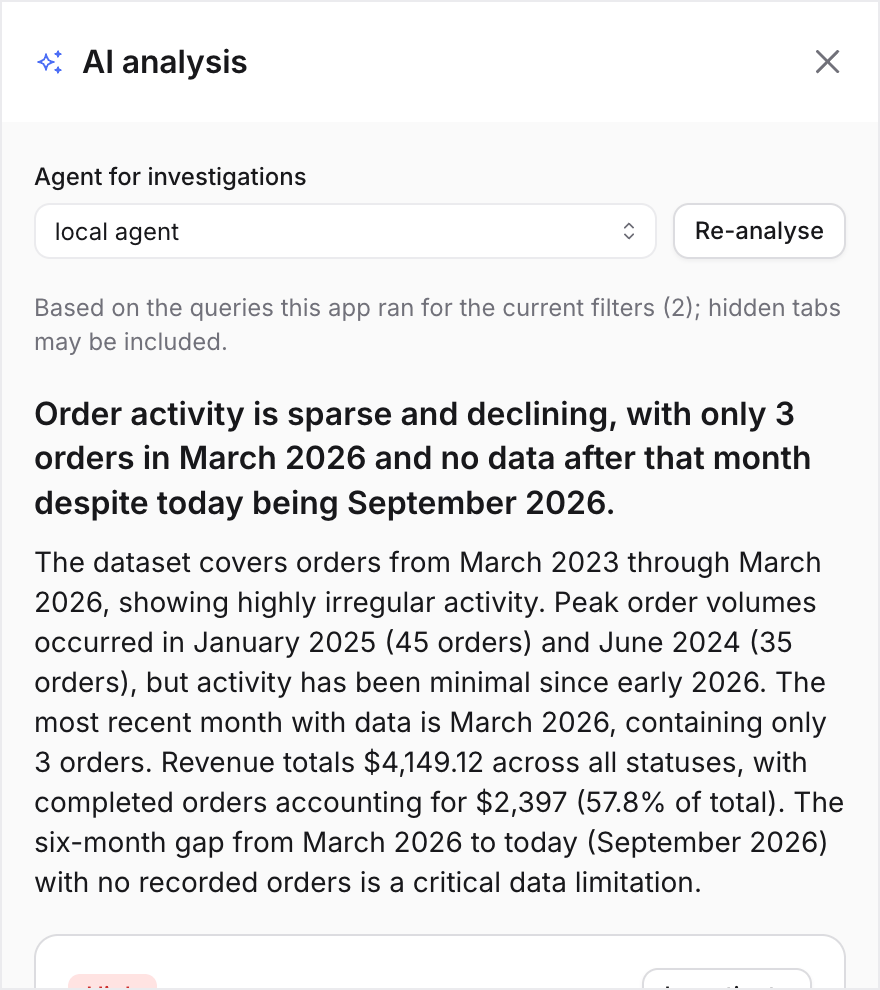
- Pick an agent for investigations. The analysis itself needs no agent; the agent is what investigates a finding later, so any agent with access to the app’s data will do. Your choice is remembered per app.
- Click Analyse this view. The panel reads every query the app ran for the current filters. Queries on tabs you are not looking at count too, as long as the app has loaded them. Apps built on a current SDK report exactly which queries are on screen, so the analysis covers what you see.
- A headline with the main finding and a summary an executive can read without the charts.
- Findings, each with a severity of High, Medium, Positive, or Info. High and Medium point at something worth a look, Positive at a good surprise, and Info at context the summary relies on. A finding that refers to one row names the row; a finding about a whole table names only the table. Hovering a finding highlights the chart it came from when the app supports data lineage.
- Limitations, such as a missing comparison period or truncated results. They are what keeps the summary honest, so read them before acting on the headline.
Reuse
Lightdash stores every analysis with the app version and a fingerprint of the results it read. Opening a view whose results match an analysis someone already ran shows that analysis straight away instead of running the model again, and the same applies when you return to the app later. Findings are shared this way; investigations are personal and are never copied between viewers. Re-analyse always runs afresh. Stored analyses and investigations are deleted after 30 days. A view opened after that is analysed again.Investigate a finding
Click Investigate on a finding. The agent you picked runs in the background with read-only tools: it can search the semantic layer, run queries, read saved charts and dashboards, and read the agent’s knowledge documents. It cannot save content, change anything, or reach external systems. A run is bounded by the organization’s limits; if the query budget runs out, the explanation says the answer is partial. The explanation arrives as Markdown with a summary, a Possible drivers list with evidence for each, an Evidence list of what was checked, and a confidence line. It stays attached to the finding for you and is restored when you reopen the app. Viewers who have no access to any agent in the project still get the analysis. The panel explains that findings cannot be investigated, and apps hide their Investigate actions for them.Continue in Ask AI
When the organization allows it, a finished investigation has a Continue in Ask AI button. It opens the investigation as a thread in Ask AI with the agent’s reasoning already in place, so you can keep asking questions. The thread stays read-only for its whole life: every later prompt keeps the investigation’s tool set, so it cannot save charts, write back, or start a deep research run, whatever the agent is otherwise allowed to do.Show the analysis inside the app
Viewers do not have to open the panel. Ask the app agent to add AI analysis and the app renders the same analysis in place:- “Add AI analysis” gives the full set: a summary block at the top of the page, markers on the flagged data points of every chart, Investigate with AI in every data point’s menu, and the investigation card under the chart.
- “Just an executive summary” gives the summary block alone.
- “Mark anomalies on the charts” gives the markers, the menu entry, and the card.
Apps built before AI analysis existed do not pick it up on their own. Ask the agent to add it, which creates a new version of the app. If an app was wired to a model provider through an external connection as a stopgap, ask the agent to replace that with AI analysis: it drops the author’s key from the app and puts the organization’s consent and the viewer’s permissions back in charge.
For app code
If you edit app code locally, two hooks from@lightdash/query-sdk expose the analysis:
useInsights()returns the view’s analysis, anduseInsights(result)narrows it to the findings on oneuseLightdashquery, with amatches(row, fieldId)helper for marking data points. The template ships ready-made components undersrc/components/insights/for the summary block, markers, menu entry, and investigation card.useAiPrompt()lets the app ask its own short question about results it has already loaded, for an author-written takeaway under a chart or an explanation of a clicked row. Answers are plain text. Prompts are capped at 2,000 characters and count against the prompt limits above.
references/ai-analysis.md documents both in full.
Where it works
AI analysis is for people viewing a data app in Lightdash while signed in. It is not available, and apps built with it show nothing extra, in:- Scheduled deliveries and Google Sheets syncs, which render the app under the creator’s account.
- Embedded apps, which run under an embed token.
- Local preview with
lightdash apps preview, where there is no Lightdash host to run the analysis.
What is sent to the model
- Analysis sends the query results the app loaded for the viewer, with their field names and the app’s instructions, to the AI provider configured for your organization.
- Investigation runs the agent you picked, with the same data access that agent has anywhere else.
- App prompts send the results the app named, and the author’s question.