```markdown theme={null}
Check out this bold word.
You can do italics.
And underline.
Or maybe you want to strikethrough.
Show code snippets like Hello World!.
Or highlight something important.
Add links like this!
Use subscript or superscript
Easily colour your text.
Or change the size.
Center your text.
Or align it to the right.
You can even justify a line of text if you are trying to communicate a point that is particularly long, perhaps something like this example sentence?
Change the word spacing. 👏
Or combine a whole bunch of styles together.
It supports headings
Here's an H2 heading in red
You can include images and apply options and styles. Here's one I centered earlier:
 ```
### Loom tiles
Click the Loom video option, then enter a URL and a title for the tile.
## Save your dashboard
When you're happy with the layout, hit **Save**. You can see every saved dashboard in your project under **Browse → All dashboards**.
## Add filters
Dashboard filters let you change the data in every tile at once. In edit mode, click **Add filter**, pick a field and a value, and hit **Apply**; save the dashboard to keep the filter for everyone who opens it.
Filters do a lot more than that — temporary filters that only you see, filters that viewers must fill in before the dashboard loads, and per-tile control over which fields a filter applies to. See [dashboard filters](/explore/dashboards/filter) for the full behavior.
## Add tabs
As a dashboard grows it may end up supporting multiple teams and use cases. Tabs organize it.
```
### Loom tiles
Click the Loom video option, then enter a URL and a title for the tile.
## Save your dashboard
When you're happy with the layout, hit **Save**. You can see every saved dashboard in your project under **Browse → All dashboards**.
## Add filters
Dashboard filters let you change the data in every tile at once. In edit mode, click **Add filter**, pick a field and a value, and hit **Apply**; save the dashboard to keep the filter for everyone who opens it.
Filters do a lot more than that — temporary filters that only you see, filters that viewers must fill in before the dashboard loads, and per-tile control over which fields a filter applies to. See [dashboard filters](/explore/dashboards/filter) for the full behavior.
## Add tabs
As a dashboard grows it may end up supporting multiple teams and use cases. Tabs organize it.
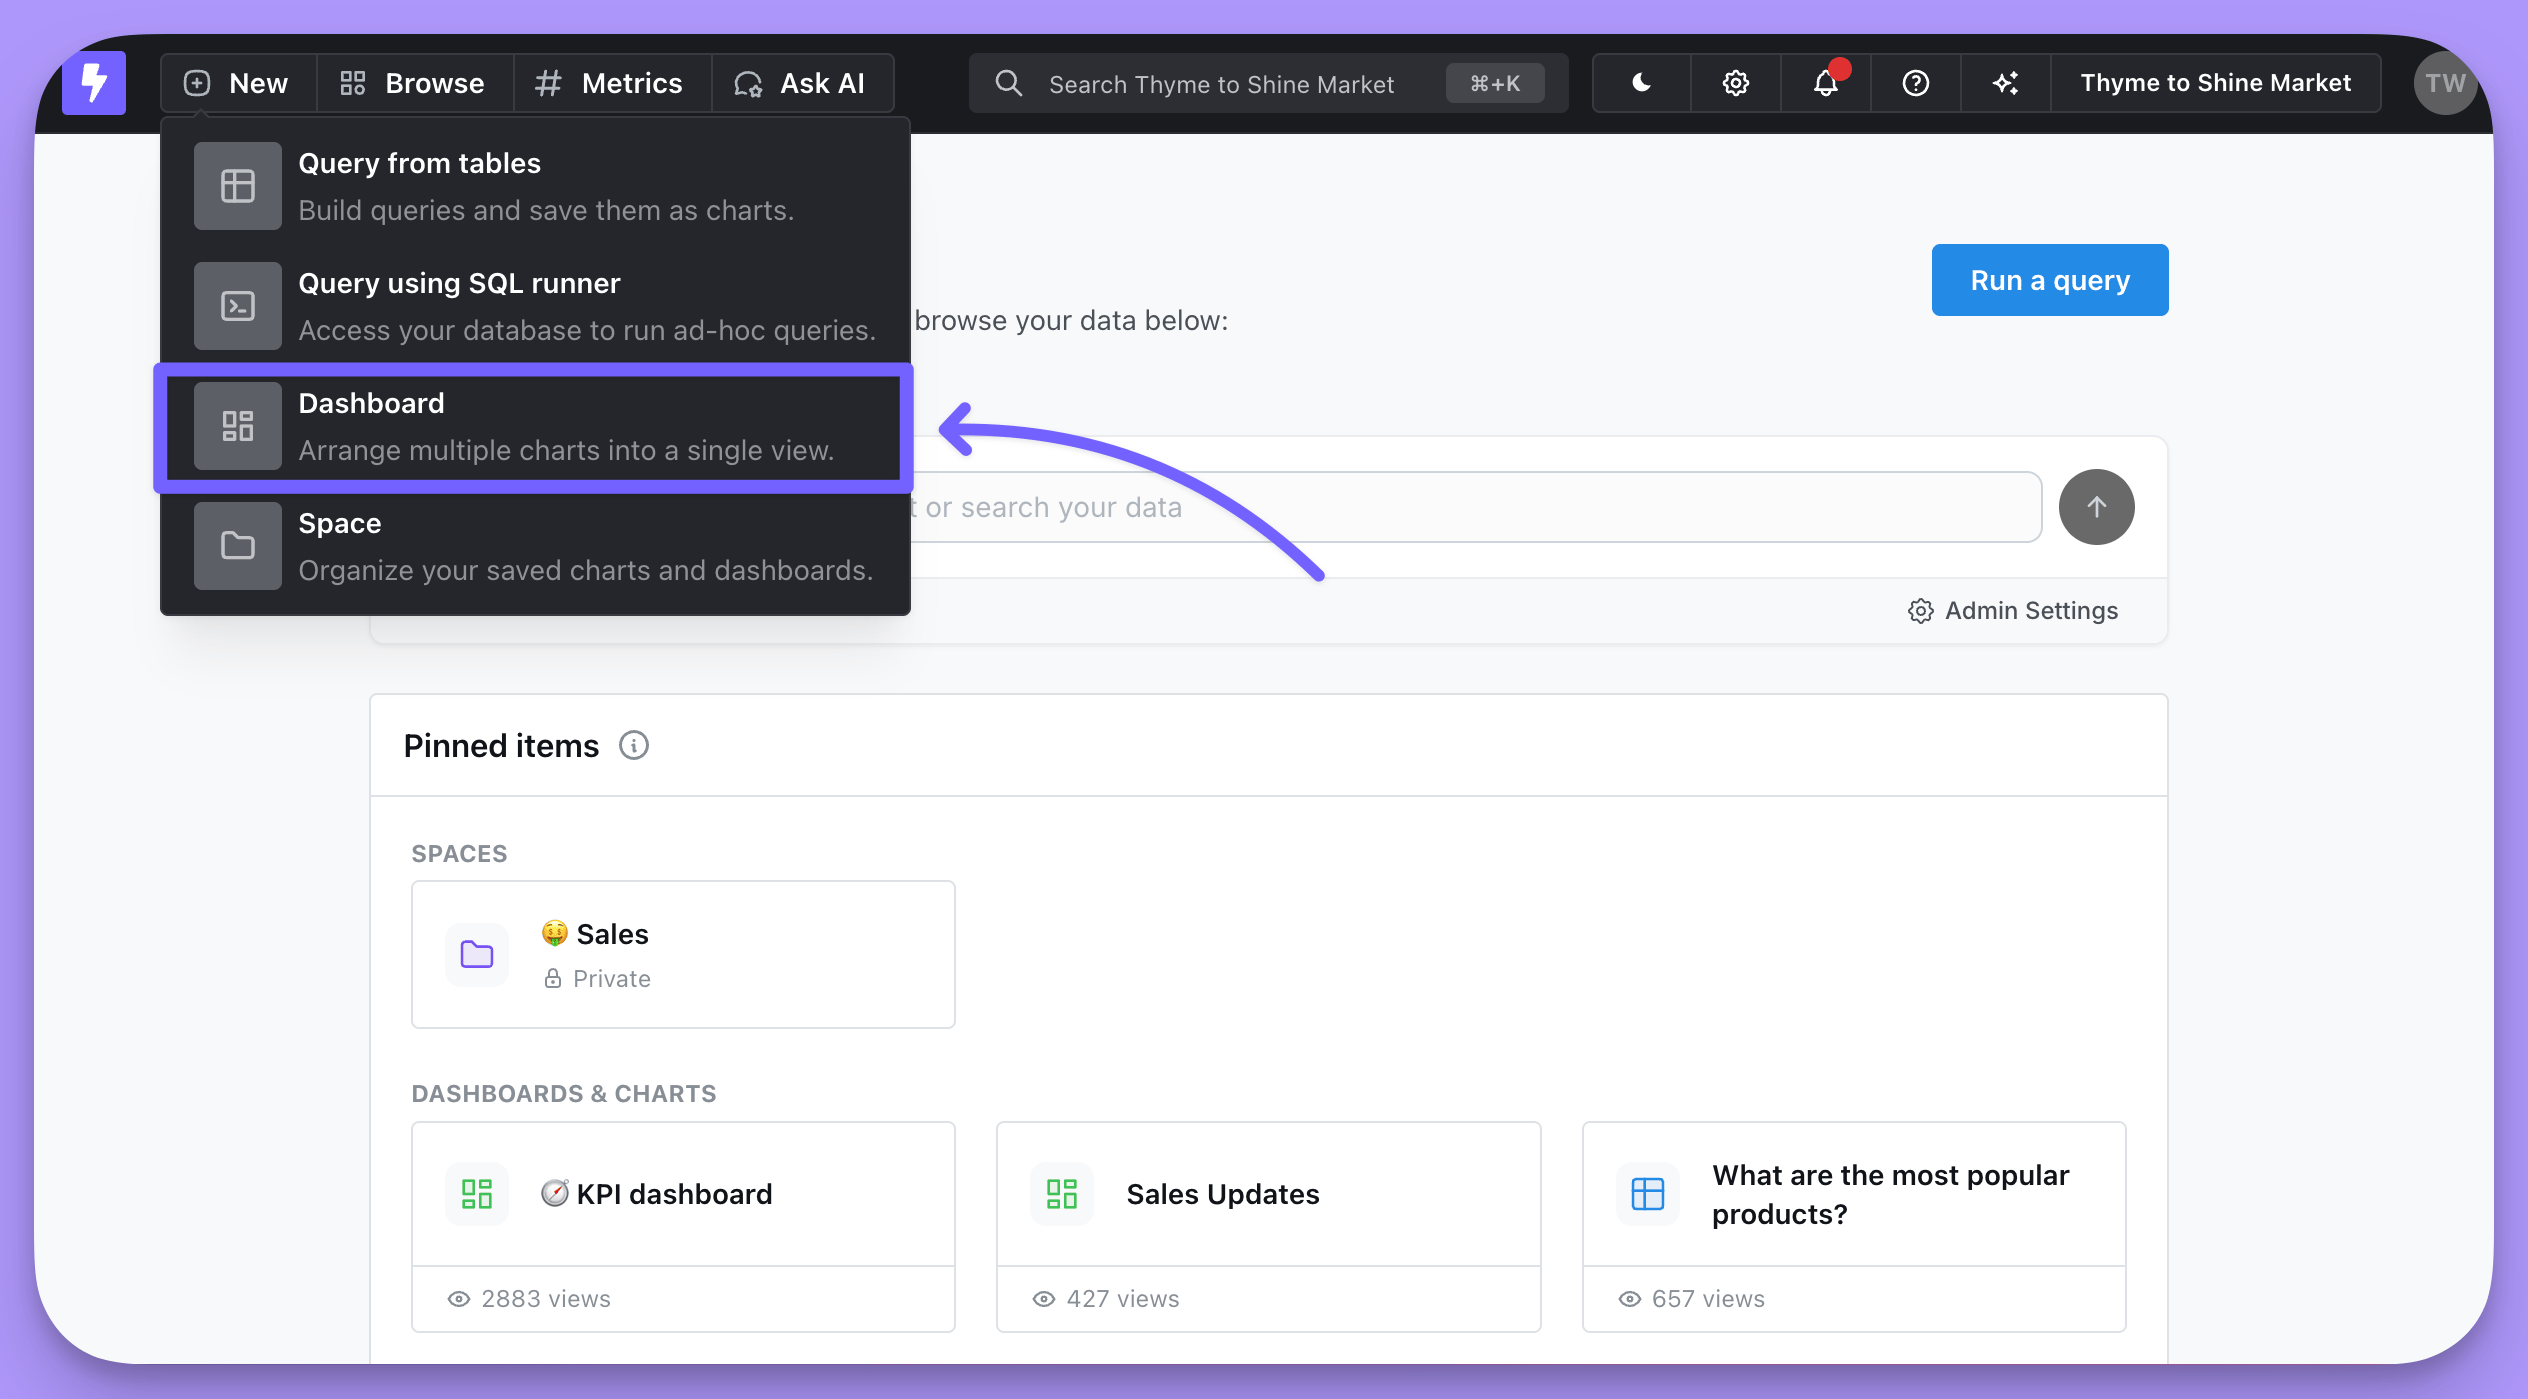 Fill out the details and hit **Create**. You'll be redirected to your new dashboard page.
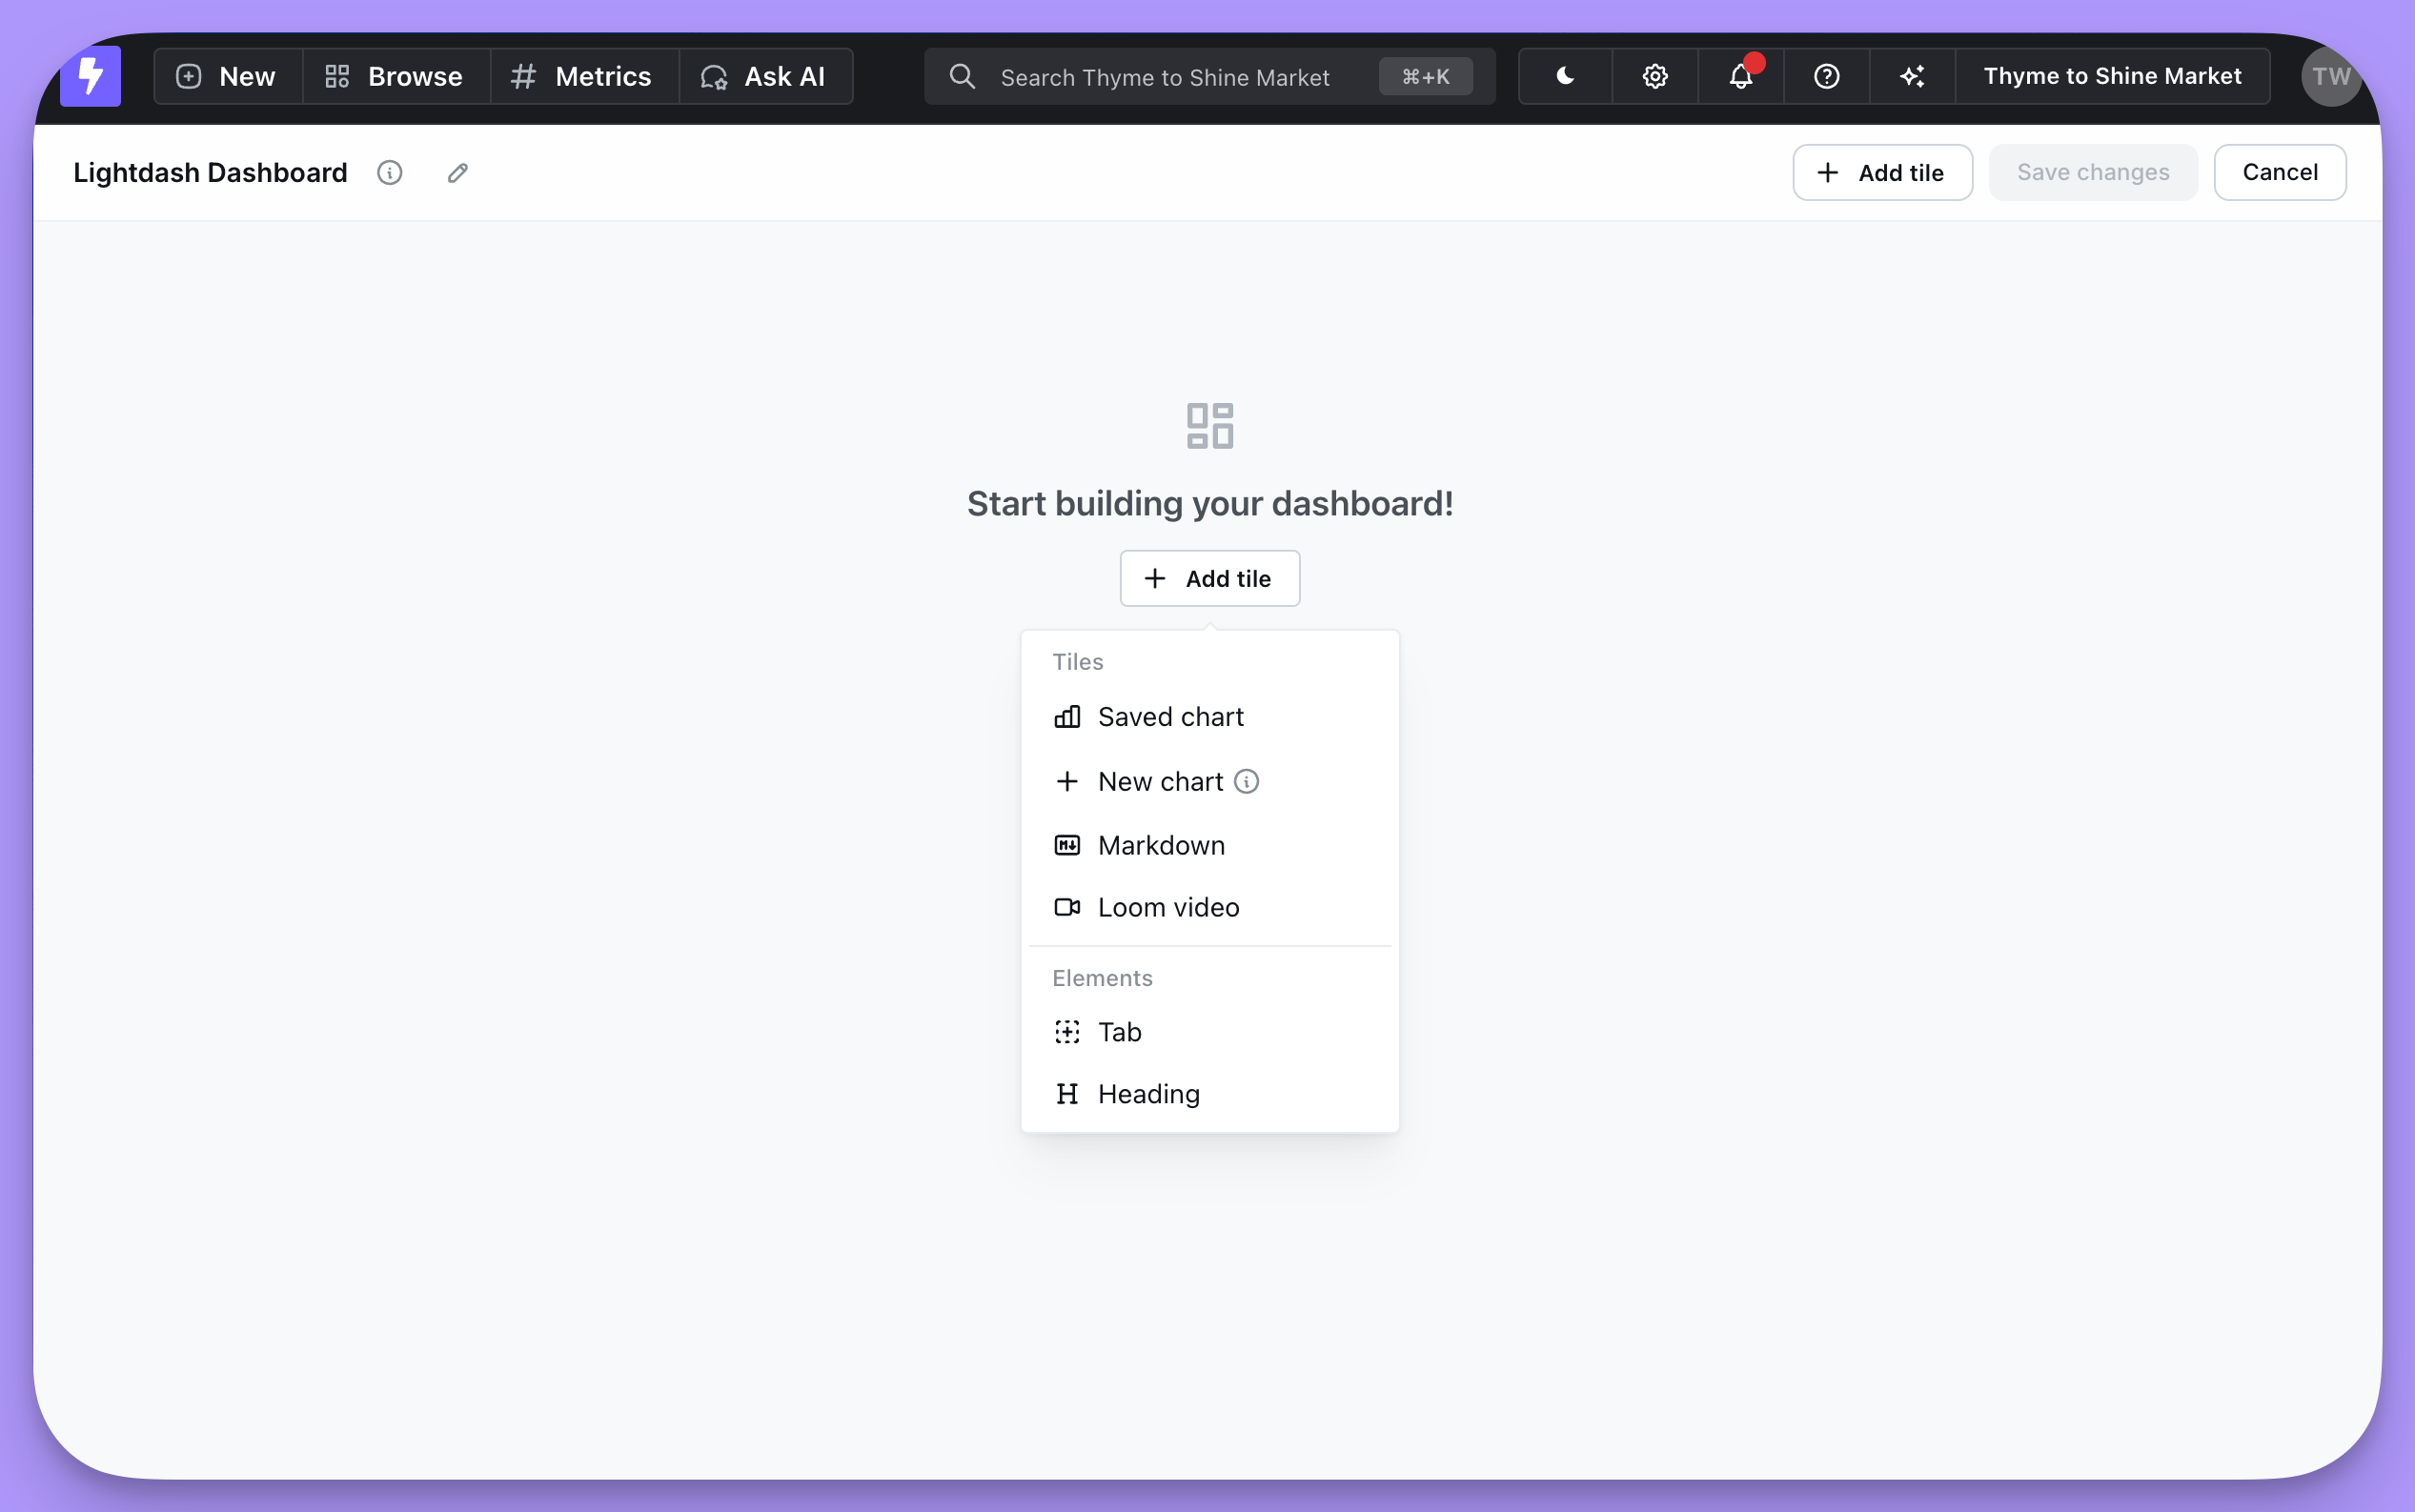 From here you add content with the **Add tile** button.
## Add charts
You can create a new chart from within your dashboard, or add an existing one.
### Create a new chart
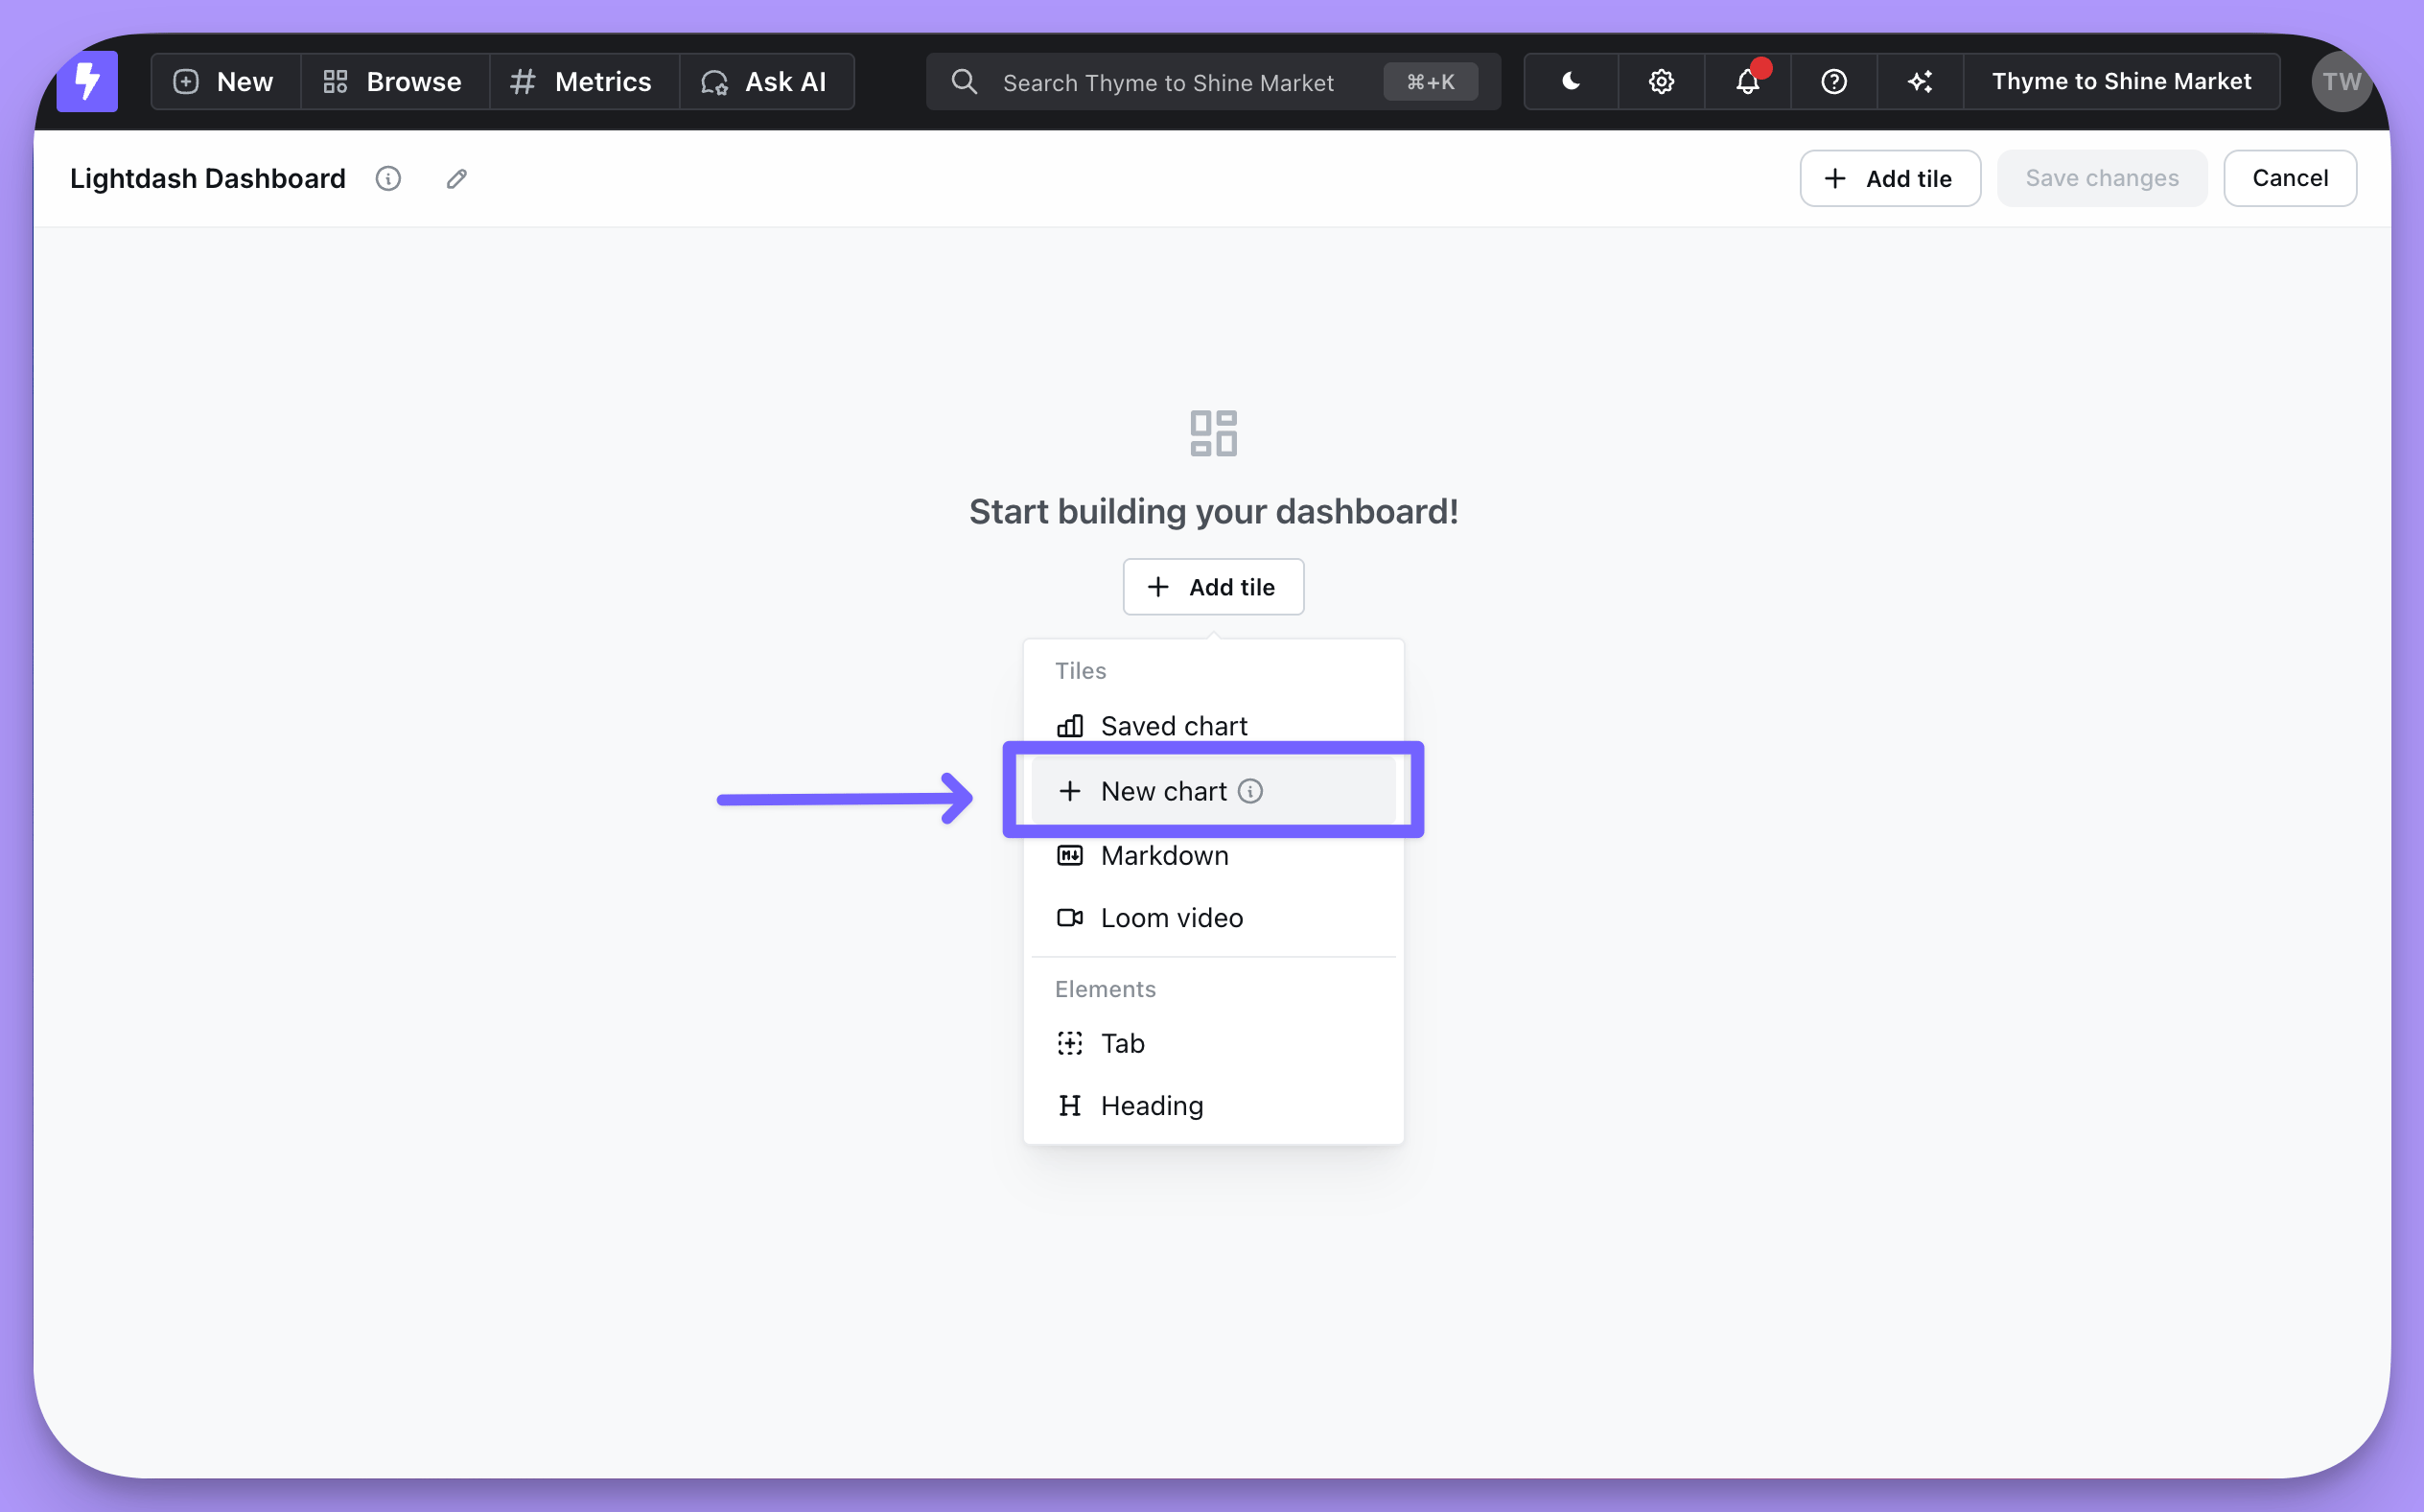
Creating charts from within a dashboard keeps your spaces and projects free of charts that are only used once. Click **Add tile**, then **New chart**, and you'll be taken to the chart builder. Once you save the chart it appears at the bottom of your dashboard.
From here you add content with the **Add tile** button.
## Add charts
You can create a new chart from within your dashboard, or add an existing one.
### Create a new chart
Creating charts from within a dashboard keeps your spaces and projects free of charts that are only used once. Click **Add tile**, then **New chart**, and you'll be taken to the chart builder. Once you save the chart it appears at the bottom of your dashboard.
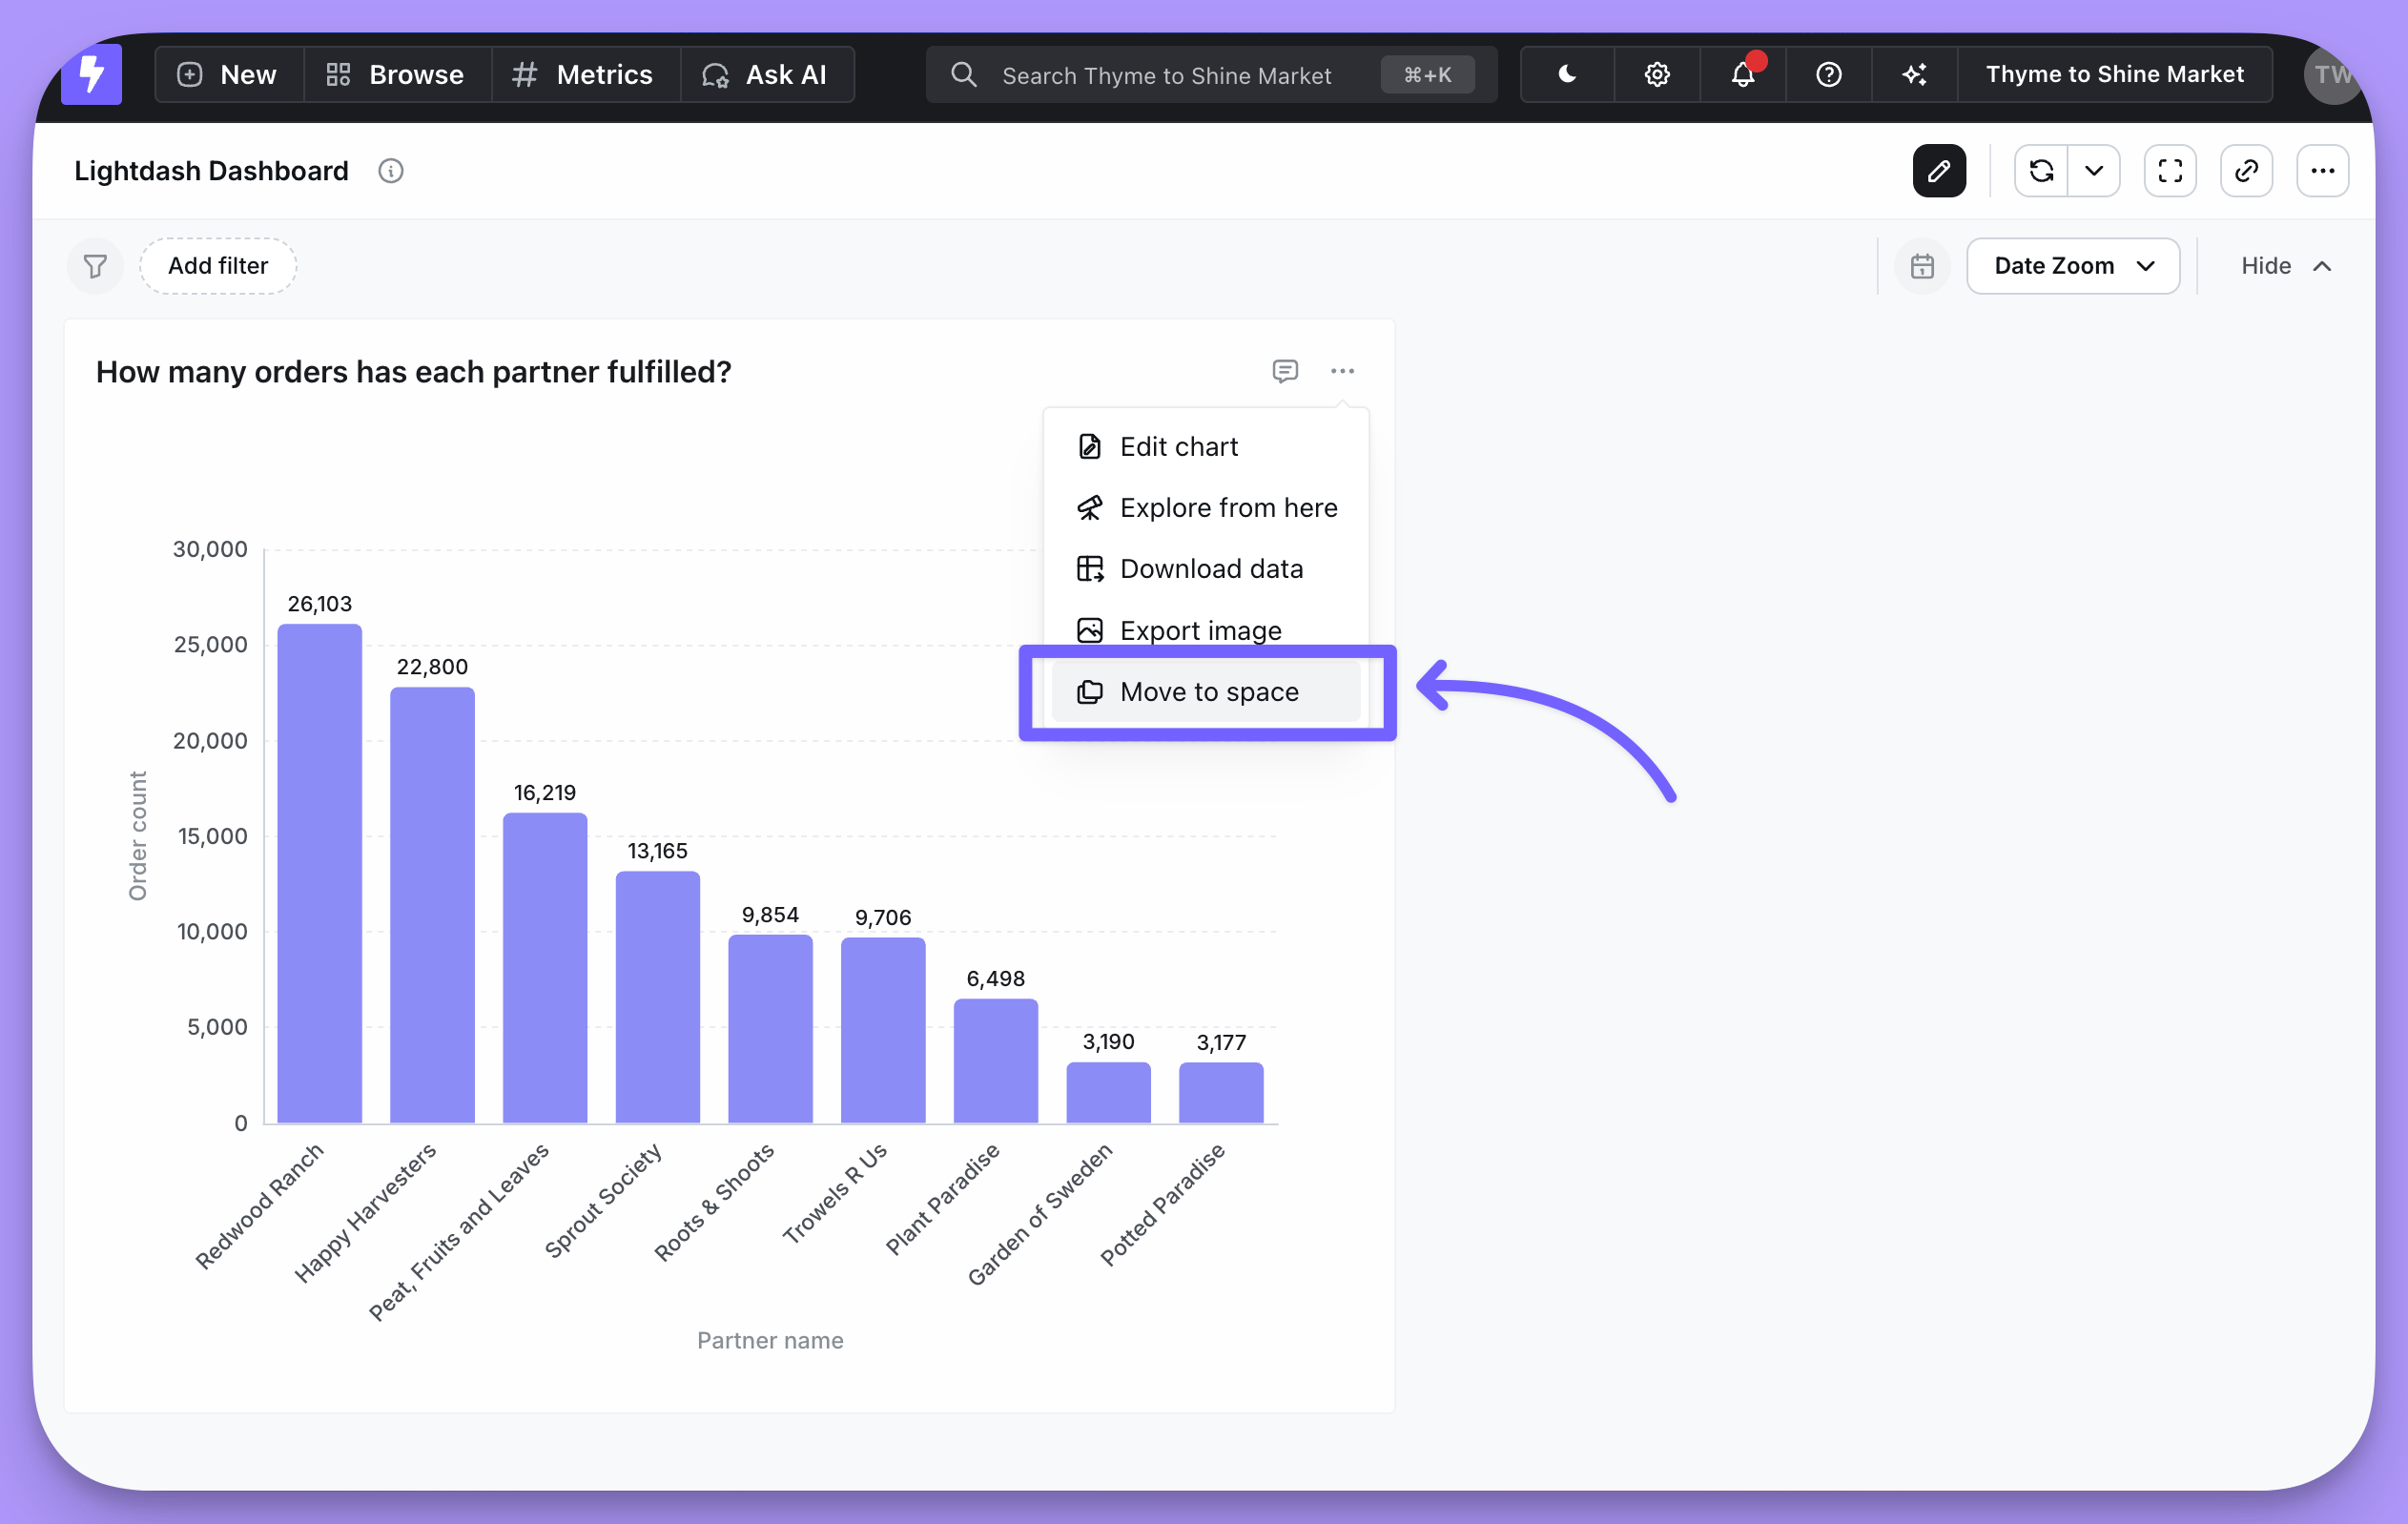
 Charts created this way are exclusive to the dashboard: they can't be reused in other dashboards, and they don't appear in global search or in any space. To make one reusable, detach it from the dashboard and save it to a space with the **Move to space** option in the chart's three-dot menu.
 ### Add an existing chart
Click **Add tile**, then **Saved chart**. Clicking any chart adds it at the bottom of your dashboard.
### Add an existing chart
Click **Add tile**, then **Saved chart**. Clicking any chart adds it at the bottom of your dashboard.
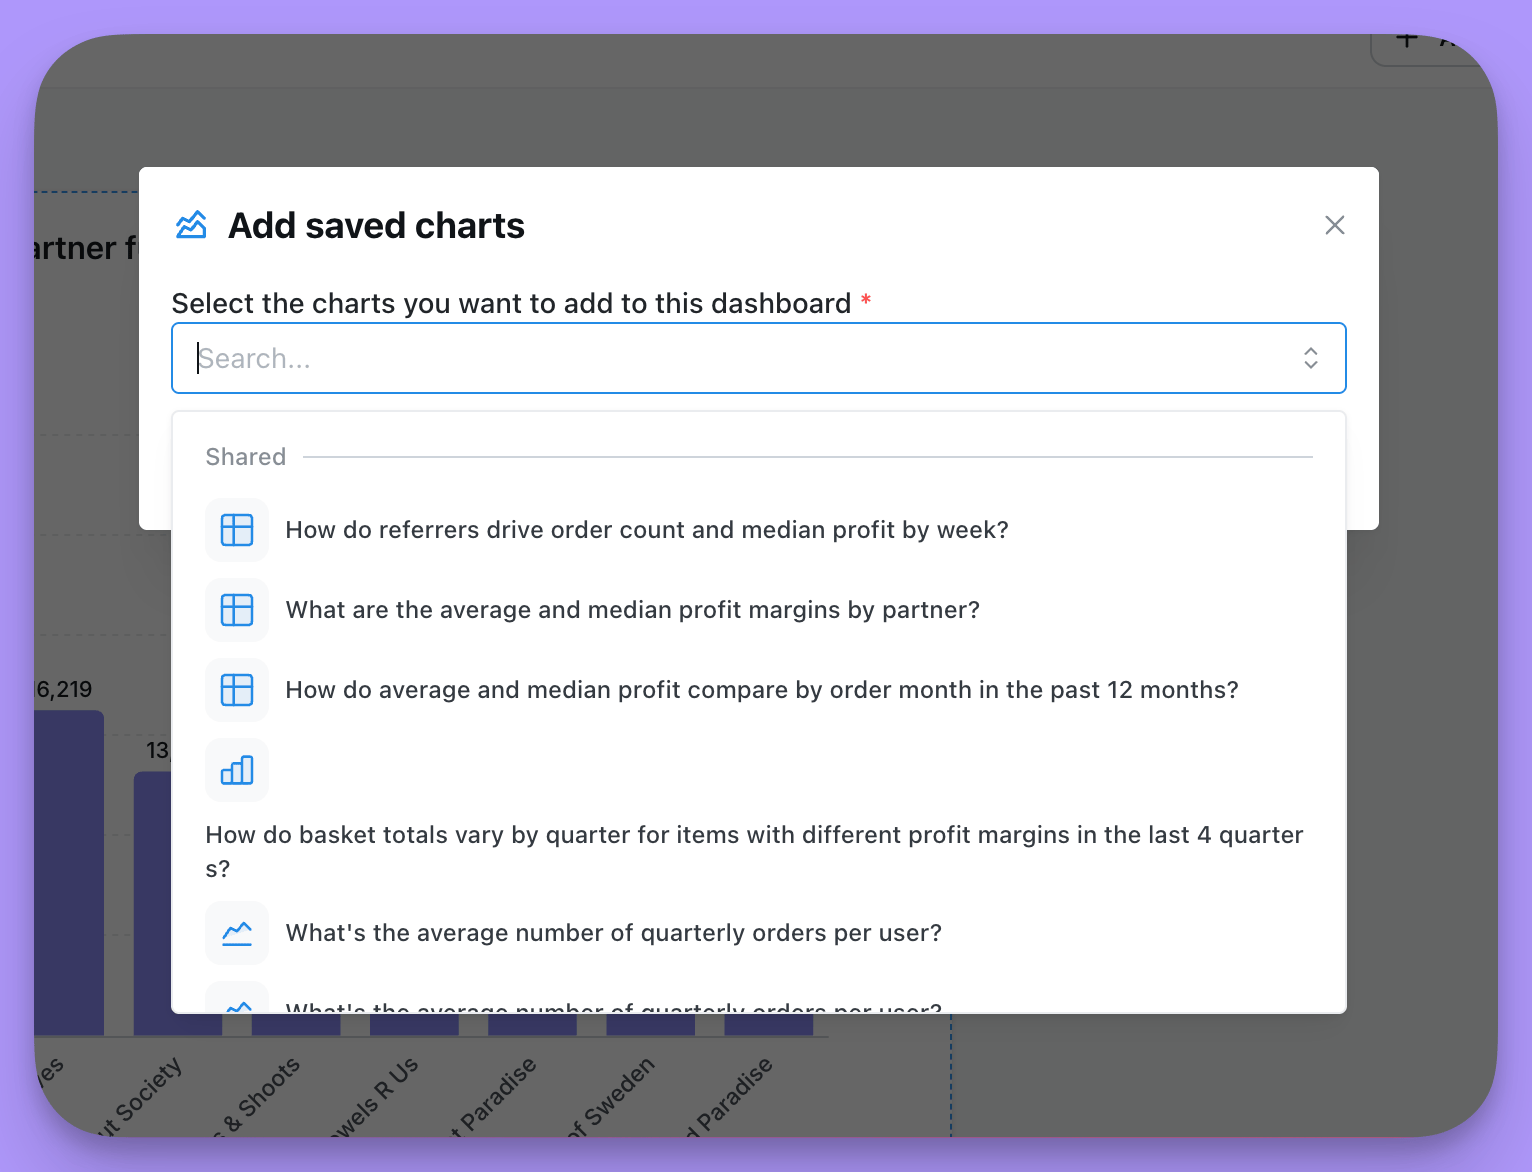 Resize a chart by dragging its lower-right corner, and position it by dragging its center.
## Add markdown and video tiles
Alongside charts, you can add markdown tiles and embedded Loom videos to explain the dashboard to the people using it.
### Markdown tiles
Markdown tiles take text with headers and formatting, code blocks, and images. The built-in editor provides most of the formatting you'll need.
Resize a chart by dragging its lower-right corner, and position it by dragging its center.
## Add markdown and video tiles
Alongside charts, you can add markdown tiles and embedded Loom videos to explain the dashboard to the people using it.
### Markdown tiles
Markdown tiles take text with headers and formatting, code blocks, and images. The built-in editor provides most of the formatting you'll need.
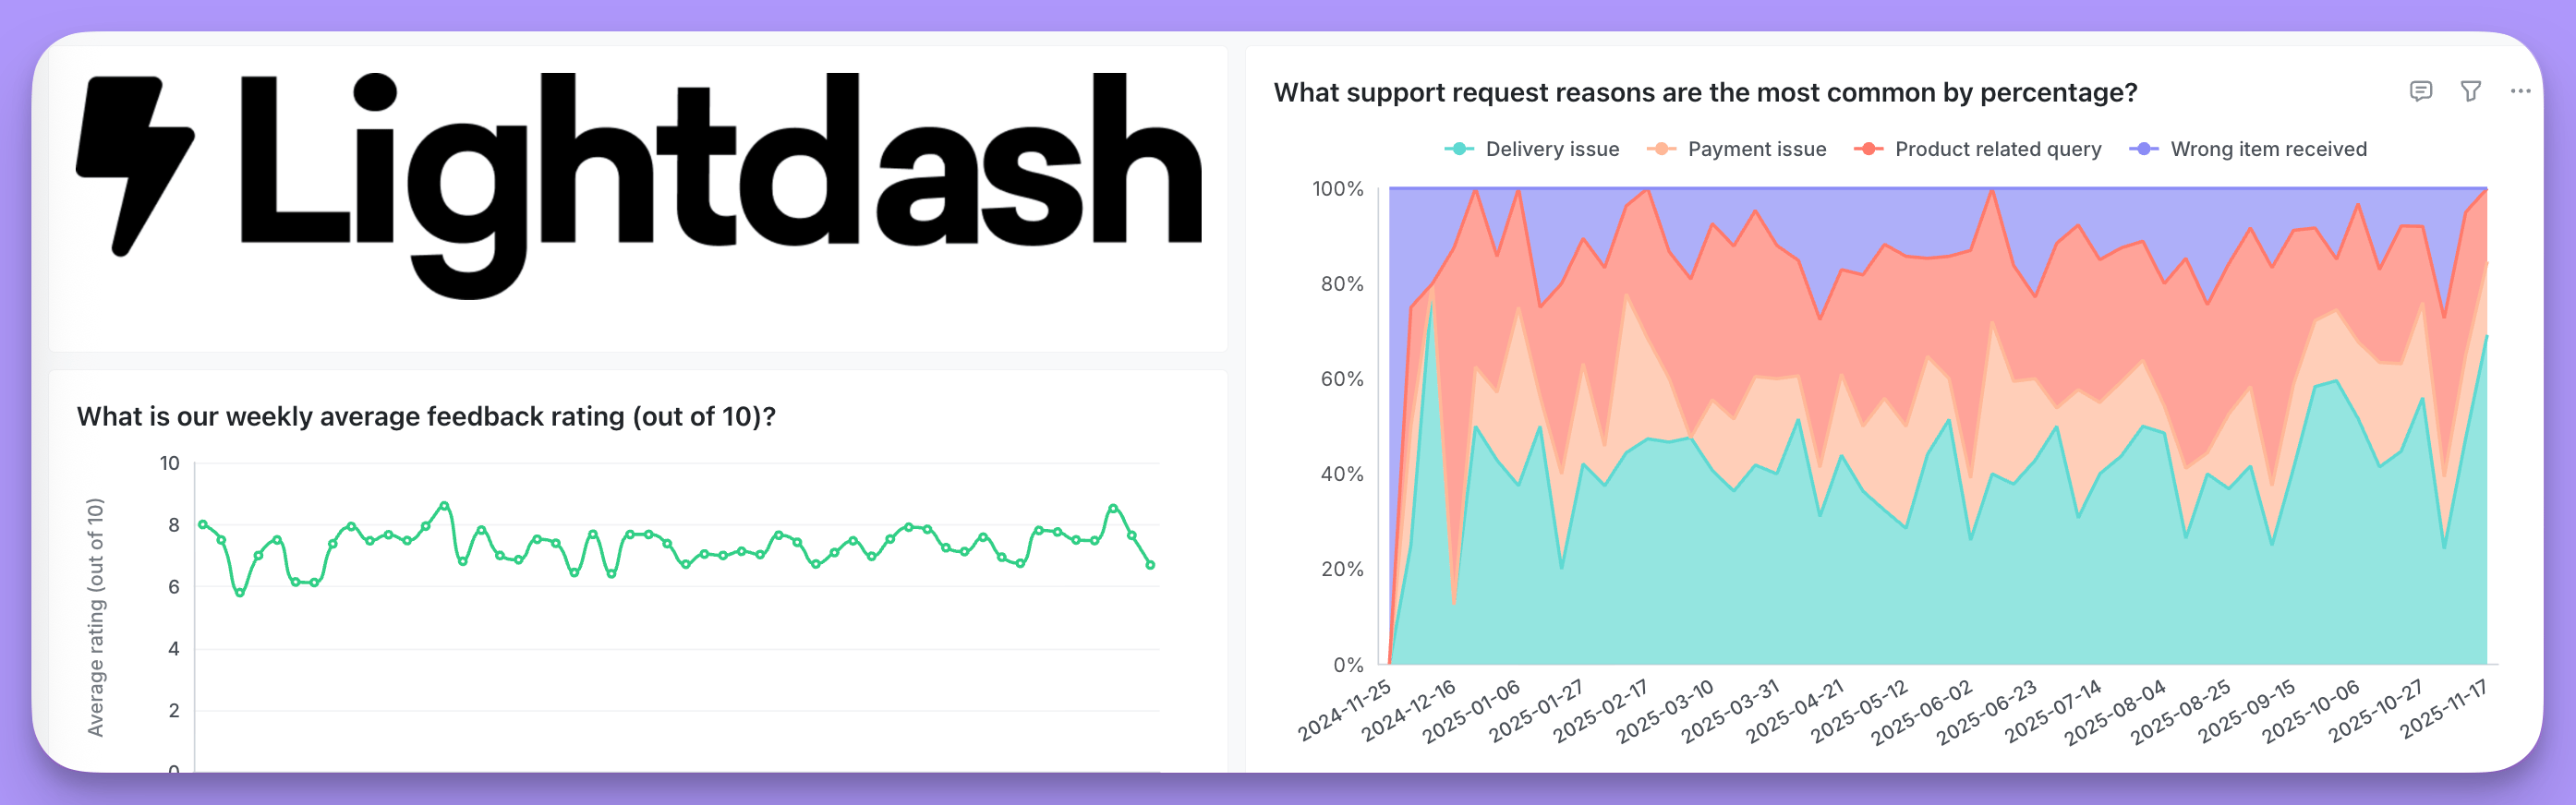 #### Responsive images
To keep images scaling properly as the dashboard resizes, use inline CSS with responsive properties so they aren't stretched or distorted on different screen sizes.
```html theme={null}
#### Responsive images
To keep images scaling properly as the dashboard resizes, use inline CSS with responsive properties so they aren't stretched or distorted on different screen sizes.
```html theme={null}
 ```
For more control over sizing:
```html theme={null}
```
For more control over sizing:
```html theme={null}
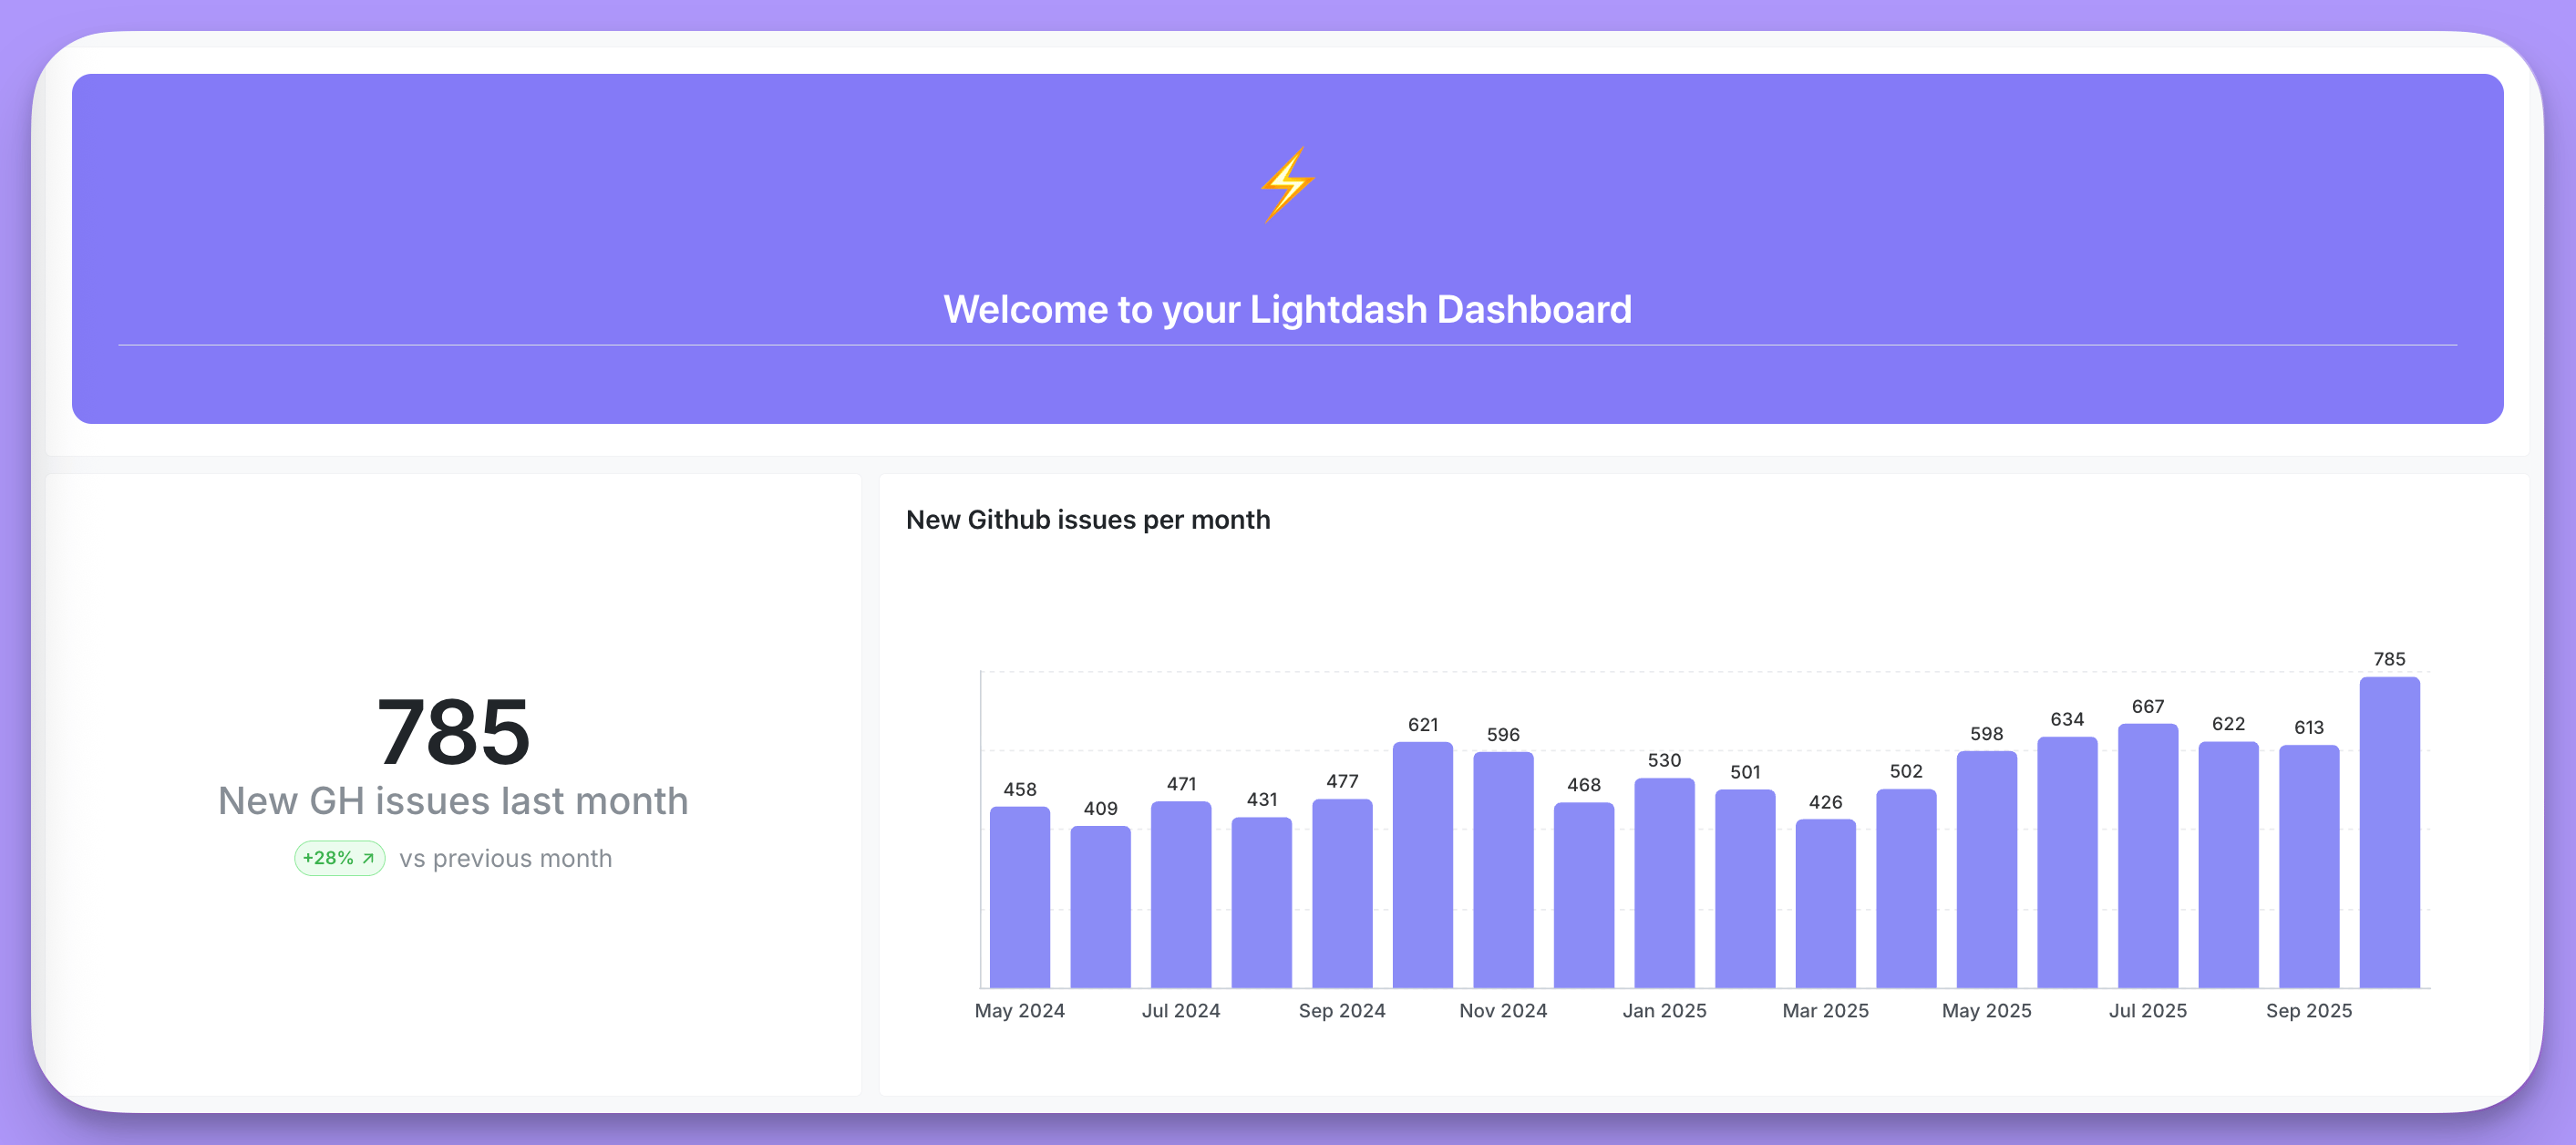 The tile above is built with this code:
```html theme={null}
The tile above is built with this code:
```html theme={null}
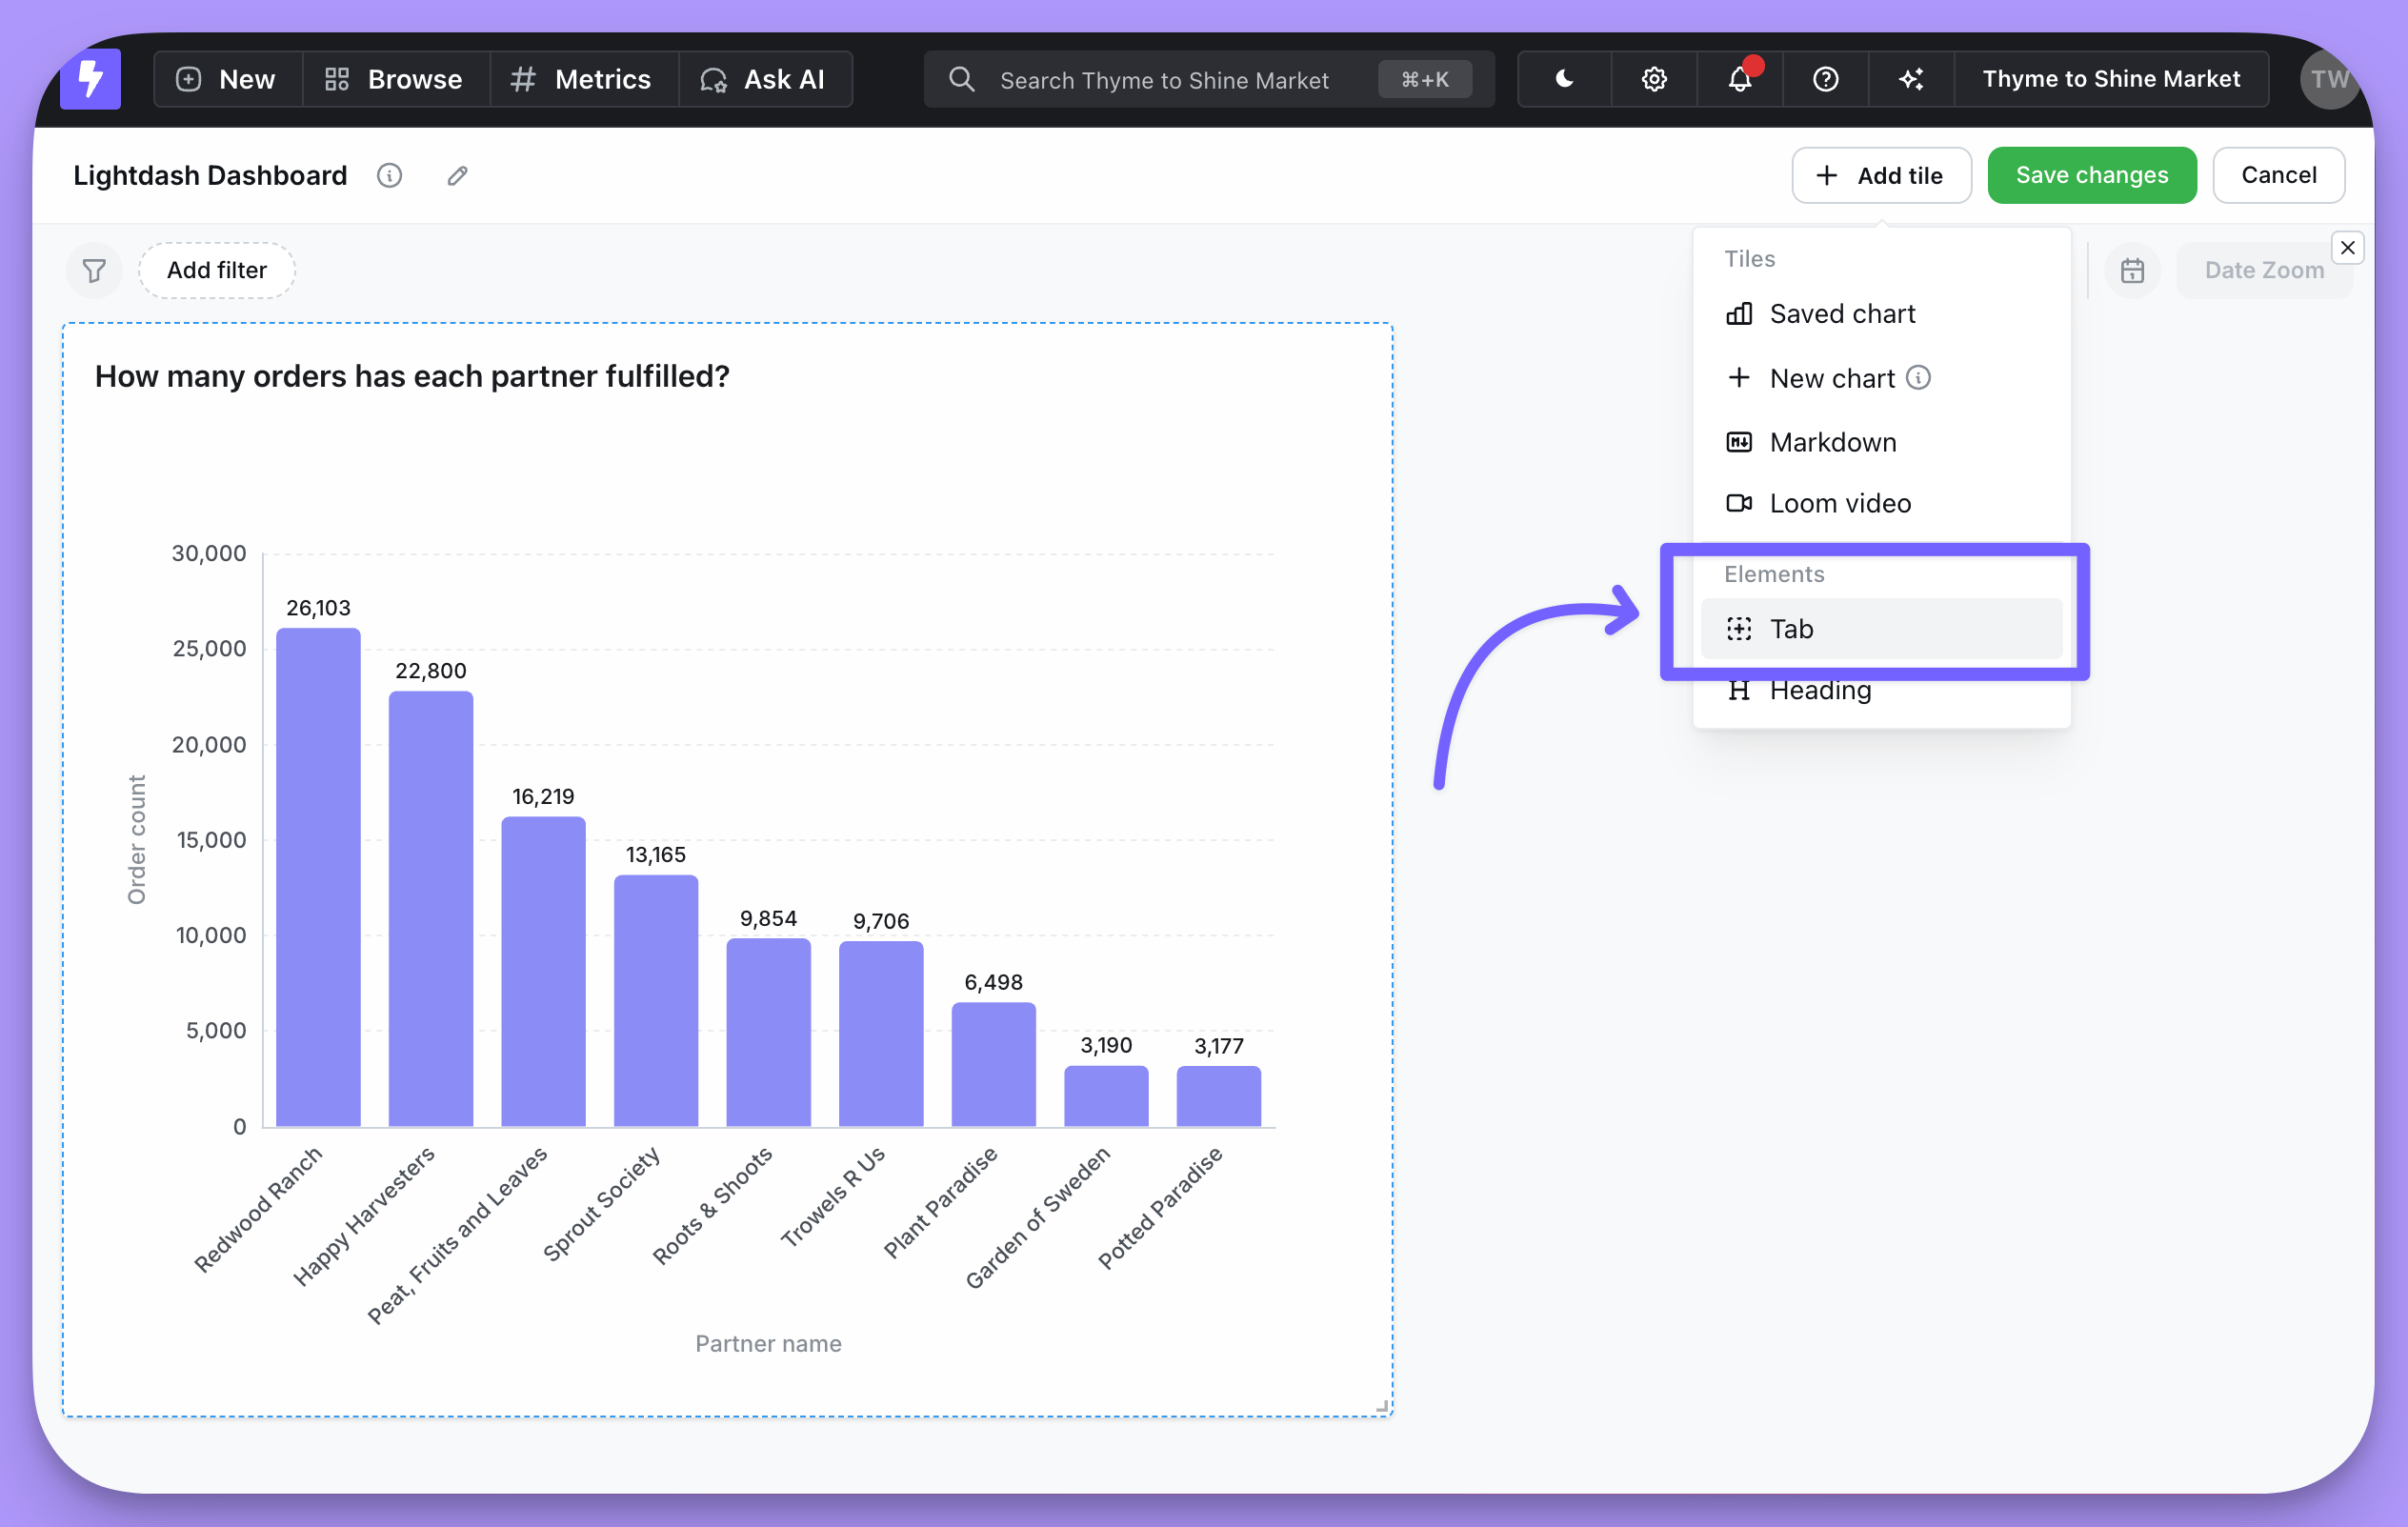 Give the tab a unique name.
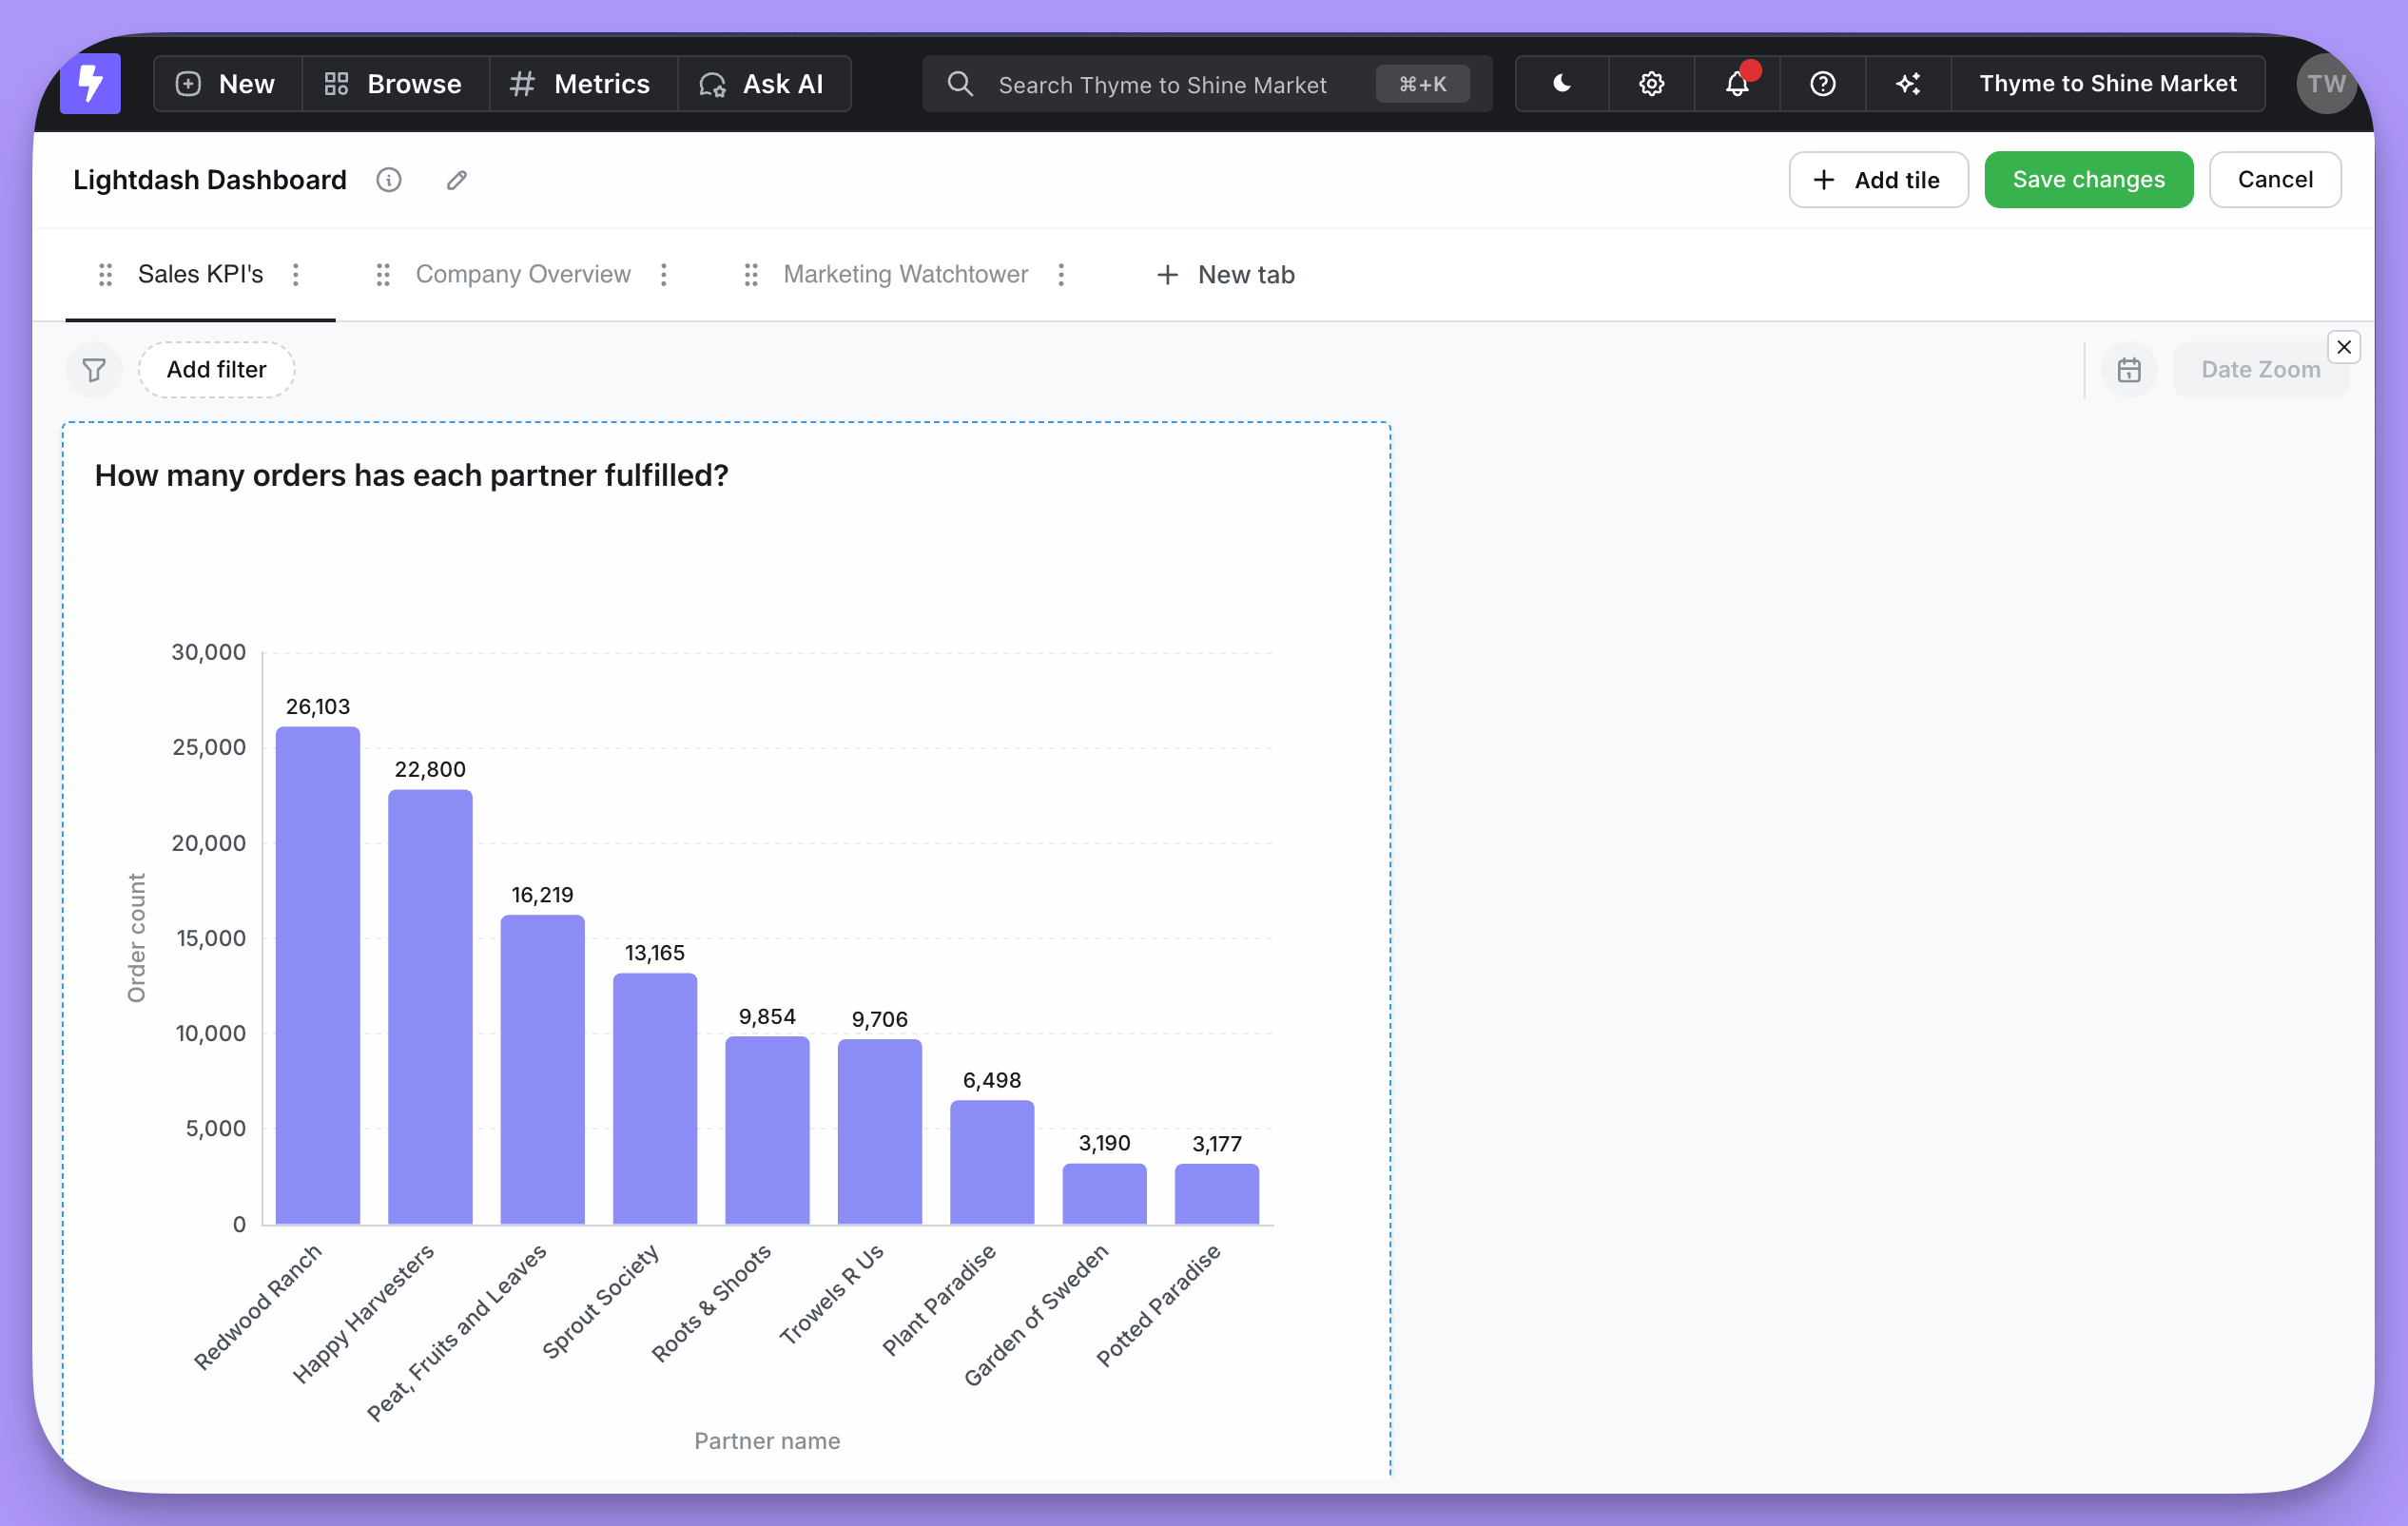
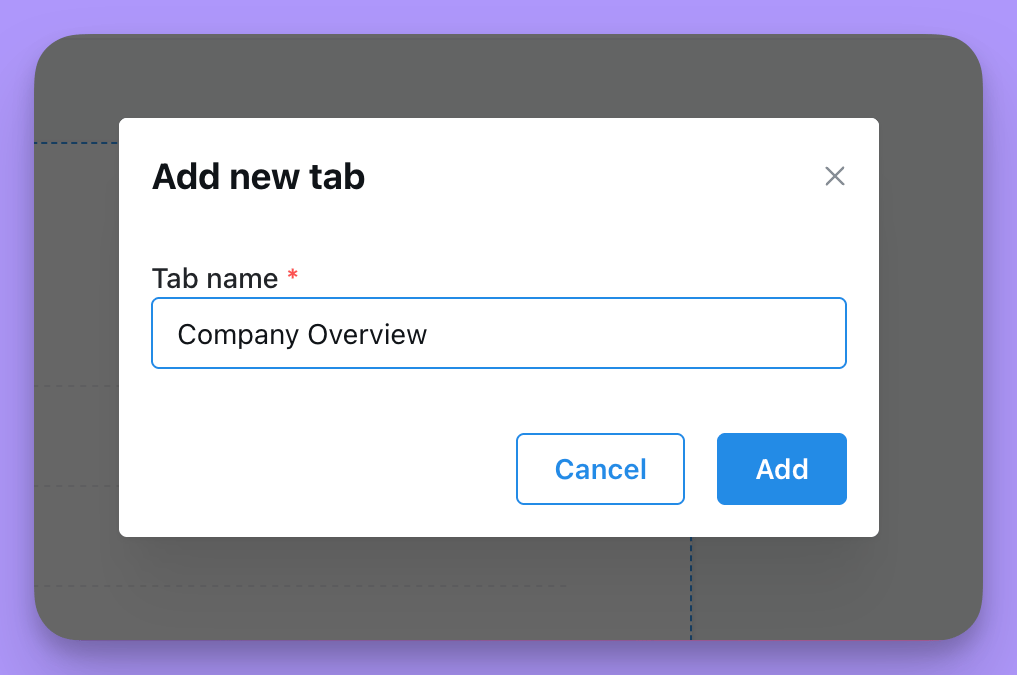 Once created, the tab is a fresh canvas you fill just like any other dashboard.
 ### Editing and removing tabs
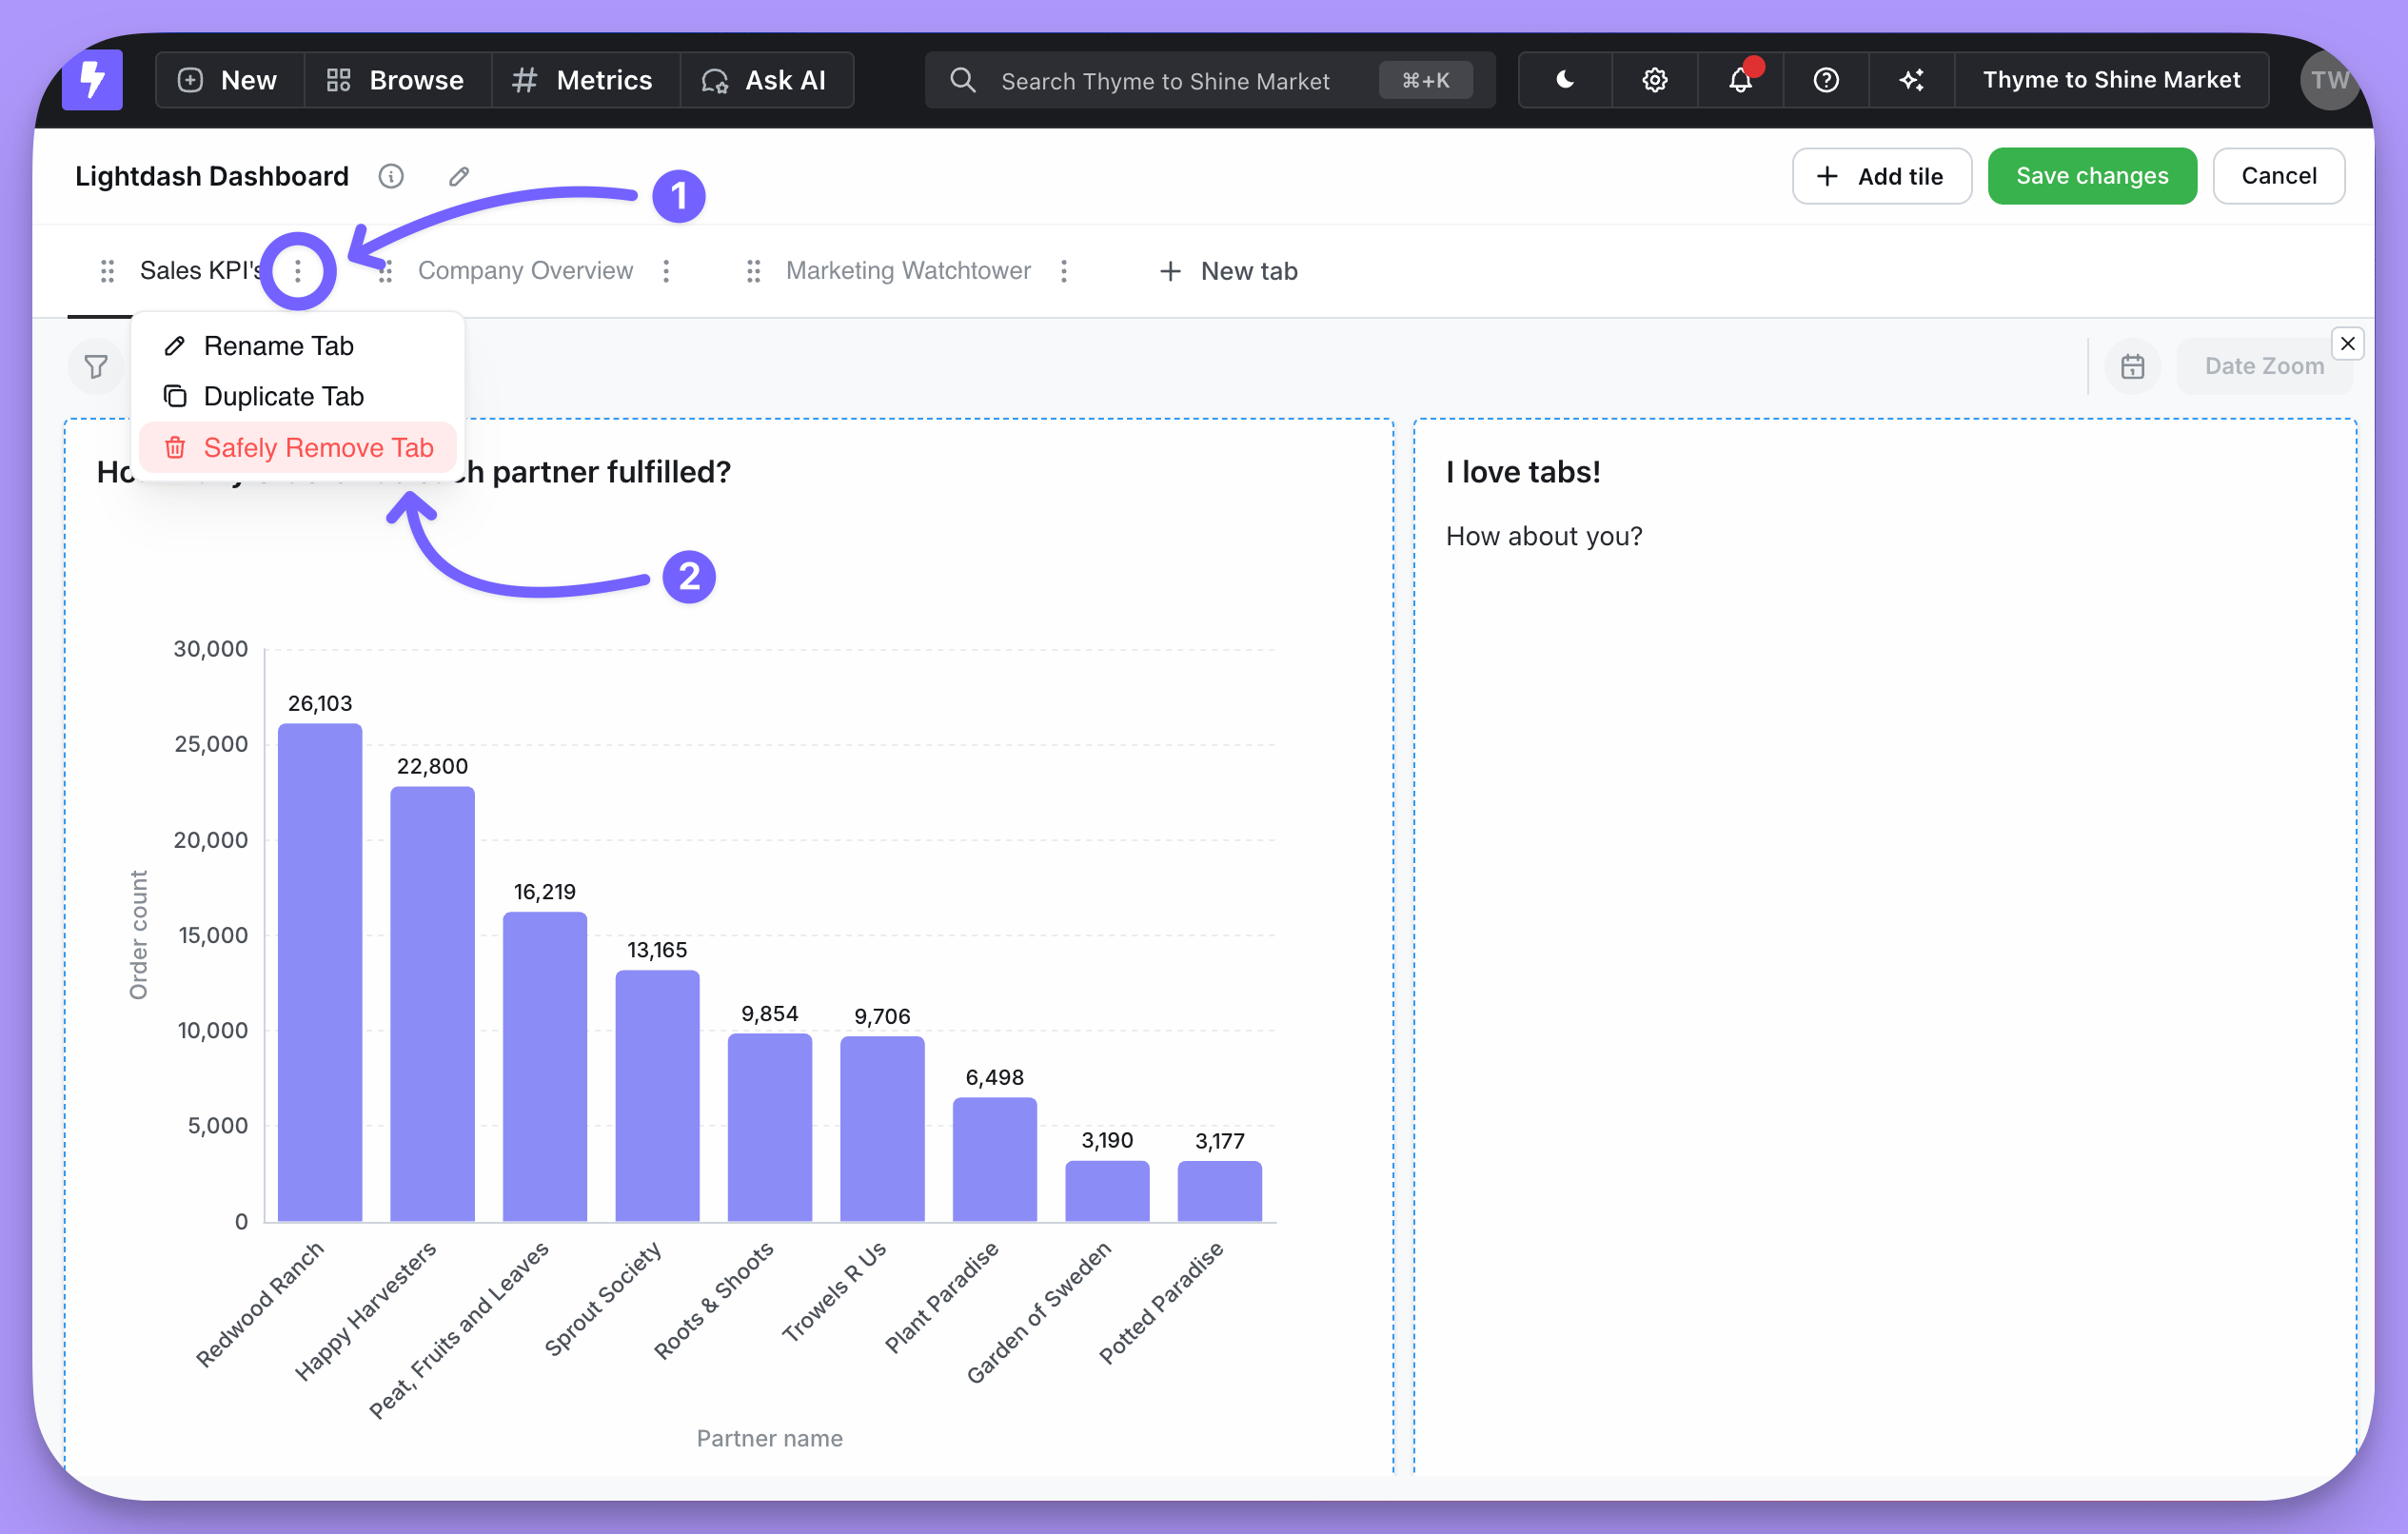
To edit a tab, click the edit icon to the right of its name while in dashboard edit mode. From there you can rename the tab or remove it.
### Editing and removing tabs
To edit a tab, click the edit icon to the right of its name while in dashboard edit mode. From there you can rename the tab or remove it.
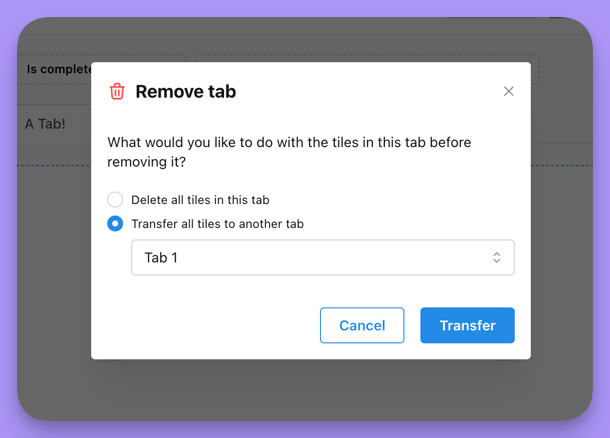
 If the tab has content in it, you get the option to transfer that content to another tab, so you can remove the tab and keep the tiles.
 ### Sharing tabs
Tab content shares just like a regular dashboard. A shareable link navigates straight to the tab that was active when you created it.
### Embedding dashboards with tabs
When you embed a dashboard that has tabs, every tab is appended into a single dashboard, so the embed shows the content of all tabs at once.
## Hide tile headers
Hiding a tile's header gives a cleaner look and more space to the chart content.
1. Enter edit mode by clicking **Edit dashboard**.
2. Click the tile you want to modify and select **Edit tile content**.
3. Click the eye icon next to the tile title to hide it.
The tile now displays without its header. Repeat the steps and click the eye icon again to bring it back.
## Share your dashboard
Copy the URL, or press the 🔗 button, to share the dashboard with other people in your organization. To share it with a particular set of filter values applied, see [sharing a dashboard with filter overrides](/explore/dashboards/filter#sharing-a-dashboard-with-filter-overrides).
### Sharing tabs
Tab content shares just like a regular dashboard. A shareable link navigates straight to the tab that was active when you created it.
### Embedding dashboards with tabs
When you embed a dashboard that has tabs, every tab is appended into a single dashboard, so the embed shows the content of all tabs at once.
## Hide tile headers
Hiding a tile's header gives a cleaner look and more space to the chart content.
1. Enter edit mode by clicking **Edit dashboard**.
2. Click the tile you want to modify and select **Edit tile content**.
3. Click the eye icon next to the tile title to hide it.
The tile now displays without its header. Repeat the steps and click the eye icon again to bring it back.
## Share your dashboard
Copy the URL, or press the 🔗 button, to share the dashboard with other people in your organization. To share it with a particular set of filter values applied, see [sharing a dashboard with filter overrides](/explore/dashboards/filter#sharing-a-dashboard-with-filter-overrides).