> ## Documentation Index
> Fetch the complete documentation index at: https://docs.lightdash.com/llms.txt
> Use this file to discover all available pages before exploring further.
# Custom charts
> Extend Lightdash beyond the built-in chart types with the chart library, Chart Studio, and Vega-Lite
Custom charts are what you reach for when the built-in chart types don't cover the visualization you need. Every custom chart renders from the same query as any other Lightdash chart, so it respects the same permissions, filters, and dashboard interactions.
There are two ways to bring a custom chart type into your project:
* **[Chart library](/visualizations/chart-library)** — a catalog of ready-made chart types built by Lightdash. Install one and it appears in the chart type gallery for everyone in the project.
* **[Chart Studio](/visualizations/chart-studio)** — an agentic in-platform interface for building your own reusable chart types. Describe the chart you want, Lightdash builds it, and anyone in the project can use it like a built-in chart type.
More basic chart customizations can be [configured using Vega-Lite](#vega-lite-charts) without an Enterprise license.
Custom chart types are an enterprise feature and require the [data apps runtime](/self-host/enterprise-features/data-apps) to be enabled.
## Picking a chart type
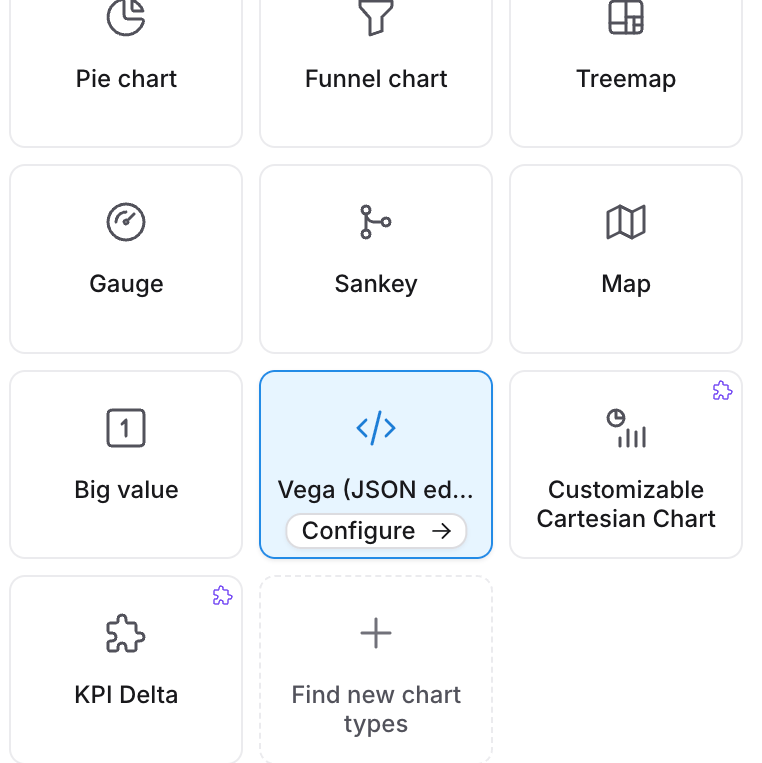
Run a query, then open **Configure** in the Explorer and click **Change** to open the chart type gallery. Installed custom chart types appear in the **Custom** group at the top, alongside any chart types your team built in Chart Studio. Pick one, then map its inputs to your query's fields in the **General** tab.
Saved charts remember which chart type they use and which version of it. Updating a chart type in the library or in Chart Studio never changes existing saved charts — see [Versions and upgrades](/visualizations/chart-studio#versions-and-upgrades) for how to move a saved chart to a newer version.
## Custom charts and data apps
Custom chart types run in the same isolated sandbox that powers [data apps](/data-apps), and they round-trip through the CLI as their own [as-code resource](/visualizations/chart-studio#chart-types-as-code). They are not data apps, though — the two solve different jobs:
* A **data app** is a full interactive application: its own layout, its own queries, and any interactions the agent builds into it. It lives in a space like a dashboard.
* A **custom chart type** is a chart renderer. It has no query of its own — the Explorer runs the query, and the chart type turns those results into a visualization. It shows up in the chart type gallery, not as its own object.
Because they share the runtime, both need the [data apps runtime](/self-host/enterprise-features/data-apps) enabled, and both can reach outside services through [external connections](/data-apps/external-connections).
## Vega-Lite charts
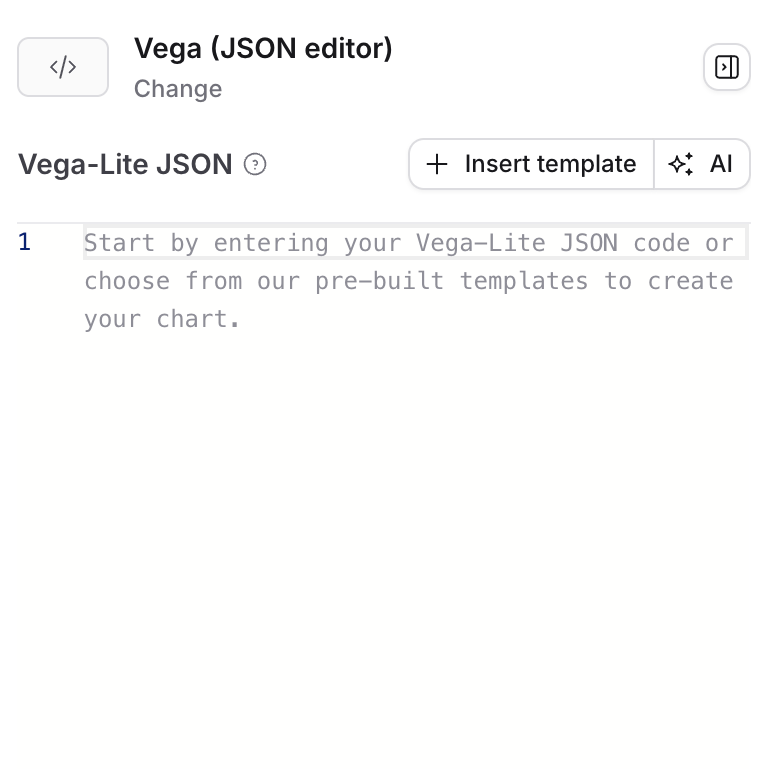
For basic one-off customizations without Enterprise, write the chart as a [Vega-Lite](https://vega.github.io/vega-lite/examples) spec in the JSON editor. The spec belongs to that saved chart alone and isn't reusable elsewhere. Open **Configure** in the Explorer, click **Change**, and pick **Vega (JSON editor)** from the **Built in** group in the chart type picker.
Like custom charts, Vega-Lite unlocks options the built-ins don't cover — heatmaps, bubble plots, box plots, trellis charts, and more. Load a template from the editor to start from a working spec, or copy one from the [Vega-Lite examples gallery](https://vega.github.io/vega-lite/examples). LLMs are good at editing Vega-Lite specs when you want to iterate on one.
### Migrating Vega-Lite charts to custom chart types
The fastest way to bring a chart you've configured in Vega-Lite into the newer custom chart type system is to share the Vega-Lite JSON spec and a screenshot with the agent in Chart Studio. The agent can then create a fully interactive custom chart type which you can shift any existing charts to.
### Known limitations
Vega charts trade dashboard interactivity for spec flexibility:
* **Drill-down** — drilling into a metric by grouping it with a dimension isn't available.
* **View underlying data** — clicking a data point to see the underlying records isn't supported.
* **Cross-filtering** — selecting elements in a Vega chart doesn't filter other tiles on the dashboard.
If you need those interactions, use a built-in chart type or a custom chart type from the [chart library](/visualizations/chart-library) or [Chart Studio](/visualizations/chart-studio).