Using Filters
Filters appear at the top of the Explore view or dashboard and allow users to change the data being pulled into your charts.
For example, if I built a chart showing the revenue over time, but I wanted it to only have the revenue I made in France, I could add a filter for country is equal to France.
You can add filters to your charts individually in the Explore view, or across all of your charts in your dashboard. Don't worry, we'll walk you through both and you'll be a filter pro in no time!
If you're a developer, you can add permanent filters to tables using the sql_filter yaml option. For more information see Table configuration
General filters tips
Here are some general tips about filters that apply to using them in both the Explore view and in dashboards.
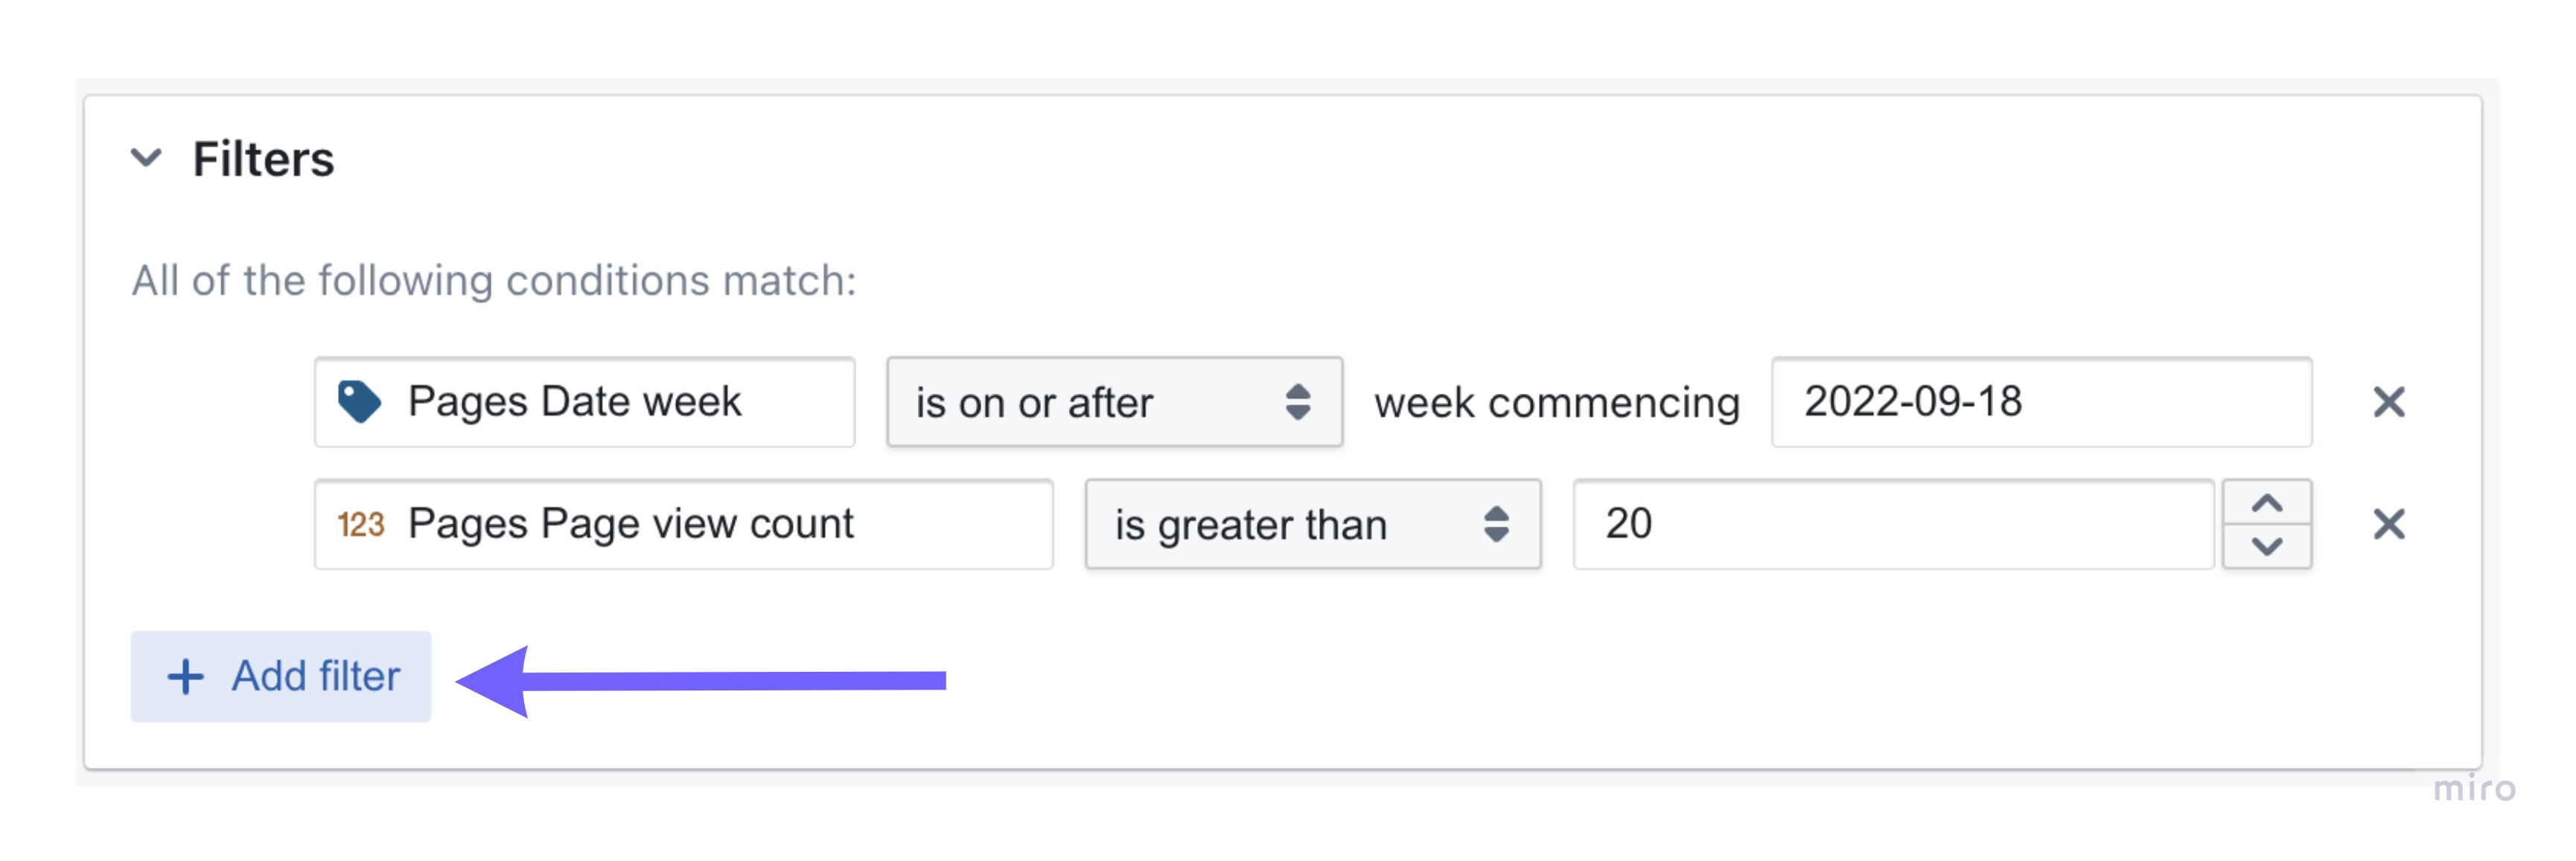
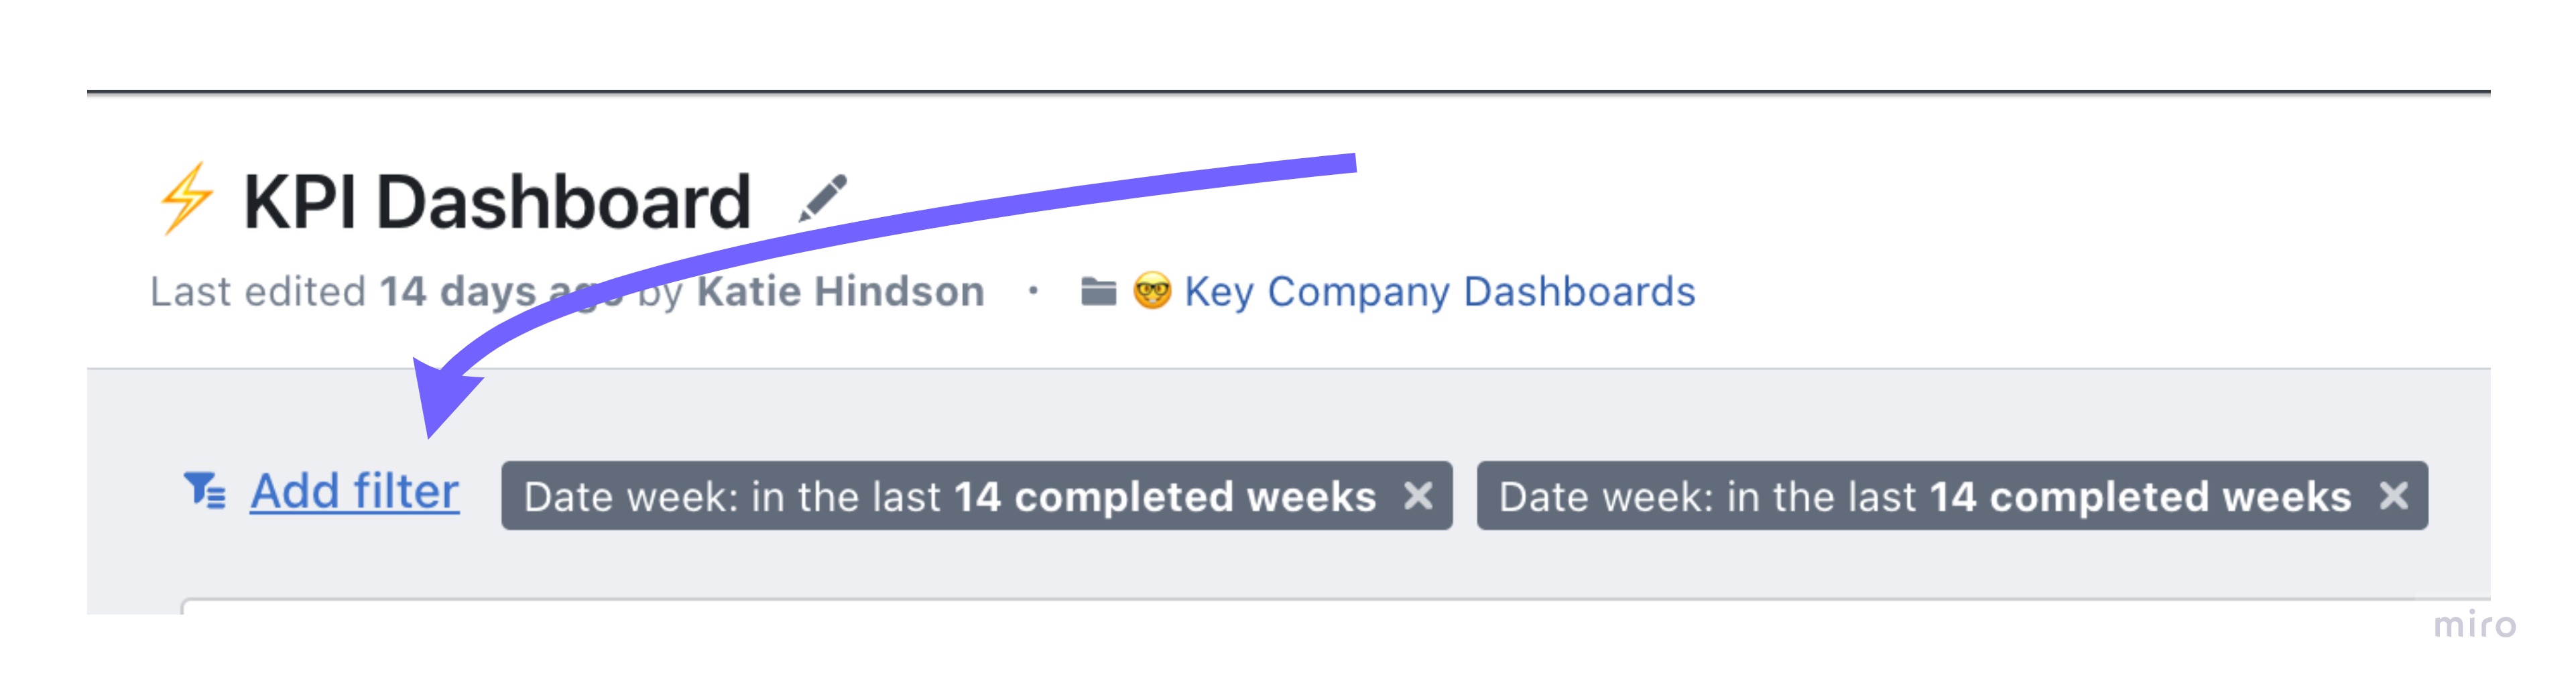
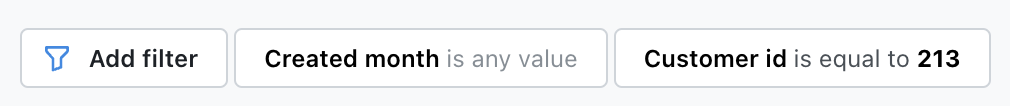
If you want to have multiple filters, just click + Add filter
In the Explore view:
Or in a dashboard:
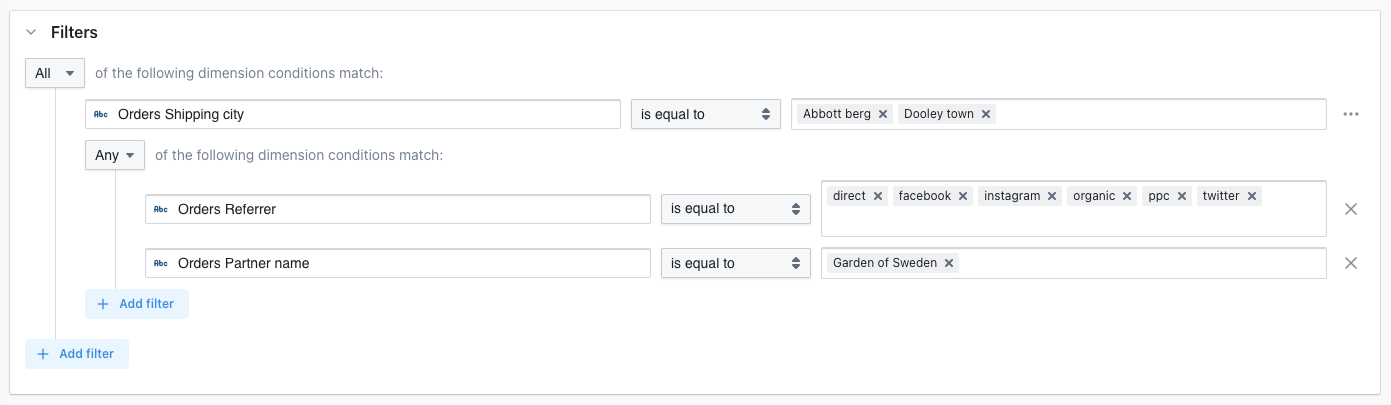
If you add multiple filters, you can choose to have ALL or ANY of the conditions match
To choose which option you want, just click on the drop-down menu on the top-left of the filters.
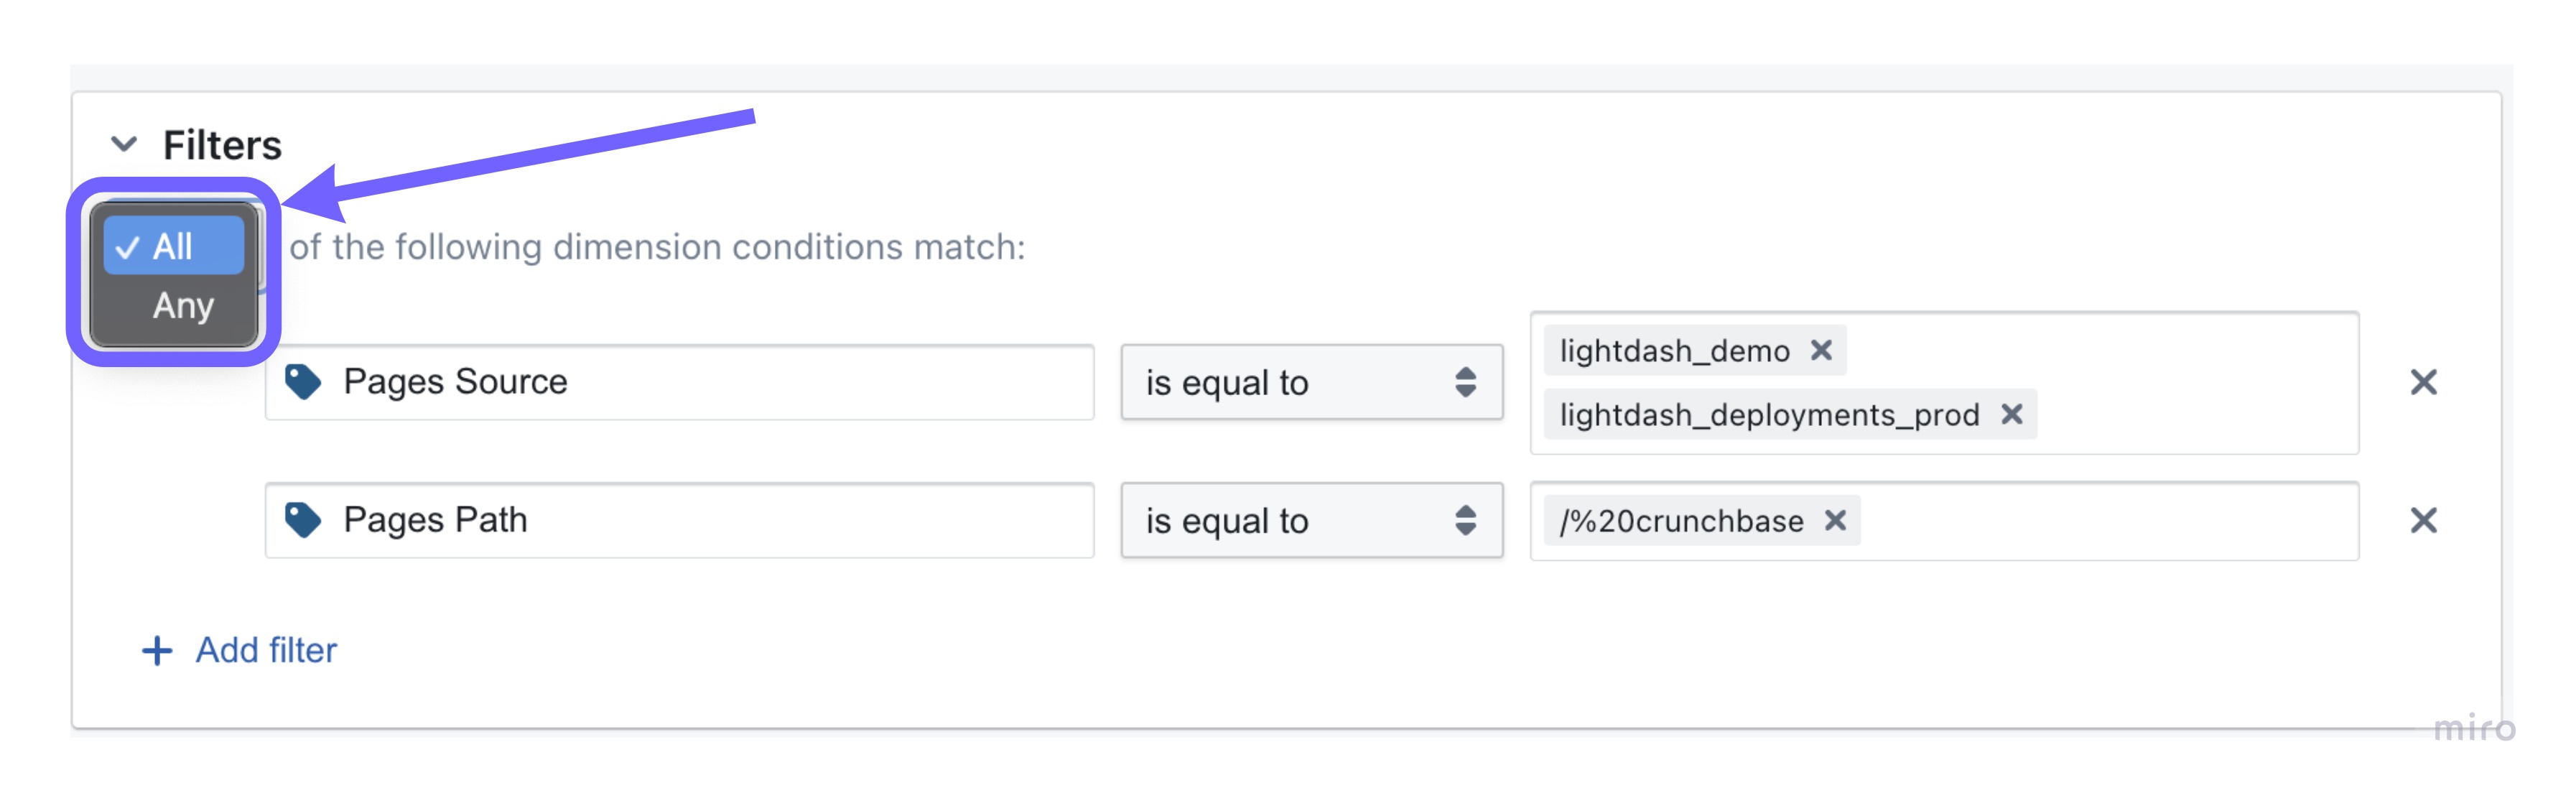
Selecting ALL conditions to match means you'd add an AND between your conditions in SQL. So, the example in the Explore view above would give us compiled SQL that looks like:
WHERE (
  (pages.source) IN ('lightdash_demo', 'lightdash_documentation')
  AND (pages.path) = '/20%crunchbase'
Selecting ANY conditions to match means you'd add an OR between your conditions in SQL. So, the example in the Explore view above would give us compiled SQL that looks like:
WHERE (
  (pages.source) IN ('lightdash_demo', 'lightdash_documentation')
  OR (pages.path) = '/20%crunchbase'
If you want to include multiple values in your filter, just hit enter between each value entry in your list
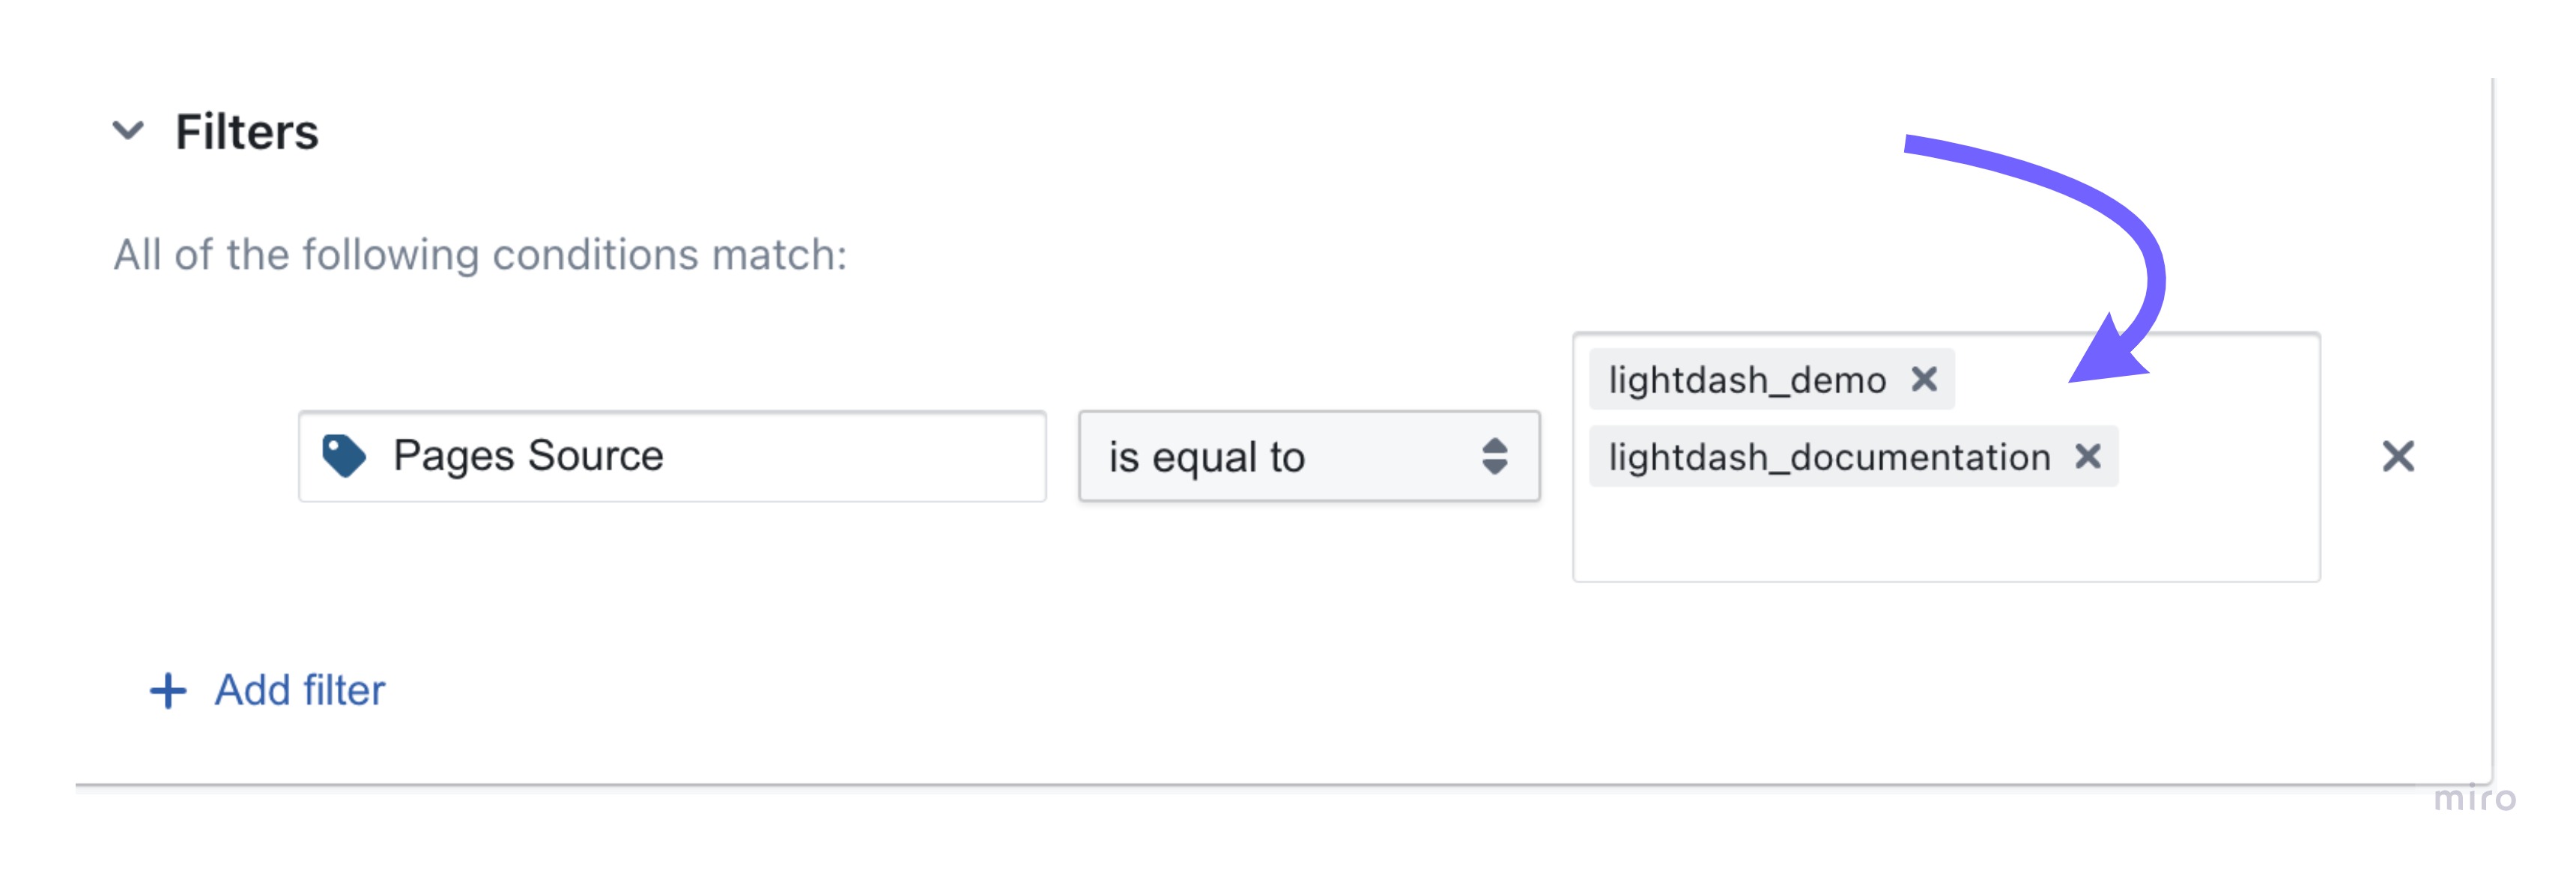
The listed values are separated by an OR statement in the compiled SQL. E.g. the above would give us:
WHERE (
  (pages.source) = 'lightdash_demo'
   OR (pages.source) = 'lightdash_documentation'
)
To learn about the types of filters we have available, check out the filters reference doc.
Check out our filters reference doc here to see a list of all available filters and their uses.
Adding filters in the Explore view
There are a couple of ways that you can add filters in the Explore view.
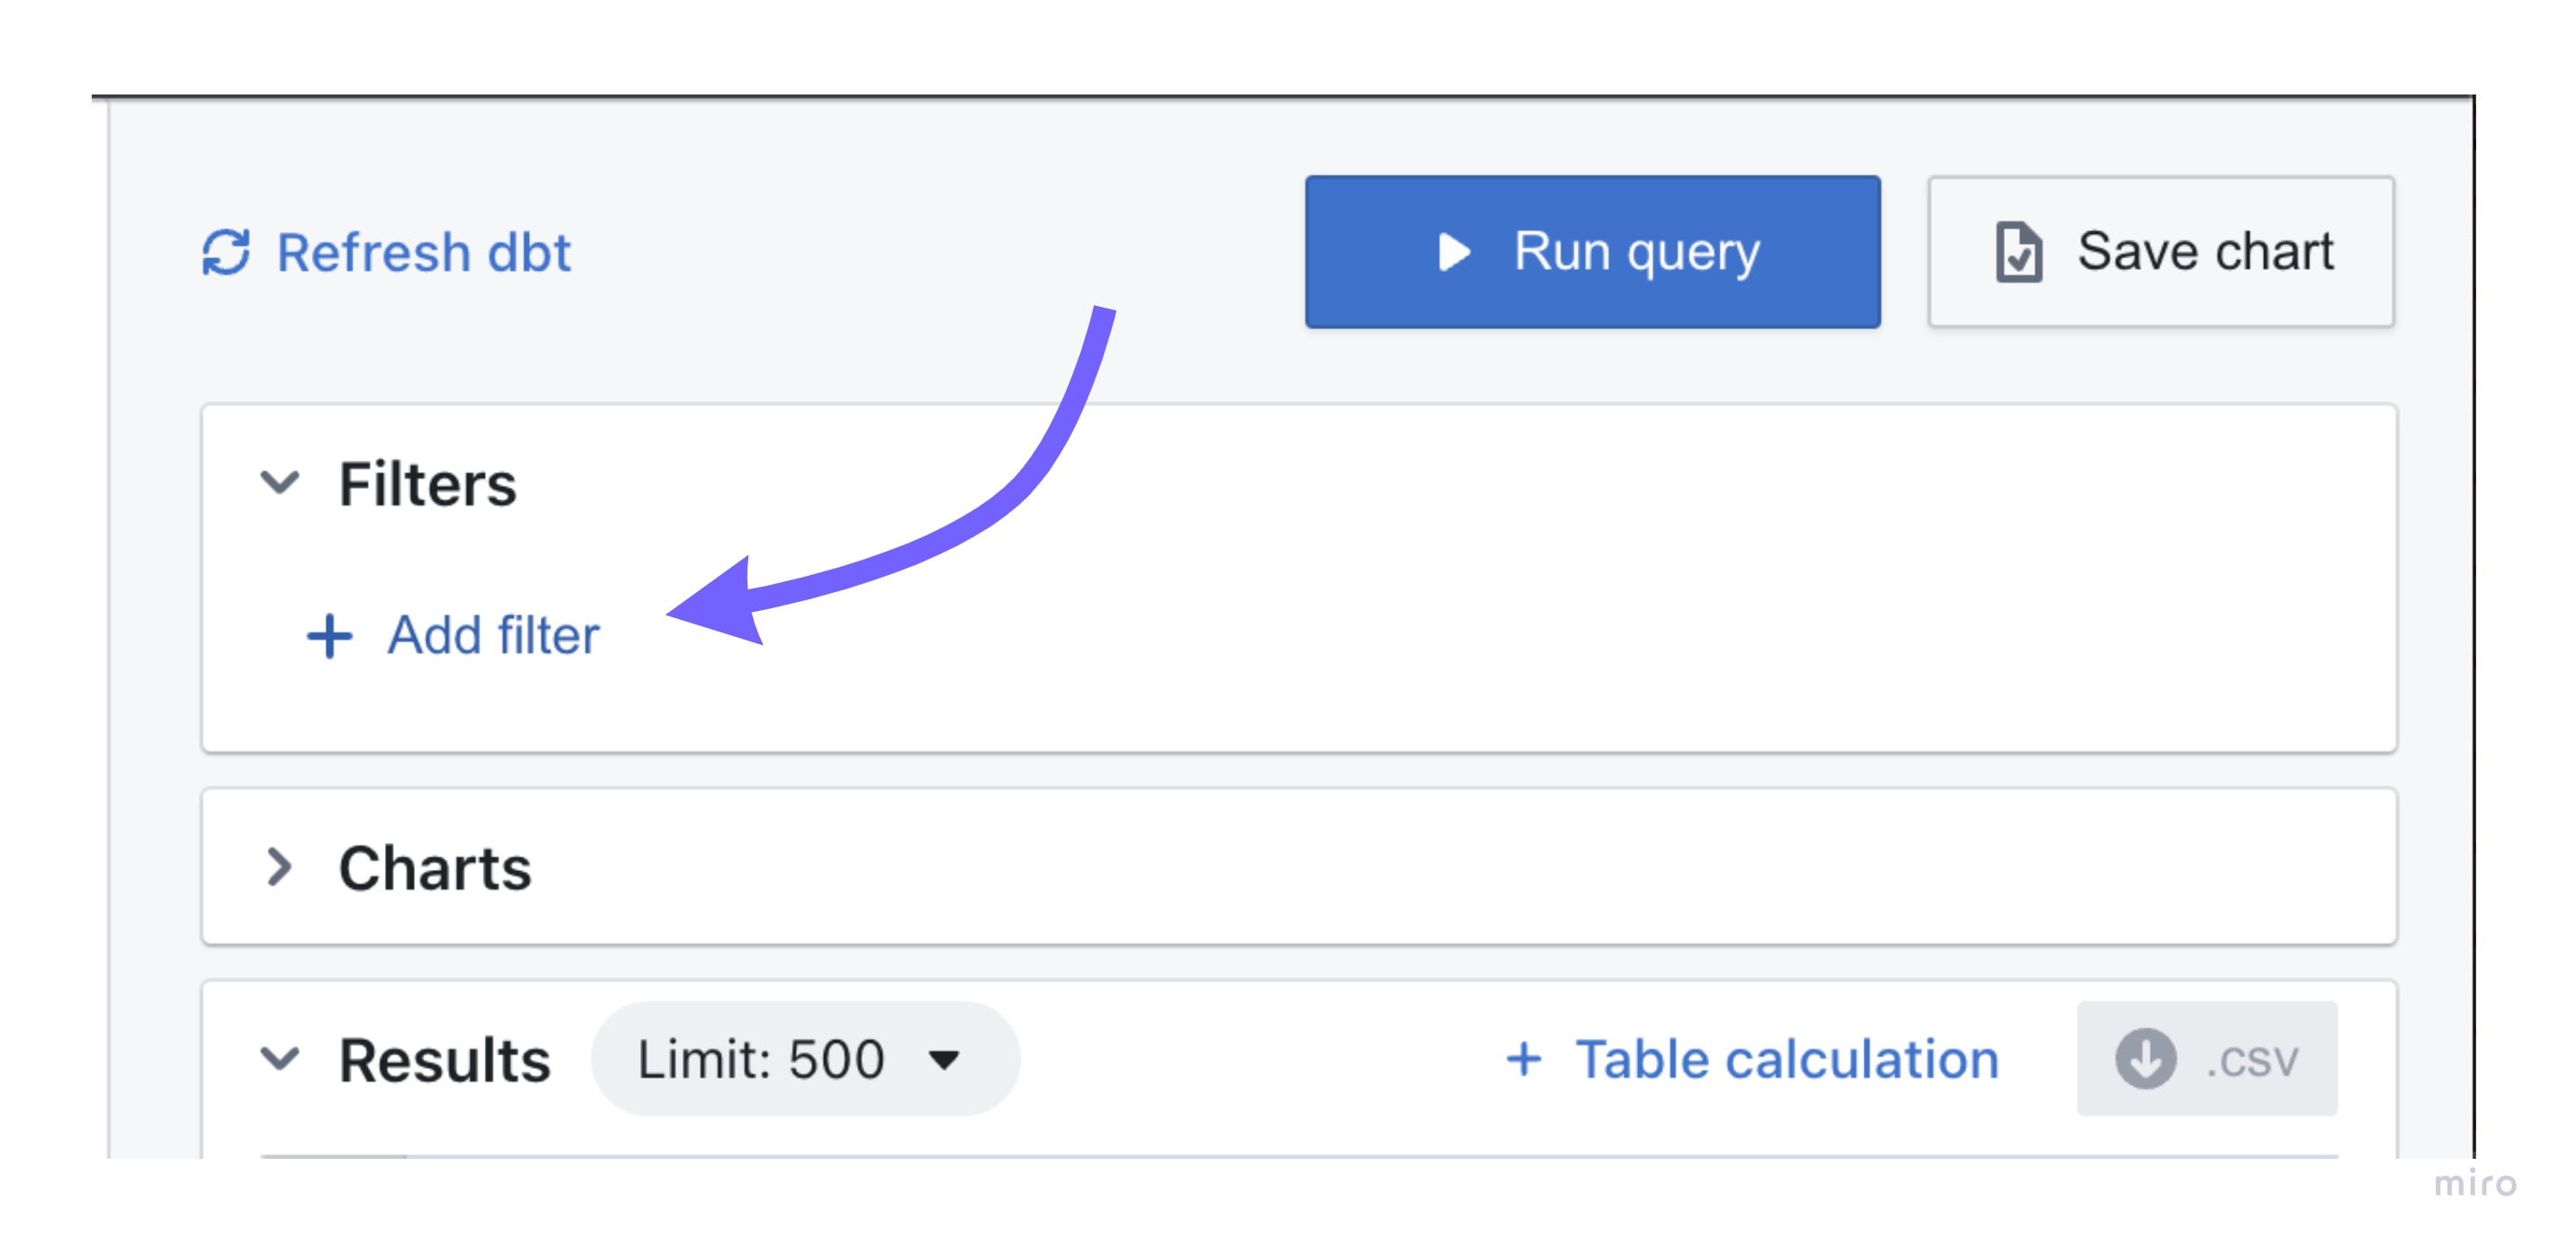
Adding a filter from within the Filters tab
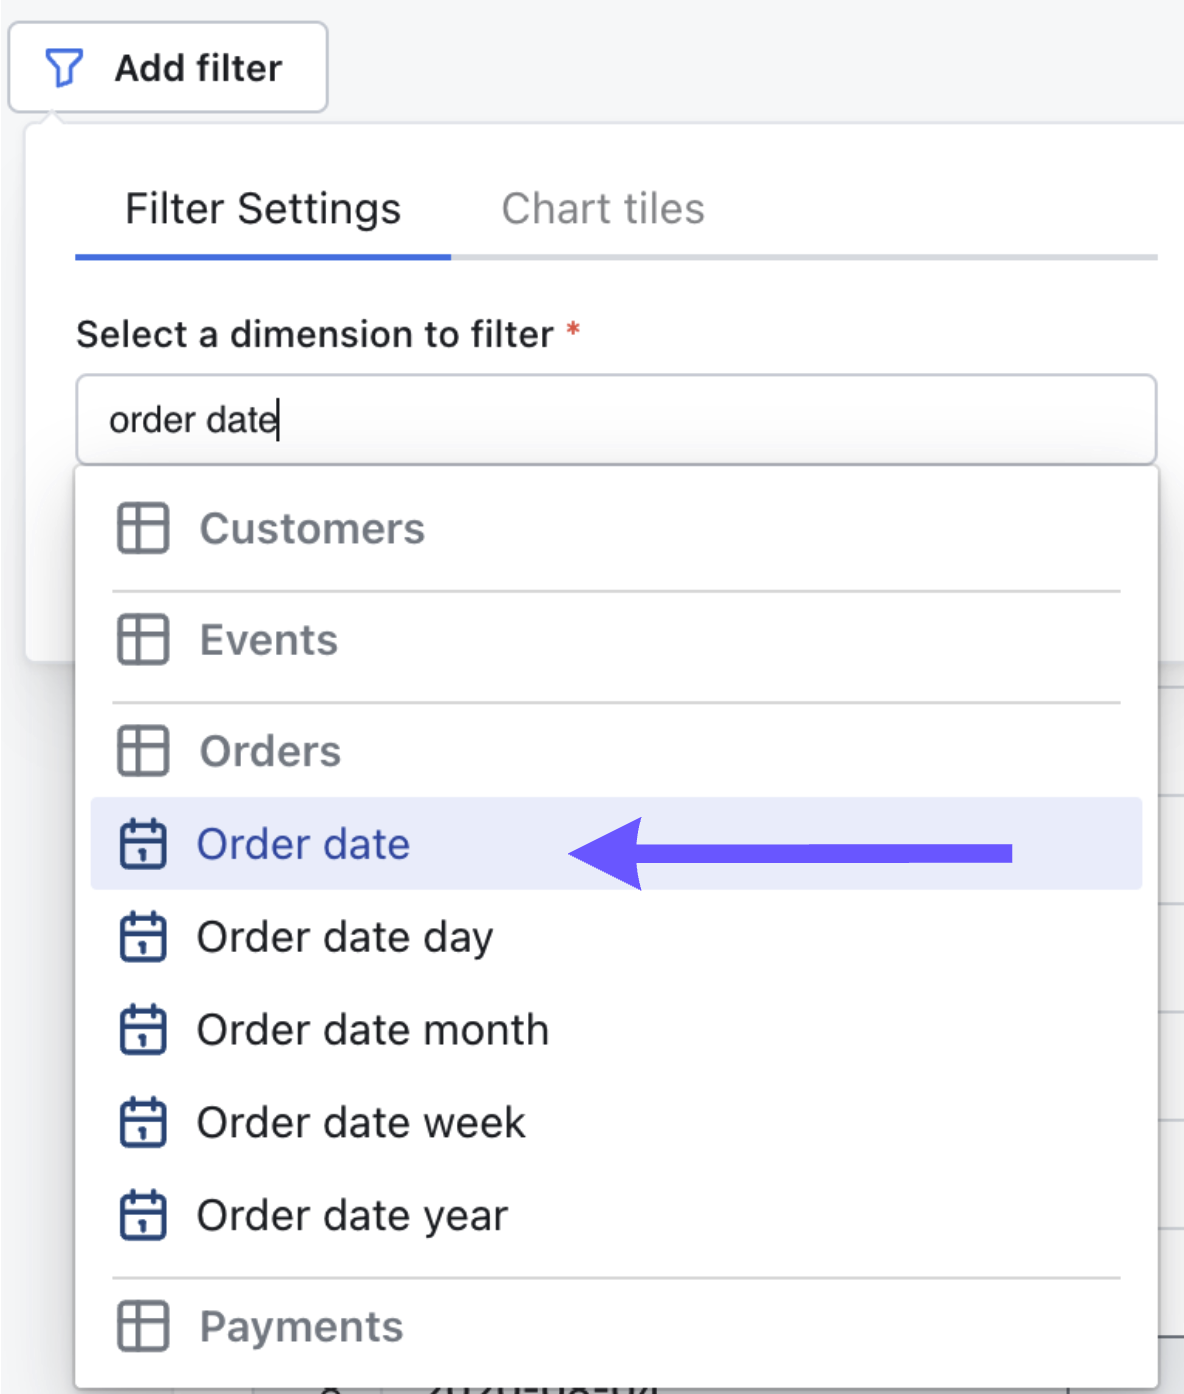
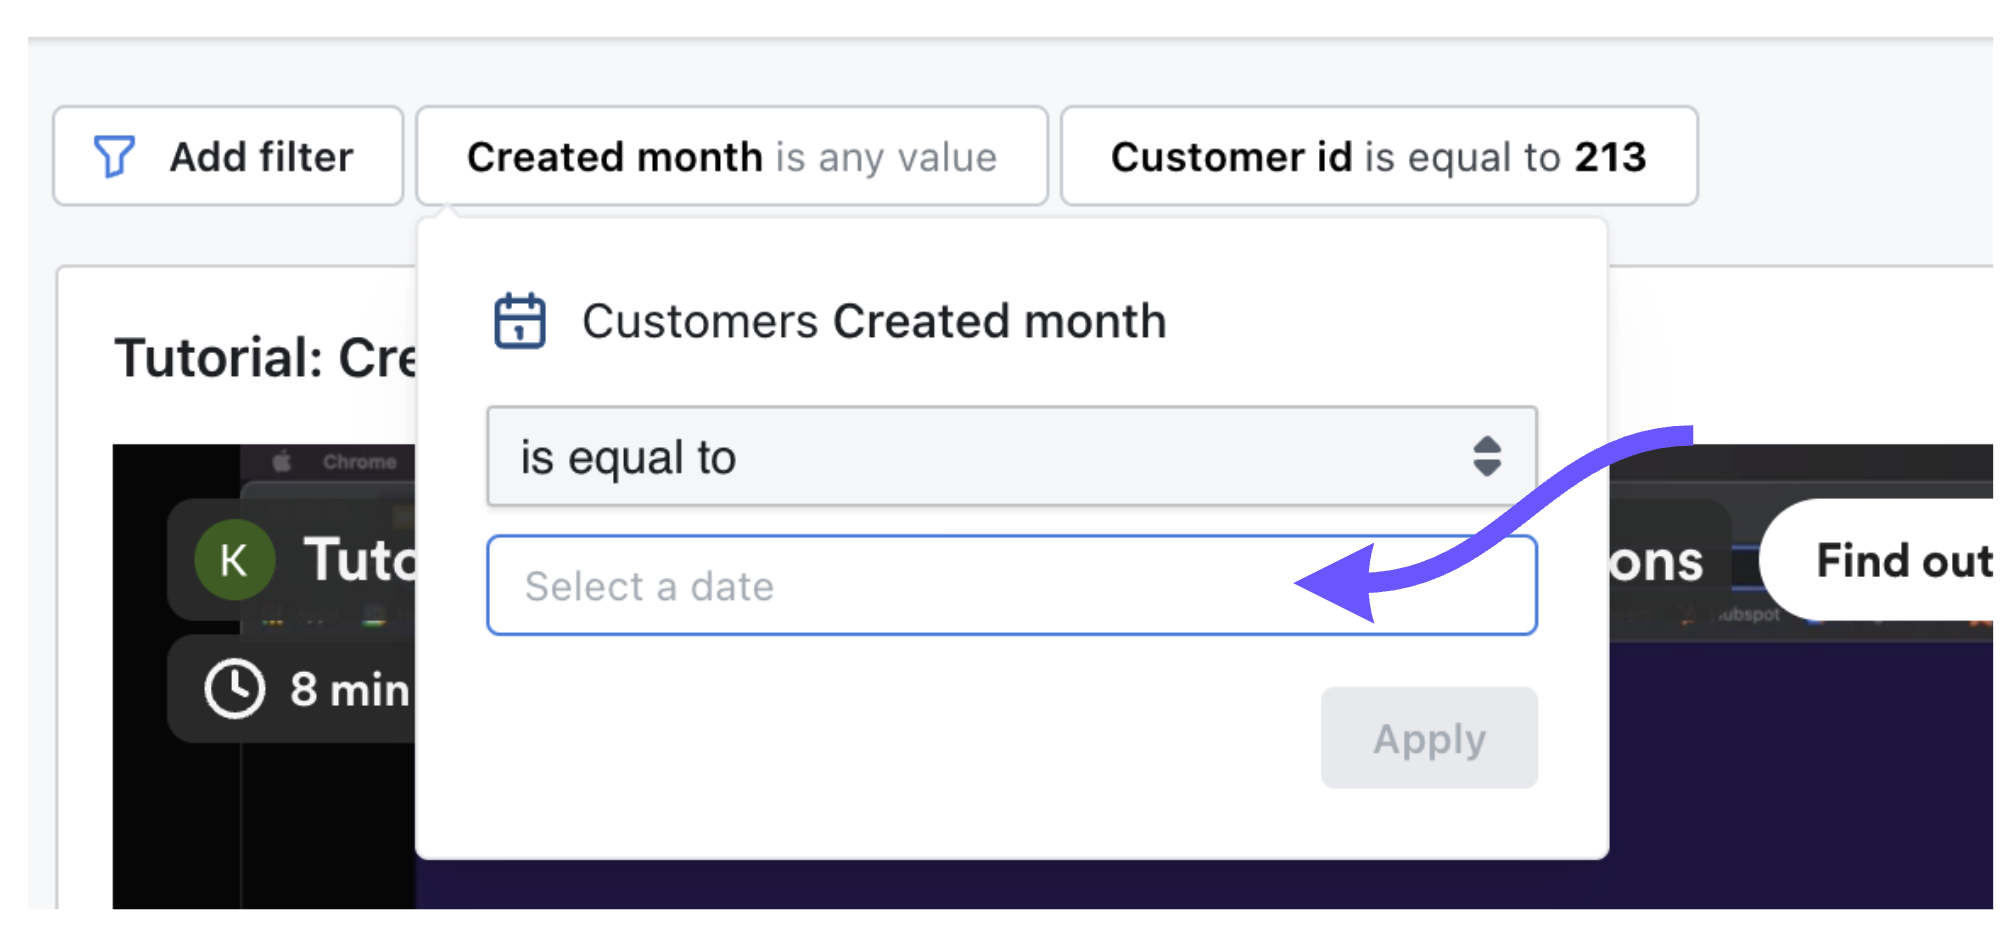
In the Explores view, you can add filters from within the Filters tab. Just click to open the toggle, then click add filter.
Select the field you would like to filter from the drop-down list, then select the filtering options.
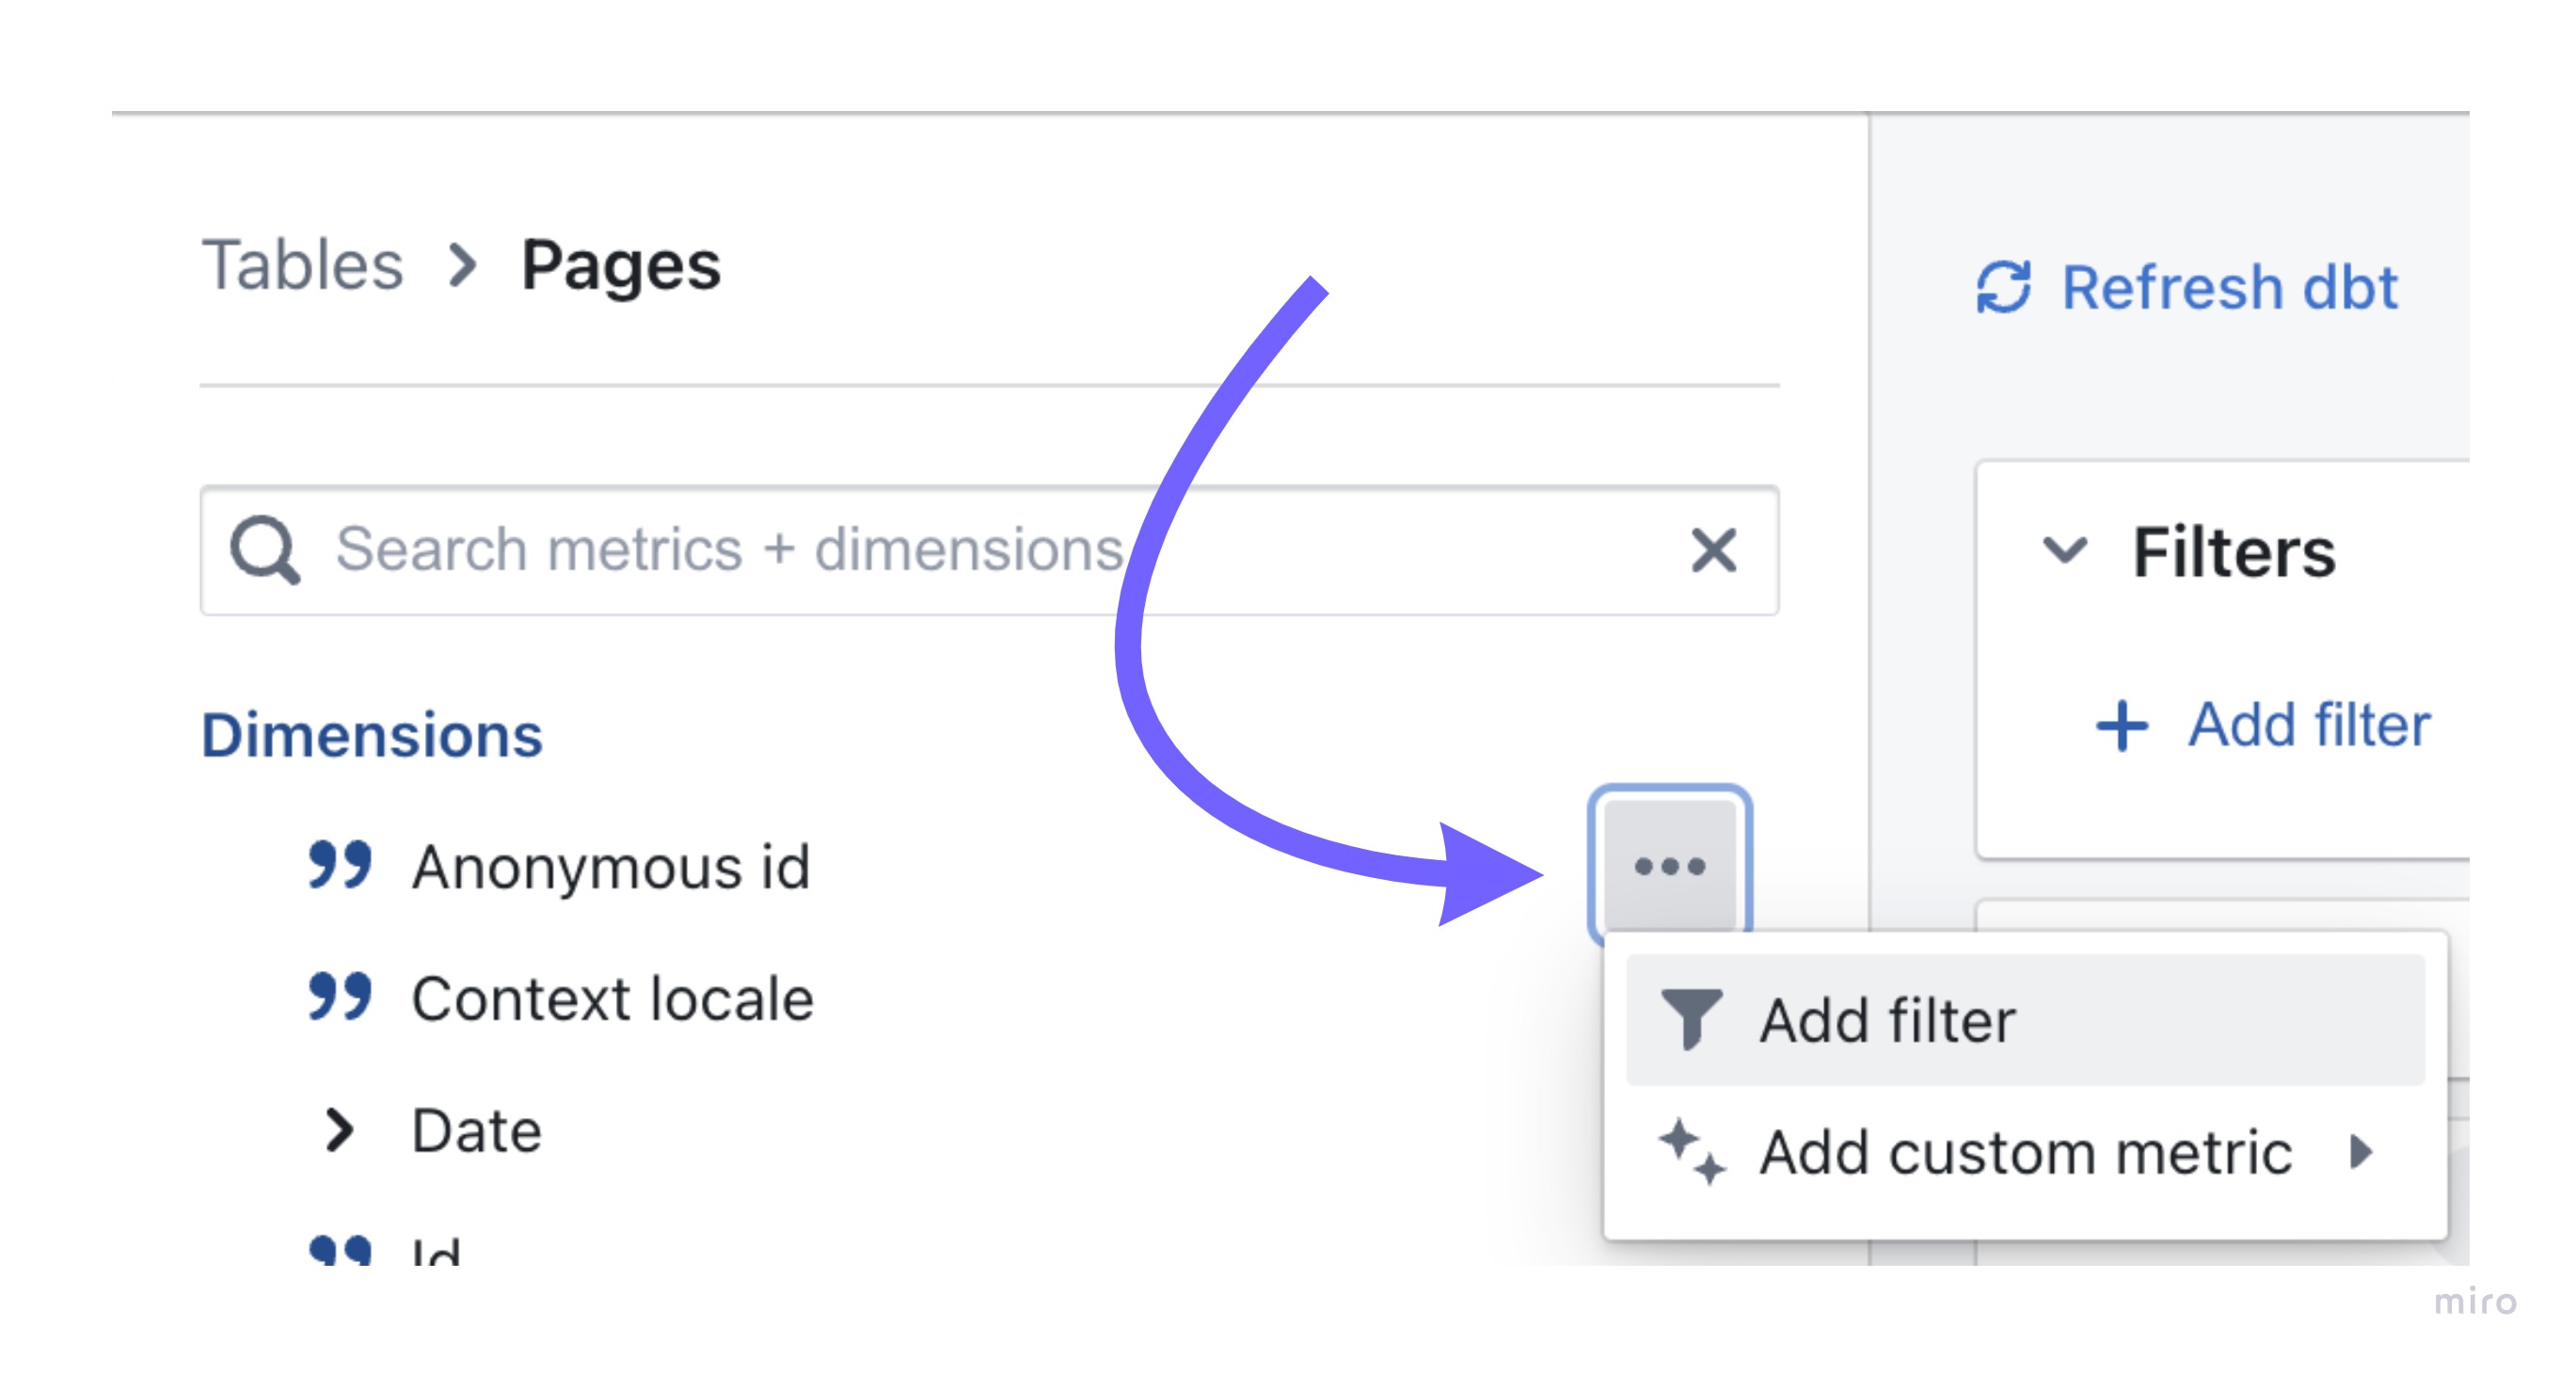
Adding a filter from the sidebar
It's easy to add filters directly from the list of fields in the sidebar. Just click on the options for a field, then click add filter.
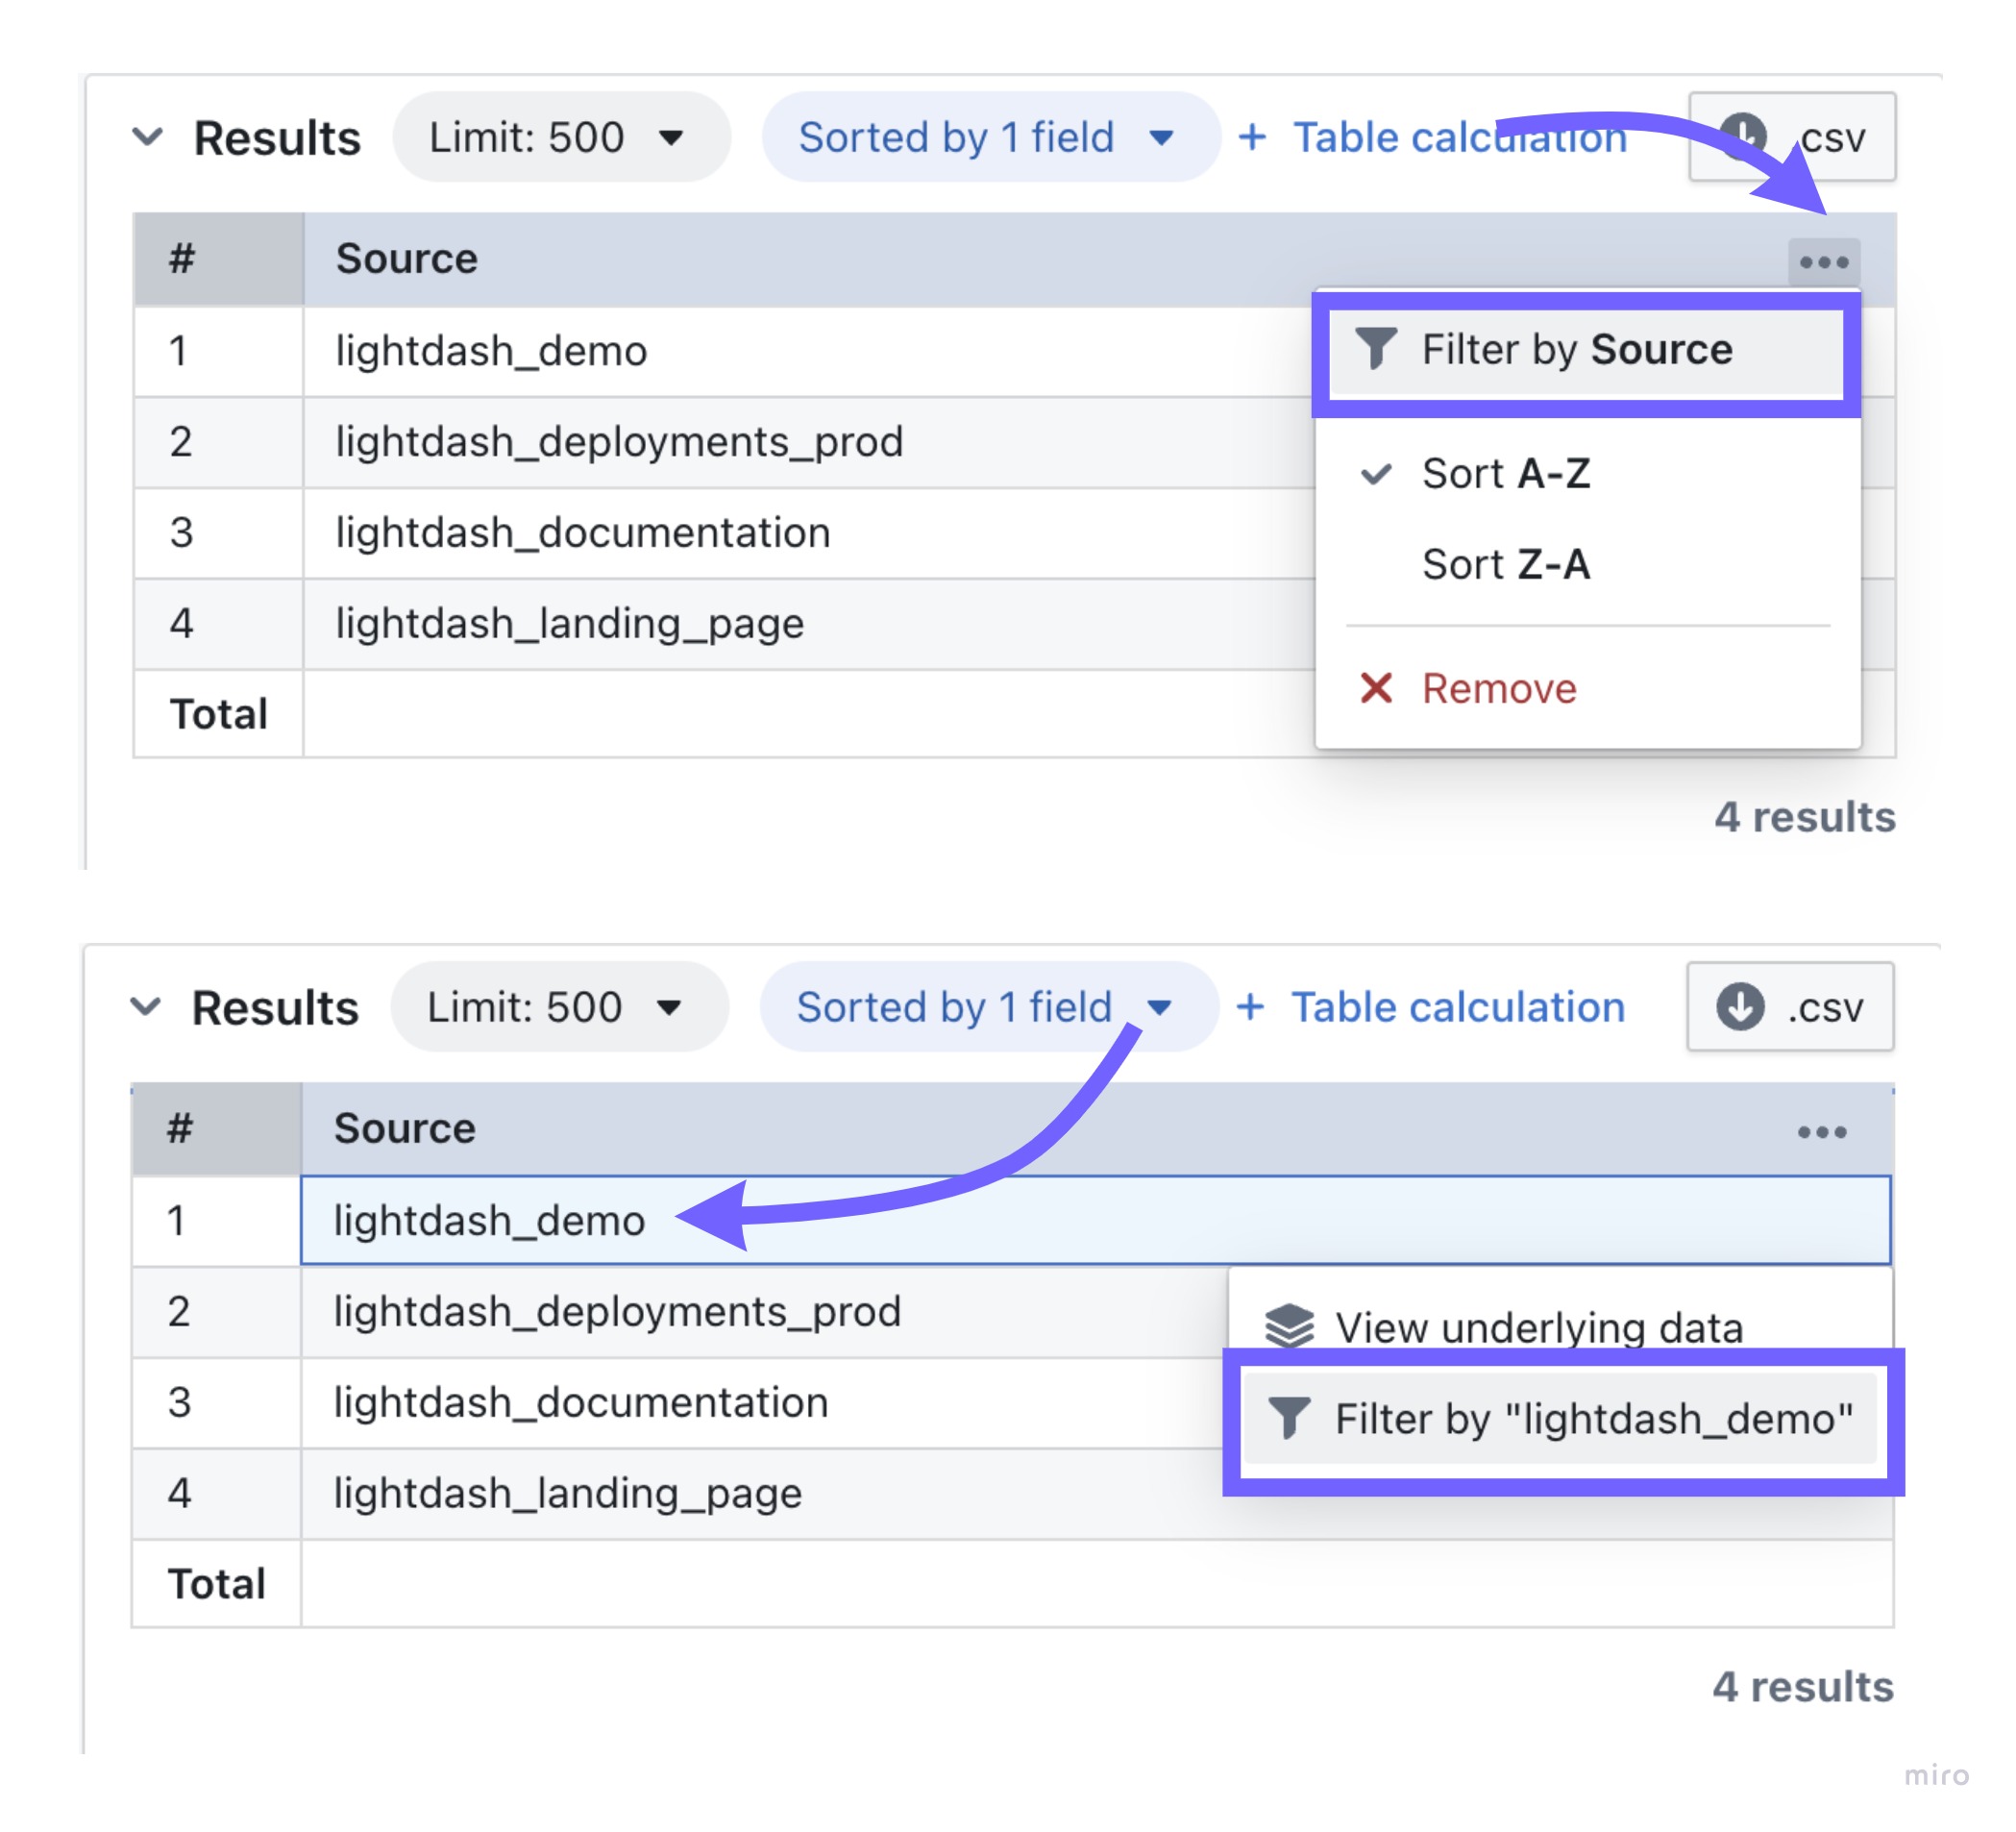
Adding a filter from the results table
Once you have some results in your results table, you can add filters by clicking on the three-dot menu of the column you want to filter on, or by clicking on the value you want to filter by.
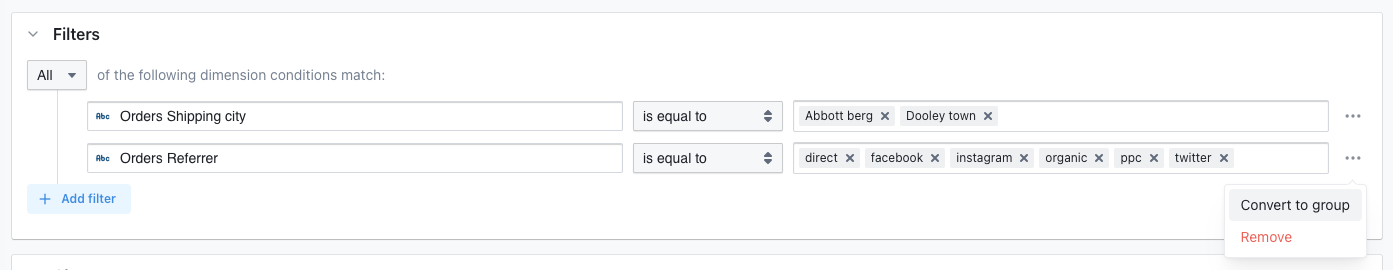
Adding nested filters
You can add nested filters by clicking on the options button on the right-hand side of the filter and then click on convert to group.
Then, you can add a new filter to the nested filter by clicking add filter.
Adding filters to your dashboard
There are a couple of ways that you can add filters to your Dashboards.
Adding temporary filters to your dashboard
If you add a temporary filter to your dasboard, then only you will see the filters you've applied (you won't be changing the dashboard for everyone who comes to look at it). If you want to save the dashboard filters you're adding, then check out adding saved filters to your dashboard.
There are two ways to add temporary filters to your dashboard.
Adding temporary filters using the add filters button
- Open up your dashboard.
- Click
add filter, then specify the field that you want to filter on and the value you want to filter by.
- If you want, you can adjust which tiles the filter is applied to by clicking on the
Tilestab.
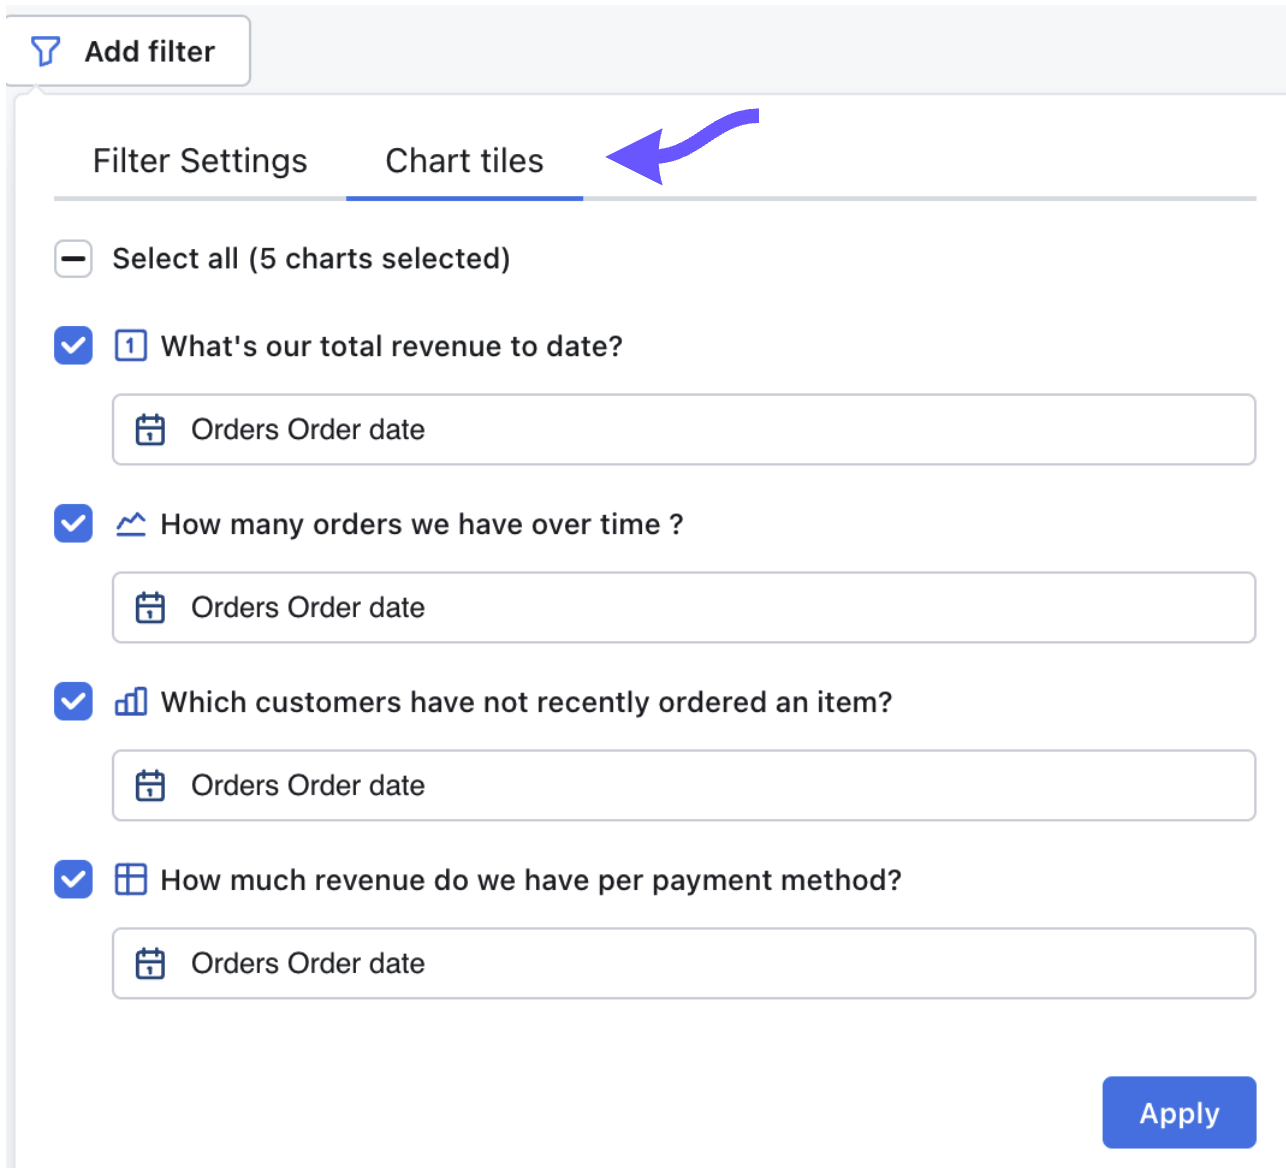
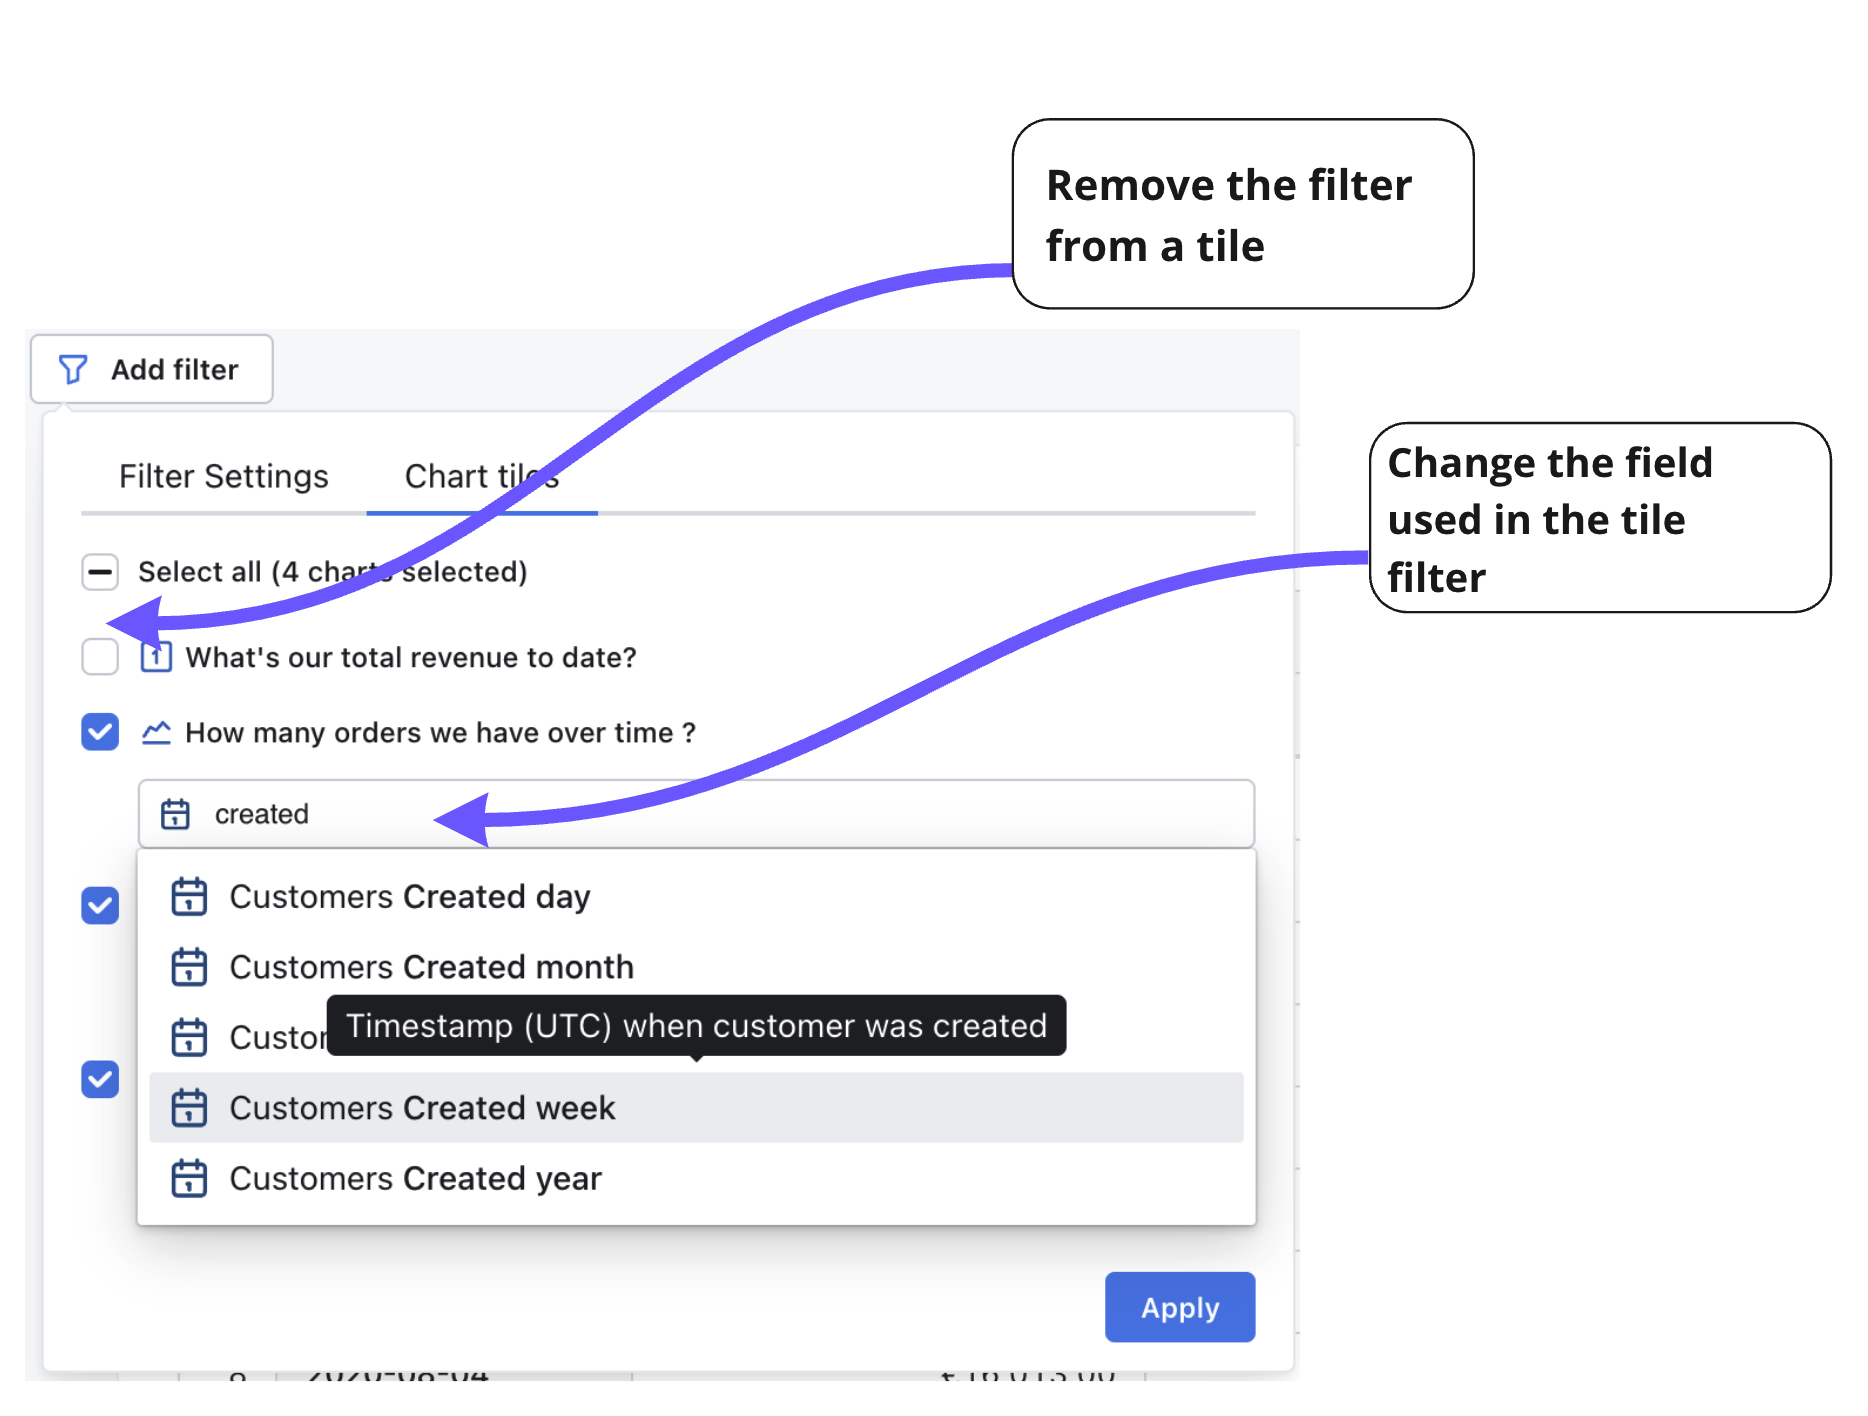
You can remove the filter from a certain tile, or you can change which field the filter is applied to in a tile.
- And voilà! Your filters will pop up on the top of your dashboard.

Cross filtering your dashboard using values in your tiles
Cross-filtering lets you interact with one chart and apply that interaction as a filter to other charts in the dashboard. You can filter the dashboard using cross filtering by:
- Clicking on one of the values in the chart.
- Selecting the value you want to filter on from the drop-down list.
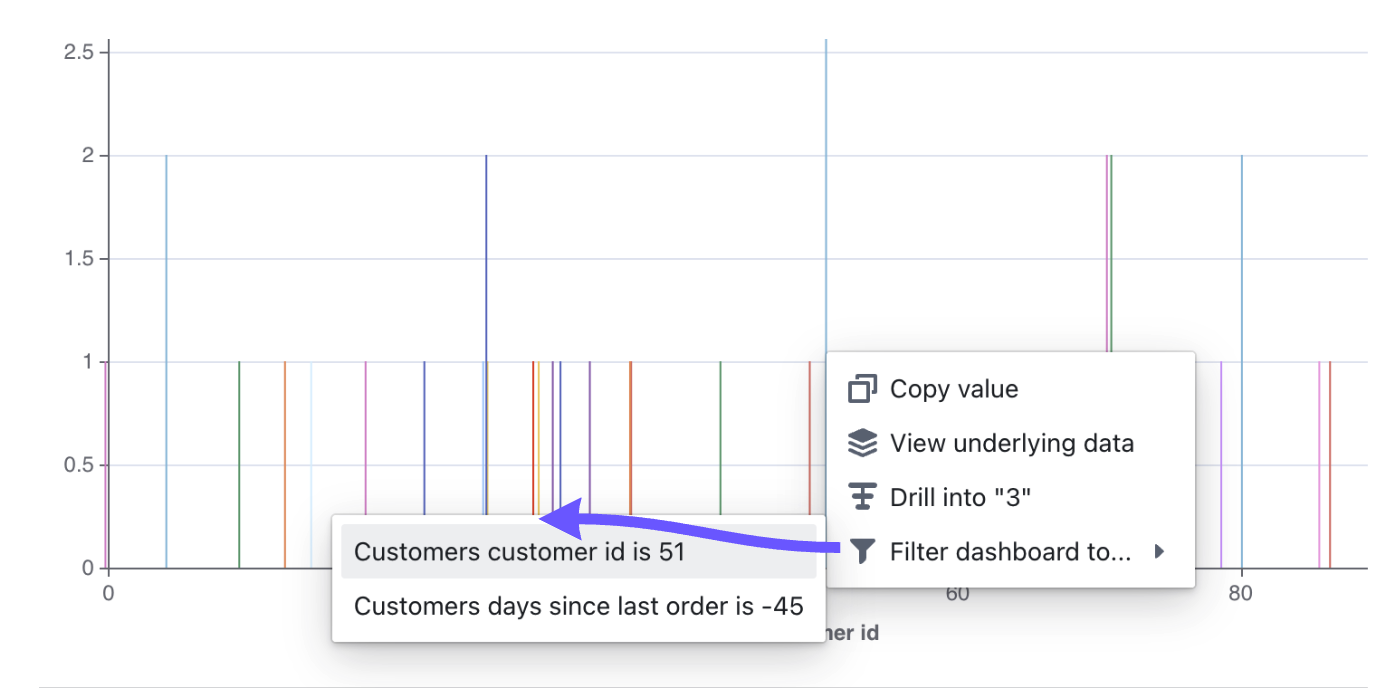
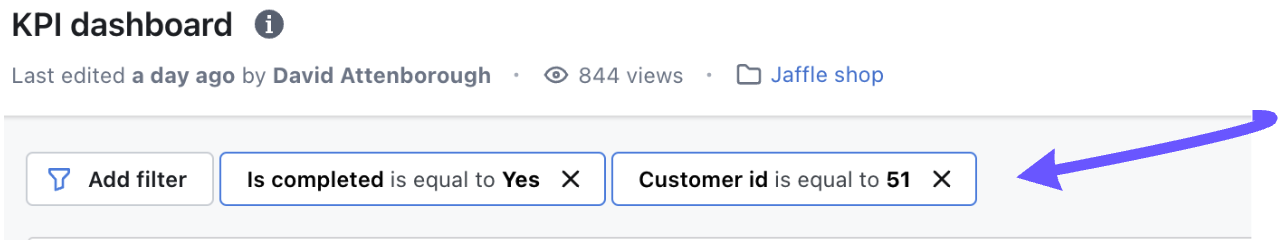
- Now, your filter will pop up on the top of your dashboard.
Adding saved filters to your dashboard
If you add a saved filter to your dashboard, then anyone that opens the dashboard will see the saved filters applied.
To add saved filters, you just:
- Open up your dashboard.
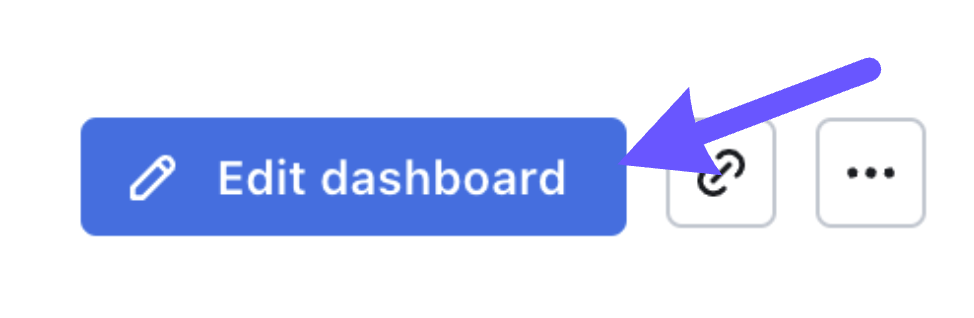
- Make sure you're in
editmode (if you're not, you should see the option to clickEdit Dashboard)
- Click
add filter, then specify the dimension or metric that you want to filter on.
You can leave the value blank, or you can specify a value that you want to filter by:
4.1. If you leave the value blank, then no filter will be applied to the tiles in your dashboard. Importantly, this provides dashboard viewers the option to define a value in the filter, enabling them to tailor the results to their needs.
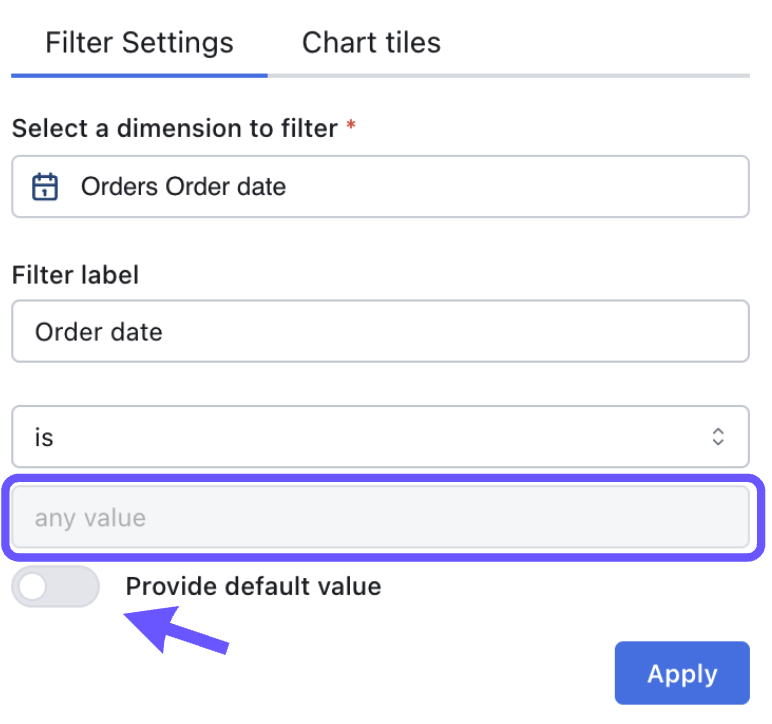 4.2. If you want to specify a value, ensure you toggle 'Default value' so that you can apply a filter to the tiles in your dashboard.
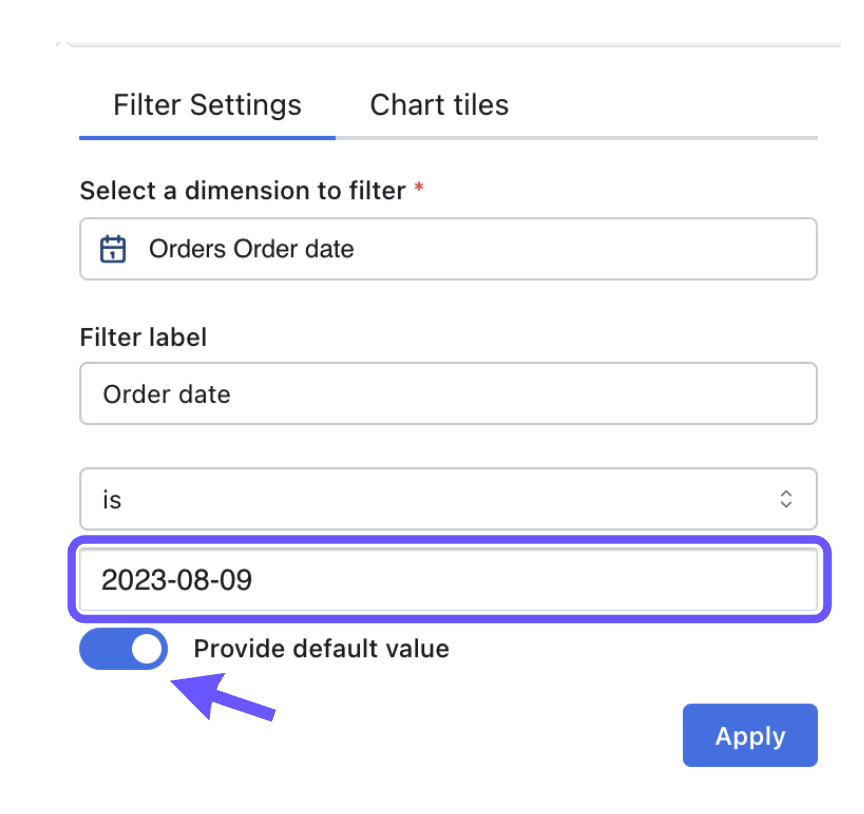
If you want, you can adjust which tiles the filter is applied to by clicking on the
Tilestab.
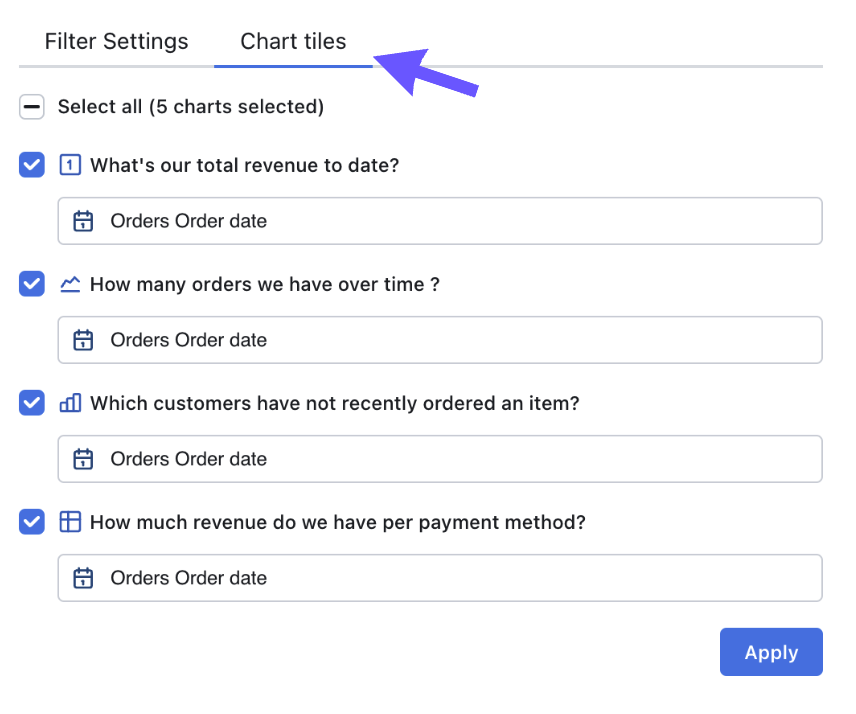
You can remove the filter from a certain tile, or you can change which field the filter is applied to in a tile.
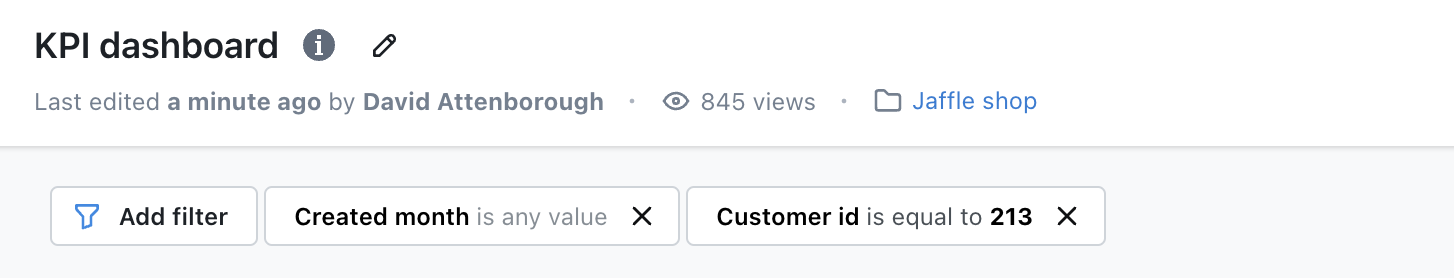
- Click
apply, and your filters will pop up on the top of your dashboard.
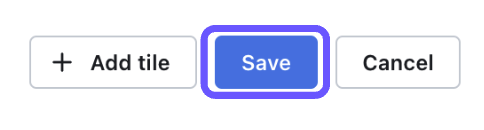
- Once you have all of the filters you want, just hit
saveto save your filter settings.
- Now, whenever someone opens the dashboard, they'll see your saved filters applied!
- And if they want to drill-down into the data, they can always change the filters by clicking on the filter and adjusting the values.
To add saved filters to your dashboard, you must be an editor or an admin for your project.
Some things worth mentioning about dashboard filters
Sharing your dashboard with overrides
You might want to share a dashboard with someone with custom filters applied. To do this, you have to be in view mode. Then, you can either/or:
- Apply temporary filters to your dashboard and share the link with the filters applied.
- Apply changes(overrides) to your saved filters and share the link with the filters applied.
Rules for sharing dashboards with filters applied:
- In view mode and when adding a temporary filter, you can change the field, value, operator, and tiles this is applied to. But, you can't change the filter type (e.g. from
temporary filtertosaved filter). - In view mode and when overriding a saved filter, you can only change the value and operator, so the field and tile configuration will remain the same.
- In edit mode, when changing a saved filter (with an override present), once you save the changes (click "Apply"), the override for that filter will be removed.
The same behaviour applies when exporting dashboards.
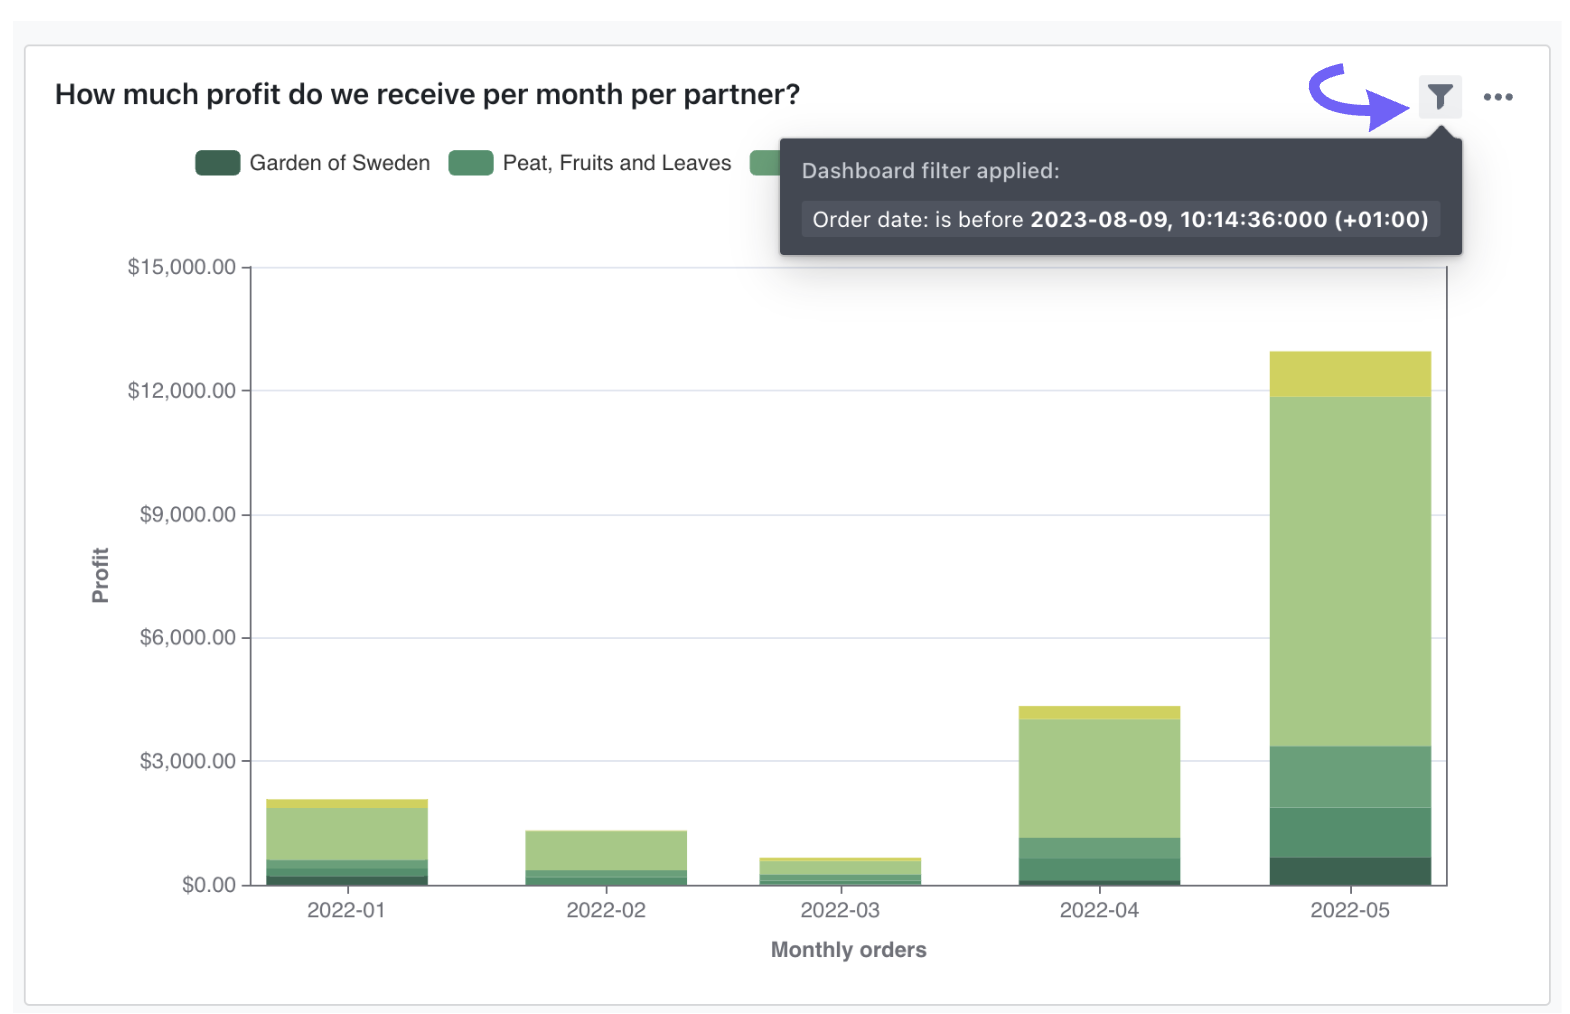
You can easily see which dashboard tiles have which filters applied to them
If a tile in a dashboard has a filter applied to it, you'll see the text dashboard filter applied on the tile.
You can also hover over this to see which filters have been applied to that tile.
Dashboard filters are added to the filters applied in a saved chart so ALL the conditions match
For example, if I had a chart for Sales in Asia and I filtered to country is equal to China, India, Japan. Then, on my dashboard I added a filter country is equal to India. My saved chart's filter would still be included, and my new dashboard filter would be applied as well, so the tile in the dashboard would be filtered to include:
country is equal to China, India, Japan AND country is equal to India
So, the result? My tile would only include Sales where the country = India.
Here's another example using a date filter: If my original saved chart was filtered to only include orders completed on or after April 3rd, 2022. But, I add a date filter to my dashboard to include orders completed on or after August 1st, 2022, then the dashboard filter would be added to the saved chart filter and I'll end up with the chart filtered by orders completed on or after August 1st, 2022.