> ## Documentation Index
> Fetch the complete documentation index at: https://docs.lightdash.com/llms.txt
> Use this file to discover all available pages before exploring further.
# Date zoom
> Change the time granularity of charts on your dashboard without editing them
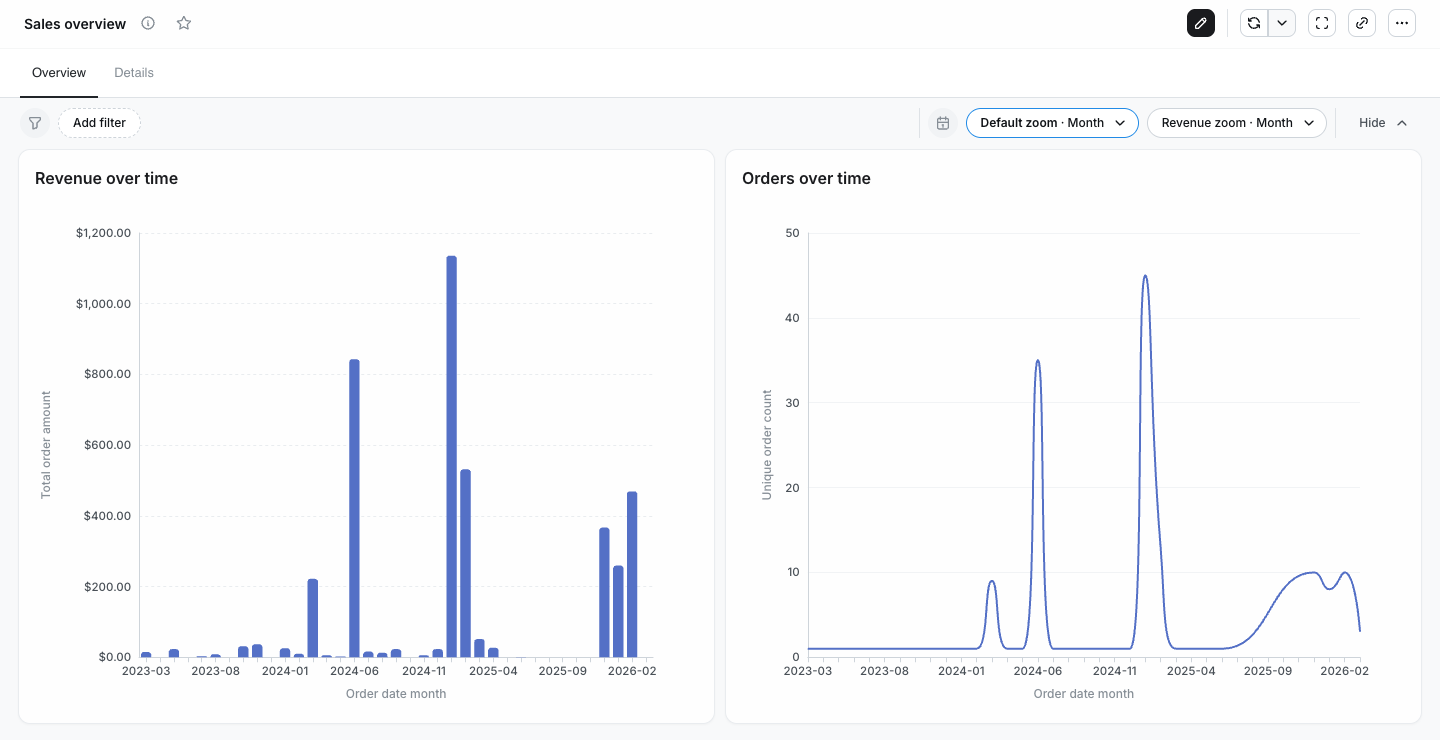
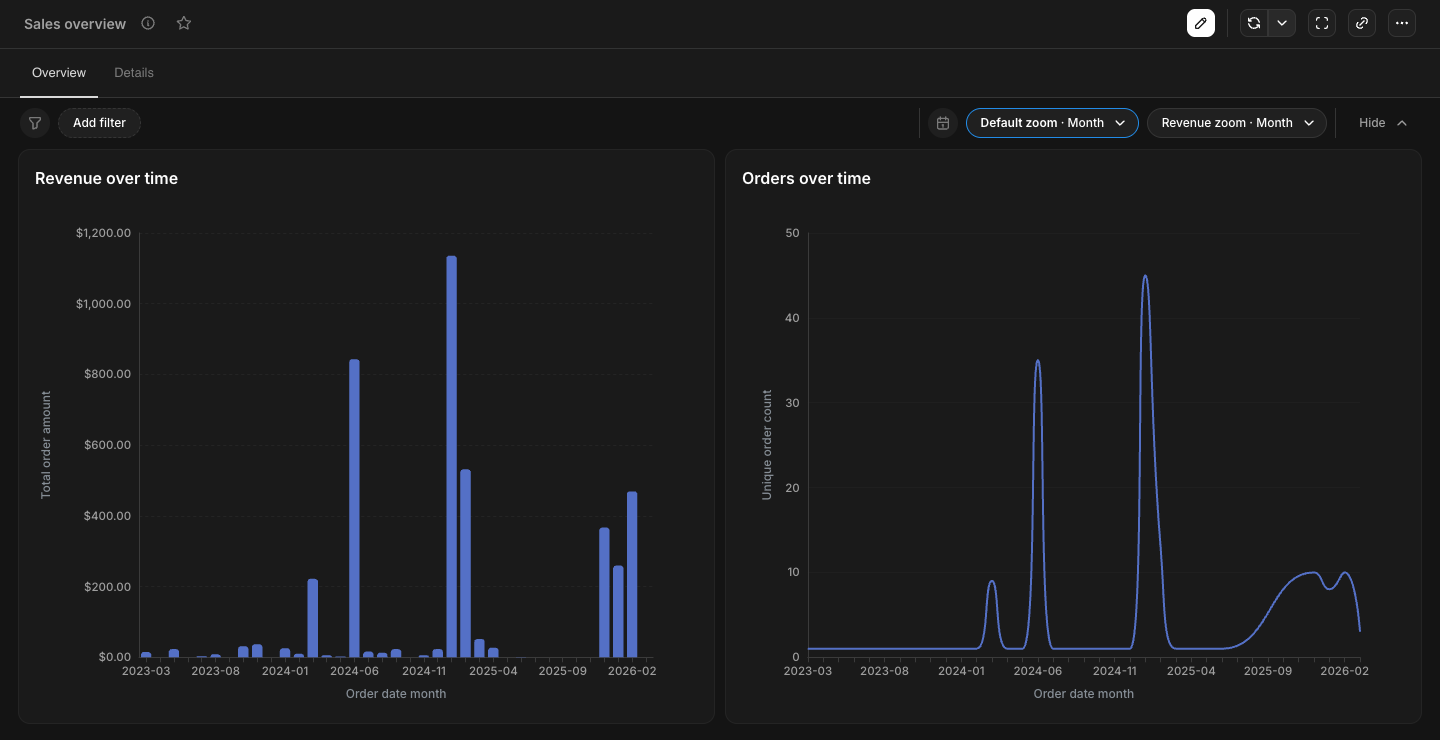
Date zoom lets viewers change the date granularity of time-based charts on a dashboard without editing them. This is useful for zooming in to see daily patterns or zooming out to identify long-term trends.
Date zoom works through **controls**, which behave like dashboard filters: each control is a pill in the dashboard toolbar that sets a granularity, and editors choose which charts each control governs. A dashboard has one built-in **Default zoom** plus any number of named controls you add.
 ## How date zoom works
When viewing a dashboard, open a date zoom control and pick a granularity (Day, Week, Month, Quarter, Year, or a custom granularity). Every chart governed by that control updates to show data at the chosen granularity. Pick **None** to restore the charts' original granularity.
**Key behaviors:**
* A control only affects charts that have a date dimension in their results.
* The **Default zoom** governs every date-zoomable chart that isn't attached to a named control. It's hidden from viewers when every chart belongs to a named control.
* Each named control governs only the charts you attach to it, using a specific date field per chart.
* A chart can belong to at most one control. Charts already attached elsewhere show an **In *\[control name]*** badge and can't be selected by another control.
* Changes made by viewers are temporary. Refreshing the dashboard restores the configured defaults.
## Configuring available granularities
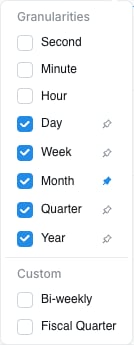
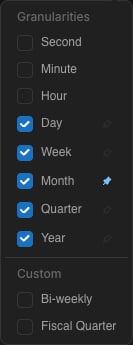
The granularities offered by **every** control on the dashboard are set on the **Default zoom** pill. Named controls can only offer granularities you've enabled here.
## How date zoom works
When viewing a dashboard, open a date zoom control and pick a granularity (Day, Week, Month, Quarter, Year, or a custom granularity). Every chart governed by that control updates to show data at the chosen granularity. Pick **None** to restore the charts' original granularity.
**Key behaviors:**
* A control only affects charts that have a date dimension in their results.
* The **Default zoom** governs every date-zoomable chart that isn't attached to a named control. It's hidden from viewers when every chart belongs to a named control.
* Each named control governs only the charts you attach to it, using a specific date field per chart.
* A chart can belong to at most one control. Charts already attached elsewhere show an **In *\[control name]*** badge and can't be selected by another control.
* Changes made by viewers are temporary. Refreshing the dashboard restores the configured defaults.
## Configuring available granularities
The granularities offered by **every** control on the dashboard are set on the **Default zoom** pill. Named controls can only offer granularities you've enabled here.
 ### Setting available granularities
1. Open the dashboard in edit mode
2. Open the **Default zoom** dropdown
3. Use the checkboxes to enable or disable granularities
4. At least one granularity must remain enabled
5. Save the dashboard to persist your changes
### Setting a default granularity
You can pin a granularity as the default that's automatically applied when the dashboard loads:
1. In the **Default zoom** dropdown, click the pin icon next to a granularity
2. The pinned granularity becomes the default
3. Click the pin again to remove the default
When a default is set, the dashboard automatically applies that granularity on load (unless overridden by a URL parameter). New controls also start at this granularity.
Default granularities don't apply when the dashboard is loaded with a granularity already specified in the URL.
## Creating date zoom controls
Named controls let you point different charts at different granularities, or scope a single zoom to a chosen set of charts (including charts on other tabs).
1. Open the dashboard in edit mode
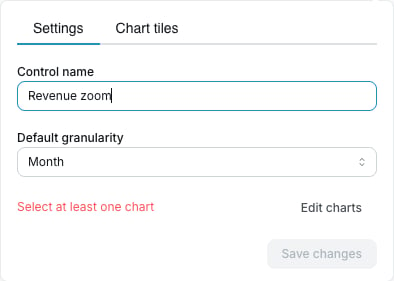
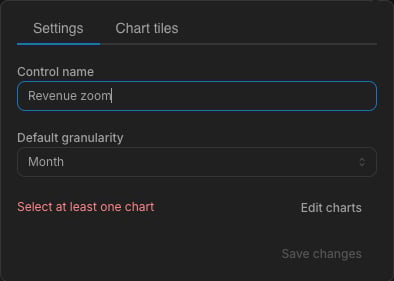
2. Click **Add date zoom**
3. In the **Settings** tab, give the control a name and pick its default granularity
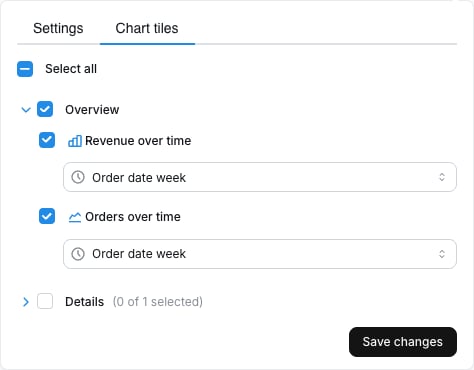
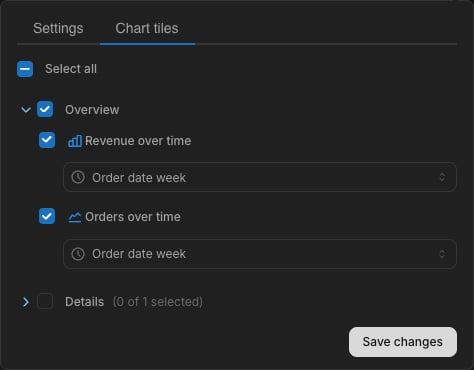
4. In the **Chart tiles** tab, select the charts this control should govern. For each selected chart, choose the **date field** the zoom applies to. Charts are grouped by tab, and you can use **Select all** or a tab's checkbox to attach many at once.
5. A control must target at least one chart before you can save. Click **Save changes**, then save the dashboard.
### Setting available granularities
1. Open the dashboard in edit mode
2. Open the **Default zoom** dropdown
3. Use the checkboxes to enable or disable granularities
4. At least one granularity must remain enabled
5. Save the dashboard to persist your changes
### Setting a default granularity
You can pin a granularity as the default that's automatically applied when the dashboard loads:
1. In the **Default zoom** dropdown, click the pin icon next to a granularity
2. The pinned granularity becomes the default
3. Click the pin again to remove the default
When a default is set, the dashboard automatically applies that granularity on load (unless overridden by a URL parameter). New controls also start at this granularity.
Default granularities don't apply when the dashboard is loaded with a granularity already specified in the URL.
## Creating date zoom controls
Named controls let you point different charts at different granularities, or scope a single zoom to a chosen set of charts (including charts on other tabs).
1. Open the dashboard in edit mode
2. Click **Add date zoom**
3. In the **Settings** tab, give the control a name and pick its default granularity
4. In the **Chart tiles** tab, select the charts this control should govern. For each selected chart, choose the **date field** the zoom applies to. Charts are grouped by tab, and you can use **Select all** or a tab's checkbox to attach many at once.
5. A control must target at least one chart before you can save. Click **Save changes**, then save the dashboard.
 To edit an existing control, open its pill and choose **Configure**; to delete it, choose **Remove**. Viewers can change a control's granularity from its pill, or pick **Reset to default** to return it to its configured granularity.
Only charts with a date or timestamp dimension in their results are eligible to be attached to a control. A chart with no zoomable date field won't appear in the **Chart tiles** list.
## Using custom granularities
Custom granularities defined in your `lightdash.config.yml` appear in date zoom dropdowns alongside standard options, below a visual divider. This is useful for business-specific time periods like fiscal quarters or custom week definitions.
See the [dimensions reference](/references/dimensions#using-custom-granularities) for how to create and configure custom granularities.
## Hiding or showing date zoom on a dashboard
You can control date zoom visibility at two levels:
* **Hide the whole date zoom section:** in edit mode, click the **eye icon** on the date zoom section chip in the dashboard toolbar. When hidden, no date zoom controls are shown to viewers.
* **Hide an individual control:** in edit mode, click the **eye icon** next to a control's pill. A hidden control isn't shown to viewers, but its granularity still applies to the charts it governs.
Save the dashboard to persist visibility changes. You can show a section or control again at any time by toggling the eye icon back on in edit mode.
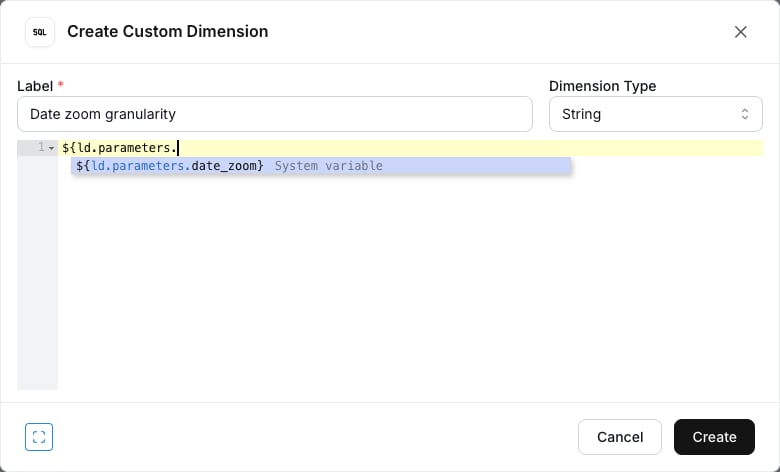
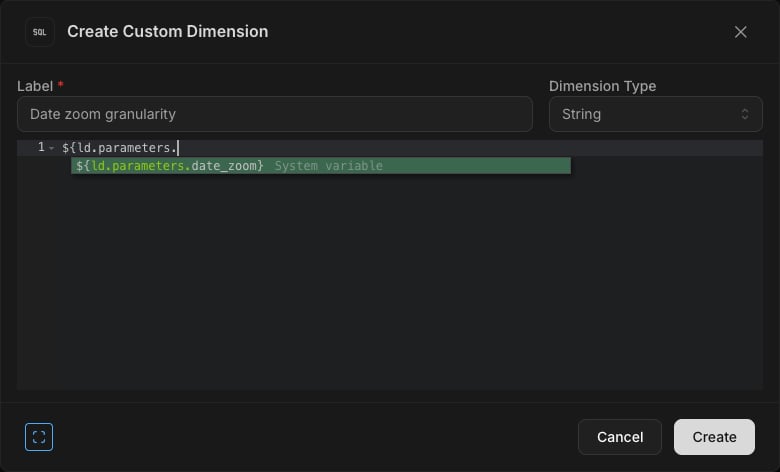
## Referencing the date zoom in custom SQL
The currently selected date zoom granularity is exposed as a built-in [reserved parameter](/guides/developer/using-parameters#reserved-parameters) called `date_zoom`. You can reference it in custom SQL anywhere parameters are supported:
```sql theme={null}
${ld.parameters.date_zoom}
```
It resolves to the granularity name in lowercase (for example `day`, `week`, `month`, `quarter`, `year`, or a [custom granularity](/references/lightdash-config-yml#custom-granularities-configuration) name). When no date zoom is selected, the value is an empty string.
To edit an existing control, open its pill and choose **Configure**; to delete it, choose **Remove**. Viewers can change a control's granularity from its pill, or pick **Reset to default** to return it to its configured granularity.
Only charts with a date or timestamp dimension in their results are eligible to be attached to a control. A chart with no zoomable date field won't appear in the **Chart tiles** list.
## Using custom granularities
Custom granularities defined in your `lightdash.config.yml` appear in date zoom dropdowns alongside standard options, below a visual divider. This is useful for business-specific time periods like fiscal quarters or custom week definitions.
See the [dimensions reference](/references/dimensions#using-custom-granularities) for how to create and configure custom granularities.
## Hiding or showing date zoom on a dashboard
You can control date zoom visibility at two levels:
* **Hide the whole date zoom section:** in edit mode, click the **eye icon** on the date zoom section chip in the dashboard toolbar. When hidden, no date zoom controls are shown to viewers.
* **Hide an individual control:** in edit mode, click the **eye icon** next to a control's pill. A hidden control isn't shown to viewers, but its granularity still applies to the charts it governs.
Save the dashboard to persist visibility changes. You can show a section or control again at any time by toggling the eye icon back on in edit mode.
## Referencing the date zoom in custom SQL
The currently selected date zoom granularity is exposed as a built-in [reserved parameter](/guides/developer/using-parameters#reserved-parameters) called `date_zoom`. You can reference it in custom SQL anywhere parameters are supported:
```sql theme={null}
${ld.parameters.date_zoom}
```
It resolves to the granularity name in lowercase (for example `day`, `week`, `month`, `quarter`, `year`, or a [custom granularity](/references/lightdash-config-yml#custom-granularities-configuration) name). When no date zoom is selected, the value is an empty string.
 This is useful for adapting your SQL to the granularity the viewer picked on the dashboard, without defining a user parameter:
```sql theme={null}
CASE
WHEN ${ld.parameters.date_zoom} = 'week' THEN 'Weekly'
WHEN ${ld.parameters.date_zoom} = 'month' THEN 'Monthly'
WHEN ${ld.parameters.date_zoom} = '' THEN 'No date zoom applied'
ELSE 'Other'
END
```
See [Reserved parameters](/guides/developer/using-parameters#reserved-parameters) for the full list and behavior.
## Referencing the granularity in chart labels
You can also reference the active granularity directly in chart labels — useful for axis names, series names and slice labels that should update when a viewer changes the date zoom (or when a chart is saved at a fixed granularity).
Use the following placeholder in any supported label, where `table_field` is the base date dimension on the chart (for example `orders_order_date`):
```text theme={null}
${table_field.granularity}
```
At render time the placeholder is replaced with the granularity actually used to compile the query, lowercased — for example `day`, `week`, `month`, `quarter`, `year`, or a [custom granularity](/references/lightdash-config-yml#custom-granularities-configuration) label.
For example, a y-axis label of `Orders per ${orders_order_date.granularity}` renders as `Orders per week` when the dashboard is zoomed to a weekly granularity.
When you type `$` in an axis name, big-value label, or gauge label, autocomplete lists every base date dimension on the chart so you can insert the placeholder without remembering the exact field id.
You don't need to remember the exact field id — Lightdash will insert the placeholder for you:
* **Cartesian axis names, big-value labels, and gauge labels** — type `$` in the label field and autocomplete lists every base date dimension on the chart.
* **Pie group labels and funnel step labels** — click the **insert date granularity** icon inside the editable label field to insert the placeholder for the matching date dimension.
**Supported labels:**
* [**Big value**](/references/chart-types/big-value) — label and comparison label
* [**Bar, line, area, scatter, and mixed charts**](/guides/configure-charts) — x-axis name, y-axis name, and series names
* [**Pie chart**](/references/chart-types/pie-chart) — group labels
* [**Gauge**](/references/chart-types/gauge) — custom value label and custom percentage label
* [**Funnel chart**](/references/chart-types/funnel-chart) — step labels
If the referenced dimension isn't on the chart, the placeholder is left untouched so you can see what's missing.
Pie group labels and funnel step labels are per-category overrides — each custom label is keyed to a specific slice or step value. Because date zoom re-buckets dates (for example, the monthly `2024-07` slice becomes a weekly `2024-07-15` slice), an override set at one granularity stops matching after a viewer zooms to another and the custom label silently falls back to the raw value. If you need a label that survives date zoom, prefer the cartesian, big-value, or gauge labels above.
## Date zoom in embedded dashboards
Date zoom can be enabled or disabled in embedded dashboards using the `canDateZoom` option in your JWT token:
```javascript theme={null}
{
content: {
type: 'dashboard',
dashboardUuid: 'your-dashboard-uuid',
canDateZoom: true, // Enable date zoom in embed
}
}
```
When `canDateZoom` is enabled, embedded dashboards render the dashboard's configured date zoom controls (the Default zoom plus any named controls), not just a single global control. This applies to both JWT embeds and the React SDK, which share the same embedded dashboard rendering.
See the [embedding reference](/references/embedding#date-zoom) for complete details.
## Related
Define business-specific time periods
Cross-filtering, drill into, and more
Configure time intervals on dimensions
Embed dashboards with date zoom
This is useful for adapting your SQL to the granularity the viewer picked on the dashboard, without defining a user parameter:
```sql theme={null}
CASE
WHEN ${ld.parameters.date_zoom} = 'week' THEN 'Weekly'
WHEN ${ld.parameters.date_zoom} = 'month' THEN 'Monthly'
WHEN ${ld.parameters.date_zoom} = '' THEN 'No date zoom applied'
ELSE 'Other'
END
```
See [Reserved parameters](/guides/developer/using-parameters#reserved-parameters) for the full list and behavior.
## Referencing the granularity in chart labels
You can also reference the active granularity directly in chart labels — useful for axis names, series names and slice labels that should update when a viewer changes the date zoom (or when a chart is saved at a fixed granularity).
Use the following placeholder in any supported label, where `table_field` is the base date dimension on the chart (for example `orders_order_date`):
```text theme={null}
${table_field.granularity}
```
At render time the placeholder is replaced with the granularity actually used to compile the query, lowercased — for example `day`, `week`, `month`, `quarter`, `year`, or a [custom granularity](/references/lightdash-config-yml#custom-granularities-configuration) label.
For example, a y-axis label of `Orders per ${orders_order_date.granularity}` renders as `Orders per week` when the dashboard is zoomed to a weekly granularity.
When you type `$` in an axis name, big-value label, or gauge label, autocomplete lists every base date dimension on the chart so you can insert the placeholder without remembering the exact field id.
You don't need to remember the exact field id — Lightdash will insert the placeholder for you:
* **Cartesian axis names, big-value labels, and gauge labels** — type `$` in the label field and autocomplete lists every base date dimension on the chart.
* **Pie group labels and funnel step labels** — click the **insert date granularity** icon inside the editable label field to insert the placeholder for the matching date dimension.
**Supported labels:**
* [**Big value**](/references/chart-types/big-value) — label and comparison label
* [**Bar, line, area, scatter, and mixed charts**](/guides/configure-charts) — x-axis name, y-axis name, and series names
* [**Pie chart**](/references/chart-types/pie-chart) — group labels
* [**Gauge**](/references/chart-types/gauge) — custom value label and custom percentage label
* [**Funnel chart**](/references/chart-types/funnel-chart) — step labels
If the referenced dimension isn't on the chart, the placeholder is left untouched so you can see what's missing.
Pie group labels and funnel step labels are per-category overrides — each custom label is keyed to a specific slice or step value. Because date zoom re-buckets dates (for example, the monthly `2024-07` slice becomes a weekly `2024-07-15` slice), an override set at one granularity stops matching after a viewer zooms to another and the custom label silently falls back to the raw value. If you need a label that survives date zoom, prefer the cartesian, big-value, or gauge labels above.
## Date zoom in embedded dashboards
Date zoom can be enabled or disabled in embedded dashboards using the `canDateZoom` option in your JWT token:
```javascript theme={null}
{
content: {
type: 'dashboard',
dashboardUuid: 'your-dashboard-uuid',
canDateZoom: true, // Enable date zoom in embed
}
}
```
When `canDateZoom` is enabled, embedded dashboards render the dashboard's configured date zoom controls (the Default zoom plus any named controls), not just a single global control. This applies to both JWT embeds and the React SDK, which share the same embedded dashboard rendering.
See the [embedding reference](/references/embedding#date-zoom) for complete details.
## Related
Define business-specific time periods
Cross-filtering, drill into, and more
Configure time intervals on dimensions
Embed dashboards with date zoom