> ## Documentation Index
> Fetch the complete documentation index at: https://docs.lightdash.com/llms.txt
> Use this file to discover all available pages before exploring further.
# Custom project charts
> Reusable chart types you build once for your project, then use like any built-in chart type
Project chart types are reusable chart types you build for your project. You describe the chart you want, Lightdash builds it, and anyone in the project can then use it like a built-in chart type. Pick **Custom** in the chart type menu, then choose the chart type in the **Custom chart type** picker.
For a one-off chart written directly as a Vega-Lite spec, see [Custom Vega charts](/explore/chart-types/custom-vega-charts).
A project chart type is a chart type you build once and reuse. Describe the chart you want - a calendar heatmap, a hexbin map, a custom KPI layout - and Lightdash builds it, along with the inputs it needs (for example a "Category" dimension and a "Value" metric). Anyone in the project can then pick it as a chart type, map their own fields to its inputs, and save the result like any other chart.
The same chart type can power many saved charts, each with its own query and field mapping.
Project chart types are an enterprise feature, enabled by default on Lightdash Cloud. Self-hosted instances need the [data apps runtime configured](/self-host/data-apps).
## Browsing chart types
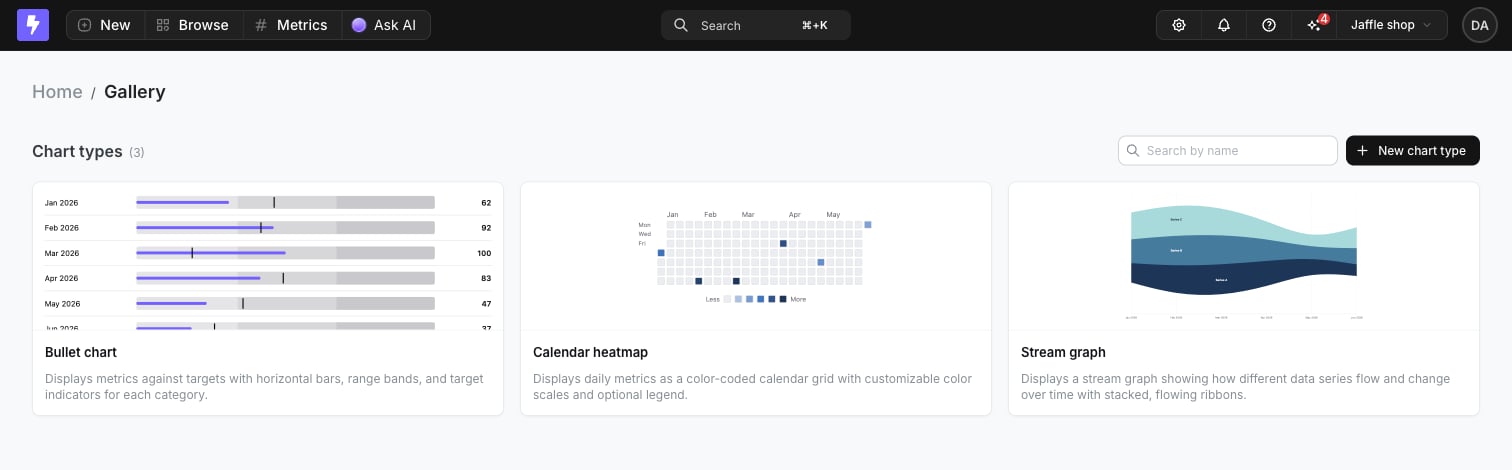
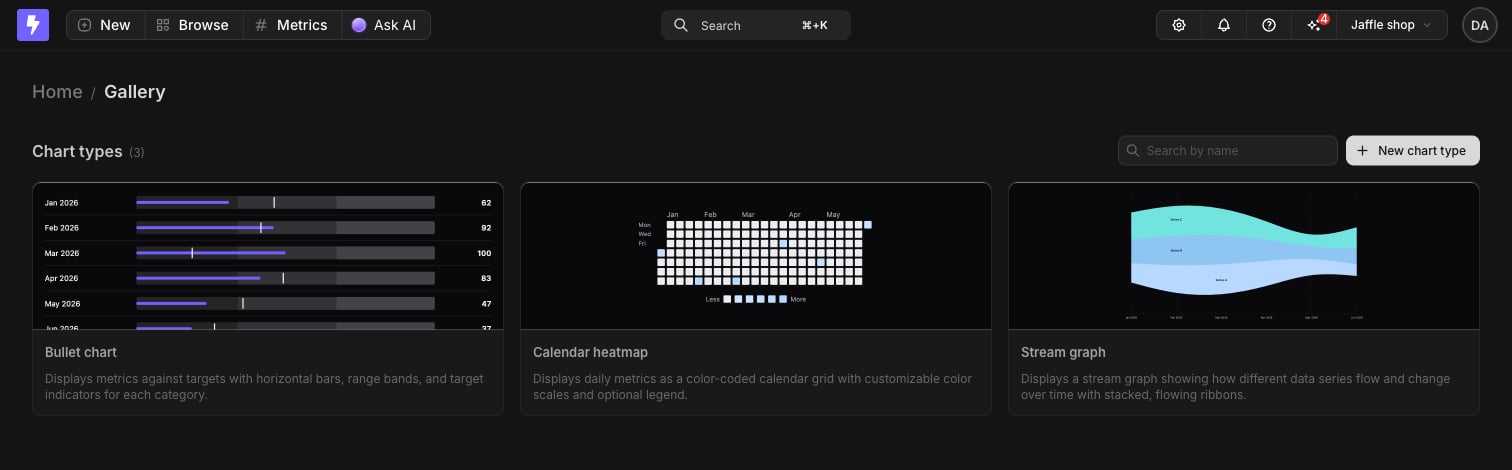
Every chart type in the project lives in the gallery. Go to **Browse** and pick **Chart types**.
Each card previews the chart type with sample data. Click a card to see its description, who built it, its inputs, and its current version, and to preview it in the Explorer, edit it, or delete it.
 ## Building a chart type
Click **New chart type** in the gallery to open the builder, then describe the chart you want.
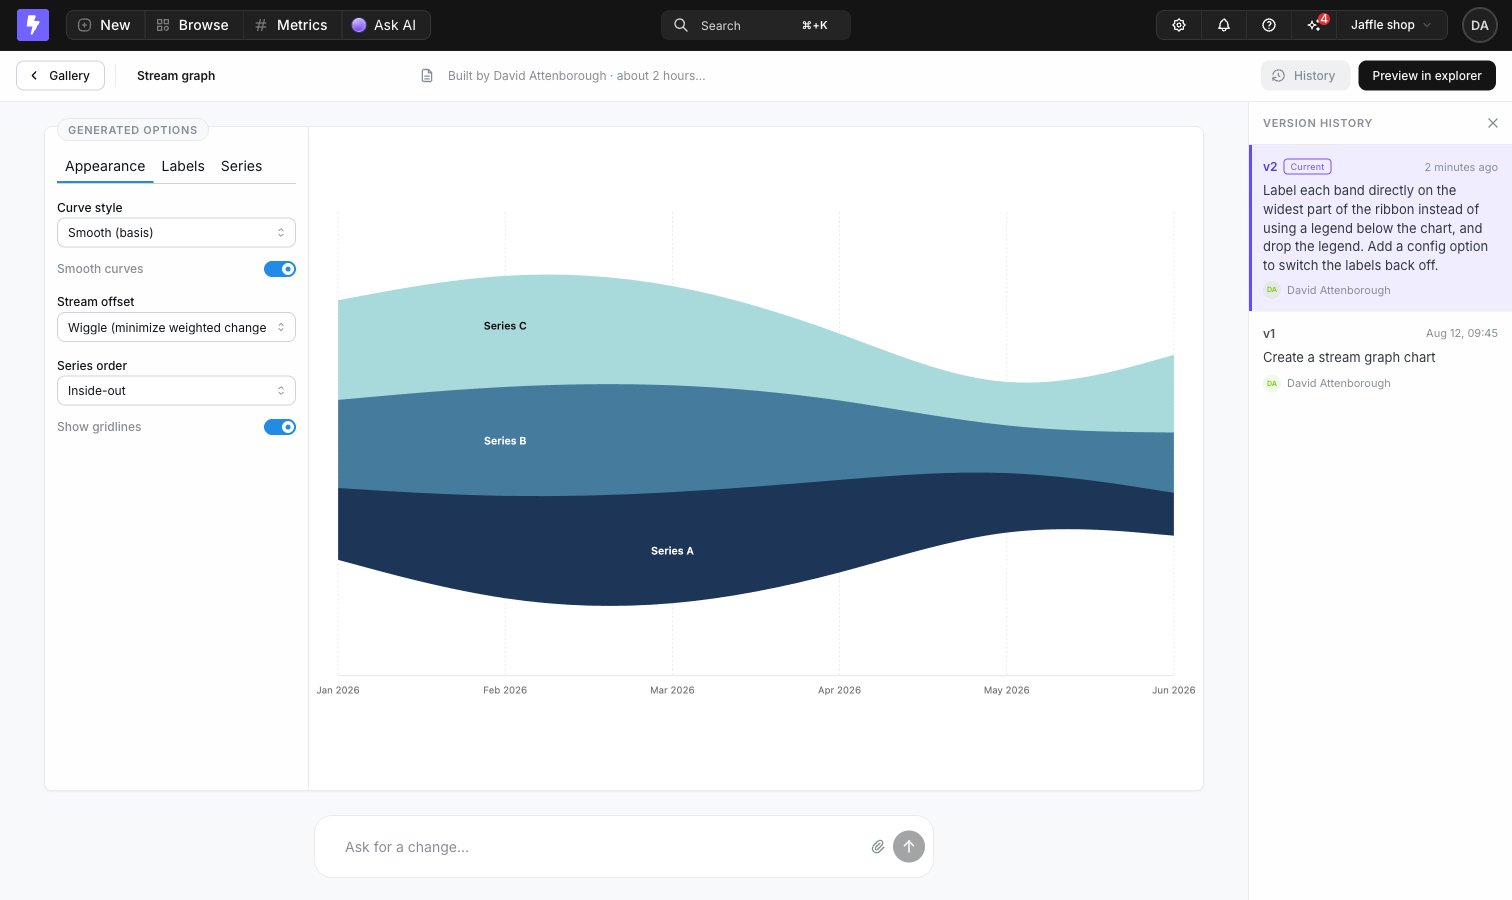
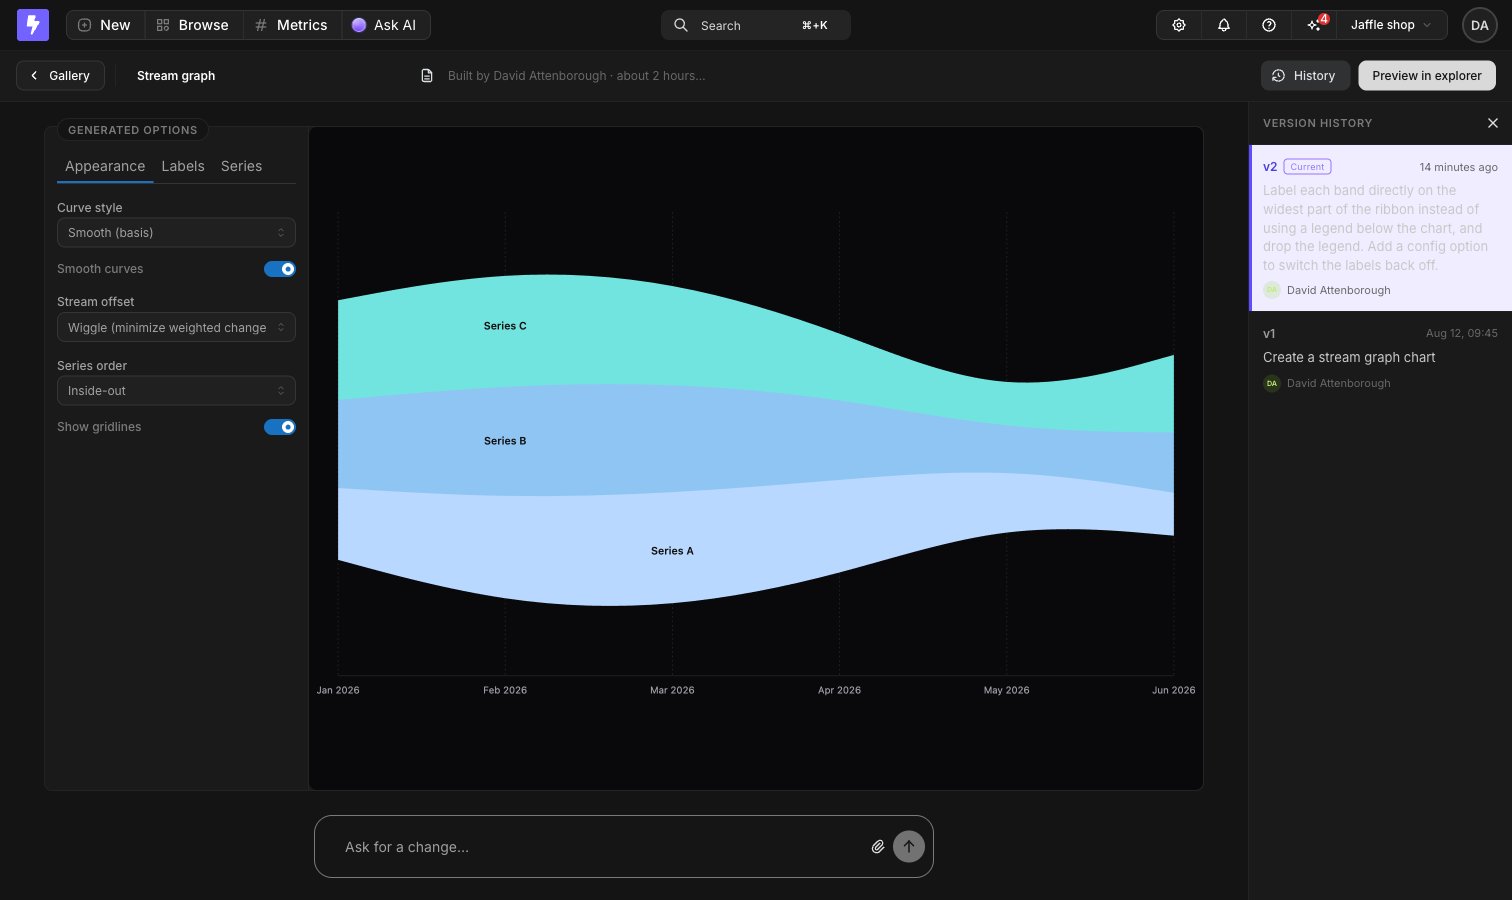
The builder previews the chart type with sample data as it's built. The **Configure** panel beside the preview holds the display options the chart type declares, along with a color palette to preview it against. Follow-up prompts create new versions, and **History** opens a panel where you can view an earlier version or restore it.
Name and describe the chart type in the header - that's what people see in the gallery and in the chart type picker. When it looks right, click **Preview in explorer** to try it against a real query.
## Building a chart type
Click **New chart type** in the gallery to open the builder, then describe the chart you want.
The builder previews the chart type with sample data as it's built. The **Configure** panel beside the preview holds the display options the chart type declares, along with a color palette to preview it against. Follow-up prompts create new versions, and **History** opens a panel where you can view an earlier version or restore it.
Name and describe the chart type in the header - that's what people see in the gallery and in the chart type picker. When it looks right, click **Preview in explorer** to try it against a real query.
 You can also start one from any chart, without leaving the Explorer: pick **Custom** as the chart type and choose **Create new chart type** in the picker.
Chart types can also be developed on your machine and uploaded with the CLI. See [Data apps as code](/data-apps/download-data-apps-as-code).
## Using a chart type in a chart
Select the dimensions and metrics your chart needs and run the query. You have to run it before you can pick a custom chart type.
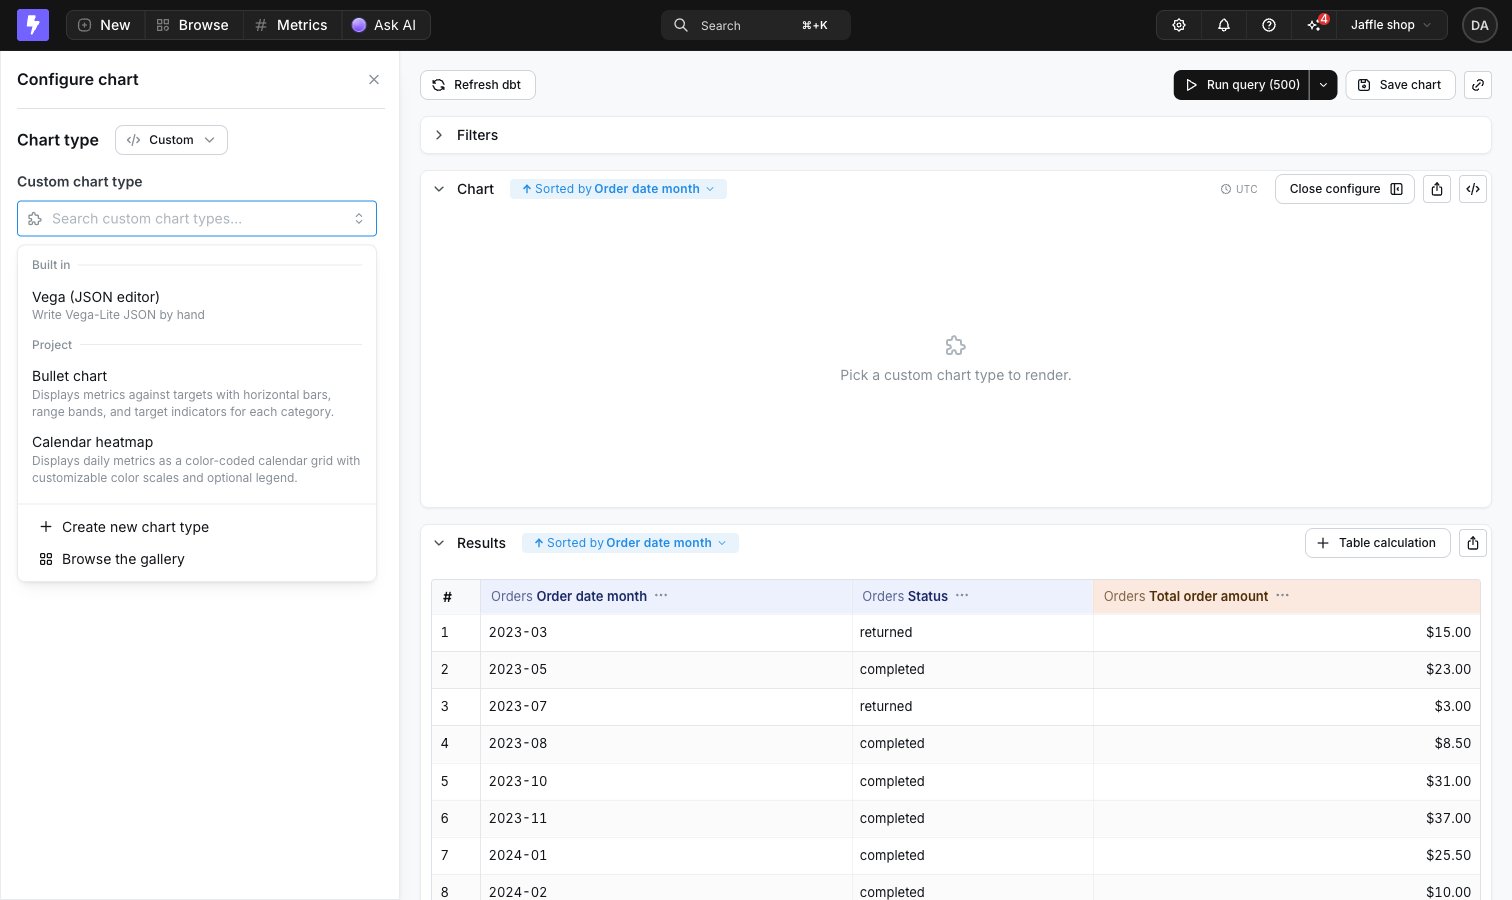
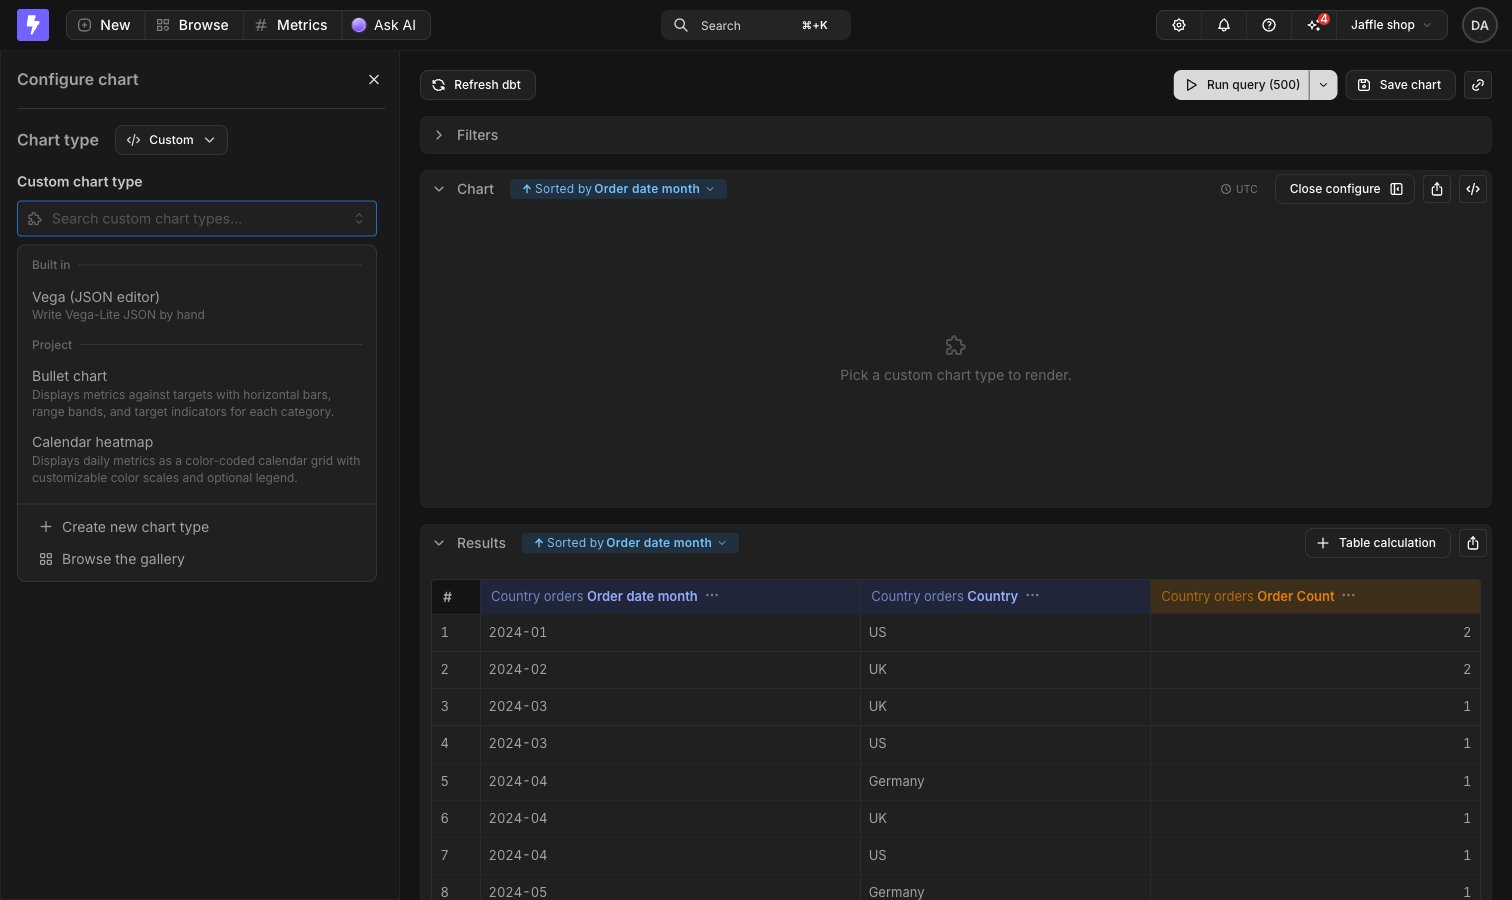
Open **Configure**, choose **Custom** in the chart type menu, then pick one from the **Project** group in the **Custom chart type** picker. Only chart types that finished building are listed.
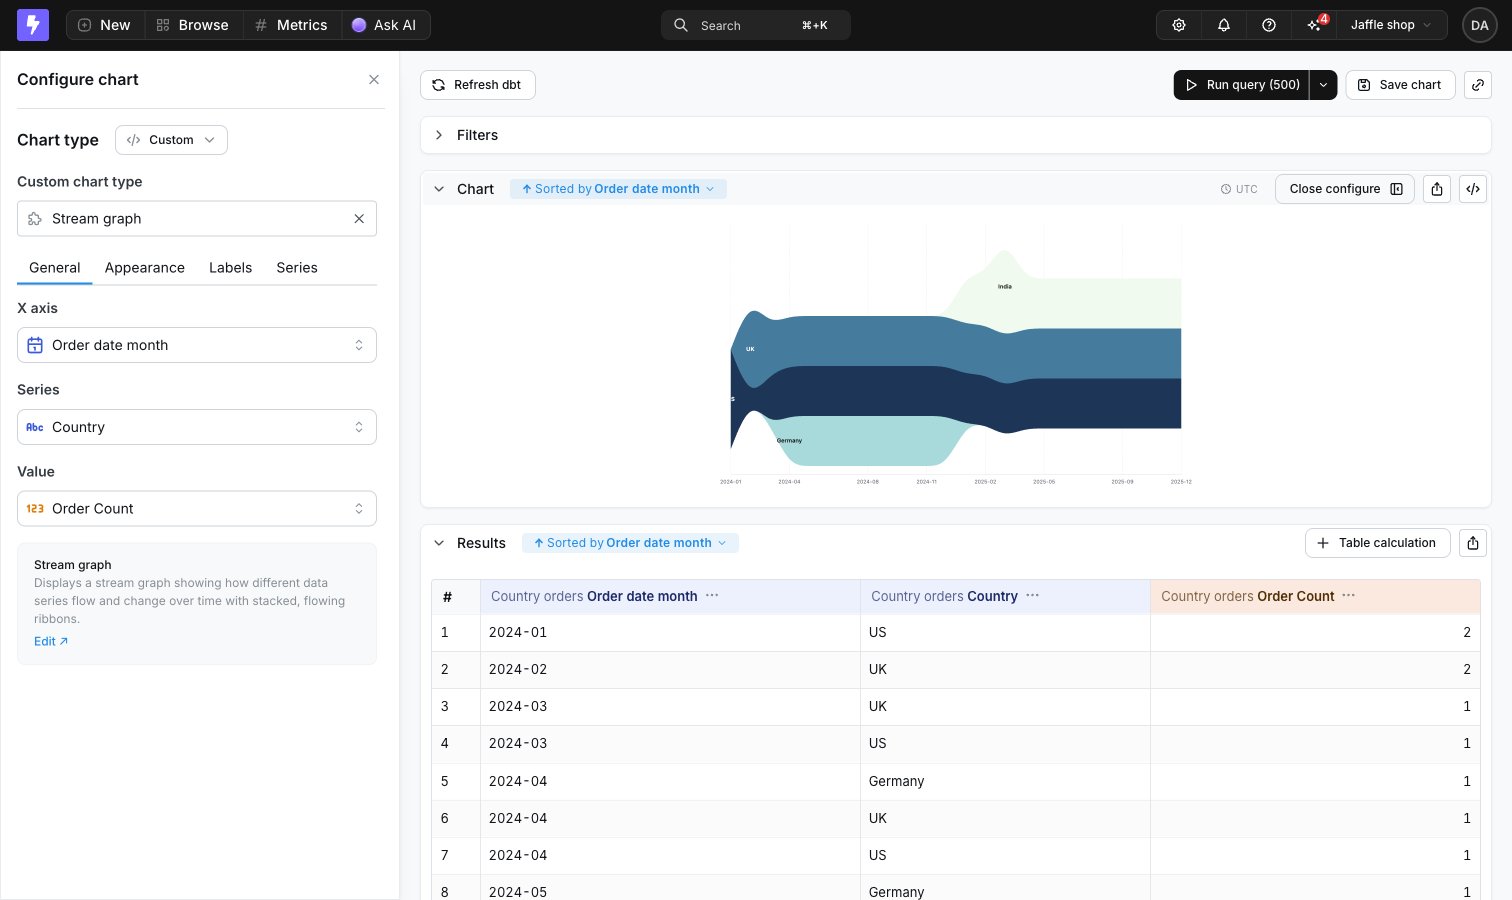
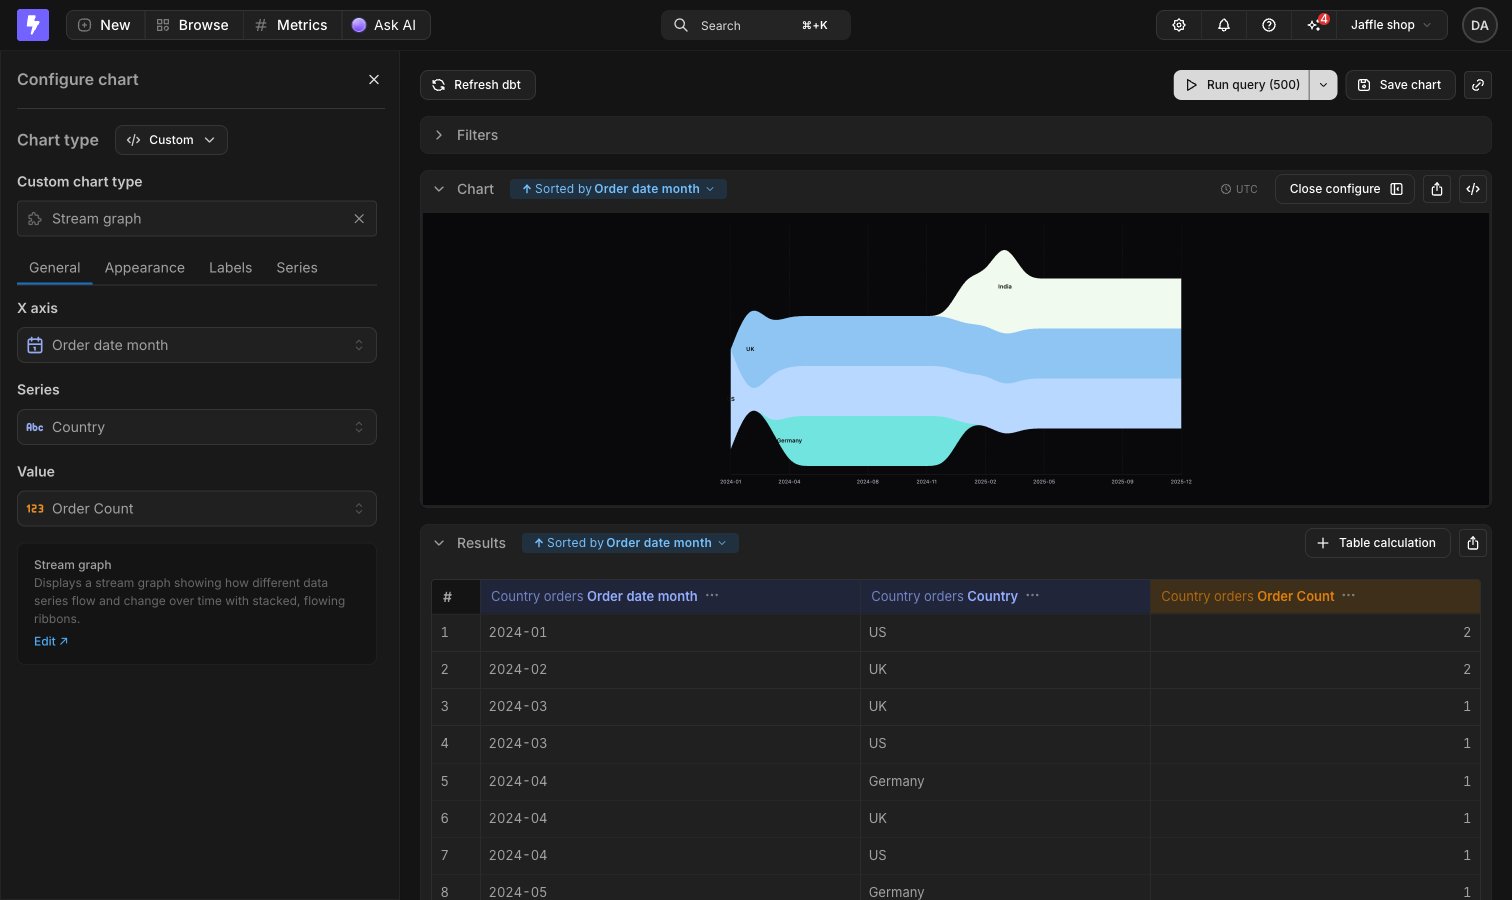
Each of the chart type's inputs gets a field picker, the same as configuring axes on a bar or line chart. Required inputs can't be cleared.
You can also start one from any chart, without leaving the Explorer: pick **Custom** as the chart type and choose **Create new chart type** in the picker.
Chart types can also be developed on your machine and uploaded with the CLI. See [Data apps as code](/data-apps/download-data-apps-as-code).
## Using a chart type in a chart
Select the dimensions and metrics your chart needs and run the query. You have to run it before you can pick a custom chart type.
Open **Configure**, choose **Custom** in the chart type menu, then pick one from the **Project** group in the **Custom chart type** picker. Only chart types that finished building are listed.
Each of the chart type's inputs gets a field picker, the same as configuring axes on a bar or line chart. Required inputs can't be cleared.
 The chart re-renders as you change the mapping or the underlying query.
 ## Saving and dashboards
Save the chart like any other chart. The saved chart remembers which chart type it uses and how its inputs are mapped.
Saved charts render in chart view and as dashboard tiles, driven by each surface's own query - dashboard filters and [date zoom](/explore/dashboards/date-zoom) apply like any other chart tile.
## Permissions
Chart types are available across the whole project. They don't live in spaces and can't be moved into one.
* Anyone who can view a chart can see the chart type it renders with.
* Editors and above can build new chart types.
* You can edit and delete the chart types you built. Project admins can edit and delete any of them.
## Saving and dashboards
Save the chart like any other chart. The saved chart remembers which chart type it uses and how its inputs are mapped.
Saved charts render in chart view and as dashboard tiles, driven by each surface's own query - dashboard filters and [date zoom](/explore/dashboards/date-zoom) apply like any other chart tile.
## Permissions
Chart types are available across the whole project. They don't live in spaces and can't be moved into one.
* Anyone who can view a chart can see the chart type it renders with.
* Editors and above can build new chart types.
* You can edit and delete the chart types you built. Project admins can edit and delete any of them.